EXHIBIT 99.1
Published on June 5, 2017

Deluxe Corporation
Investor Presentation – June 2017
2
Forward-Looking Statements
This presentation contains forward-looking statements based upon information
available to management as of the date hereof and management assumes no
obligation to update or revise any such forward-looking statements. All estimates
and projections are subject to risks and uncertainties that could cause actual
future results to differ materially from those results estimated or projected.
Additional information about various factors that could cause actual results to
differ from those projected can be found in the Company’s Form 10-K for the
year ended December 31, 2016.
Non-GAAP financial measures discussed in this presentation are reconciled to
the comparable GAAP financial measure at the end of this presentation in the
appendix.
Any estimates, projections, expectations, outlook, etc. in this presentation are
dated as of the first quarter 2017 earnings release on April 27, 2017. No
forward-looking statements are being reaffirmed by inclusion in this
presentation.

3
Lee Schram
Chief Executive Officer
Keith Bush
Chief Financial Officer
and Senior Vice President
Ed Merritt
Treasurer and Vice President
of Investor Relations
Deluxe Investor Contacts
4
About Deluxe… Did You Know?
• Majority of revenue recurring through diversified base of
products & services; faster growing Marketing Solutions &
Other Services (MOS) expected to represent 38% of revenue in
2017 and 40% in 2018
• Increased revenue from sources other than checks to over 53%
• 4.4 million active small business customers
• Trusted advisor to 5,600 financial institutions
• Deluxe solutions in 95 of top 100 U.S. financial institutions
• Consistent financial growth over past 7 years, including
revenue, earnings per share and operating cash flow
5
39%
29%
32%
Deluxe Overview
Financial Services (FS) Small Business Services (SBS) Direct Checks (DC)
Leading provider of products & services to
financial institutions
• ~5,600 customers
• Adjusted operating margin 21.4%
America’s leading direct-to-consumer
check supplier
• ~5.5 million customers
• Adjusted operating margin 34.6%
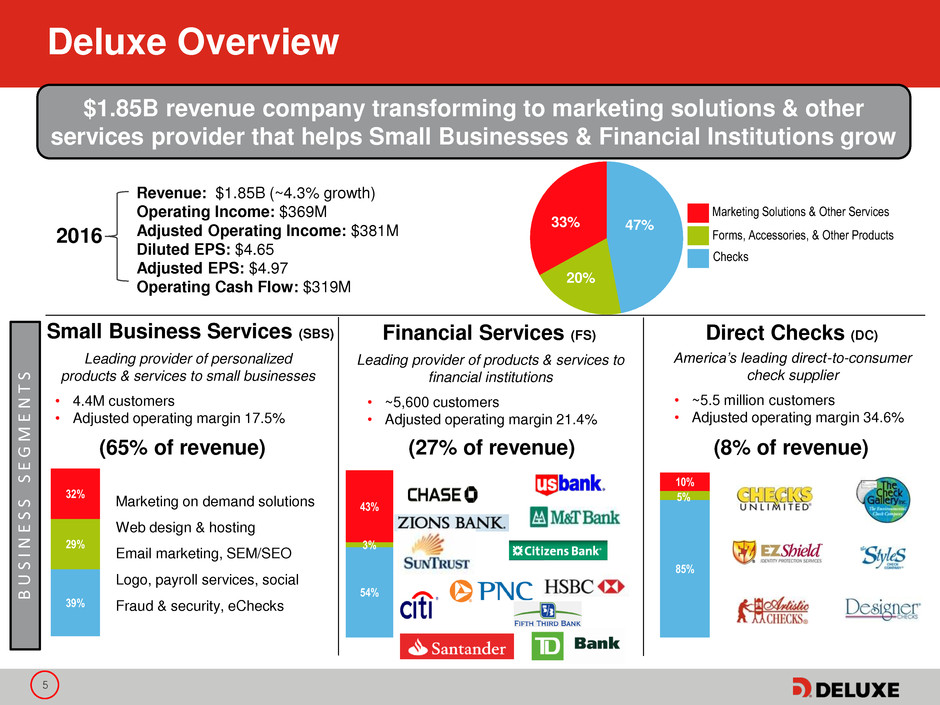
(27% of revenue)
54%
3%
43%
Marketing Solutions & Other Services
Forms, Accessories, & Other Products
Checks
47%
20%
33%
Revenue: $1.85B (~4.3% growth)
Operating Income: $369M
Adjusted Operating Income: $381M
Diluted EPS: $4.65
Adjusted EPS: $4.97
Operating Cash Flow: $319M
2016
(65% of revenue)
Leading provider of personalized
products & services to small businesses
• 4.4M customers
• Adjusted operating margin 17.5%
$1.85B revenue company transforming to marketing solutions & other
services provider that helps Small Businesses & Financial Institutions grow
(8% of revenue)
Marketing on demand solutions
Web design & hosting
Email marketing, SEM/SEO
Logo, payroll services, social
Fraud & security, eChecks
85%
5%
10%
B
U
S
I
N
E
S
S
S
E
G
M
E
N
T
S
6
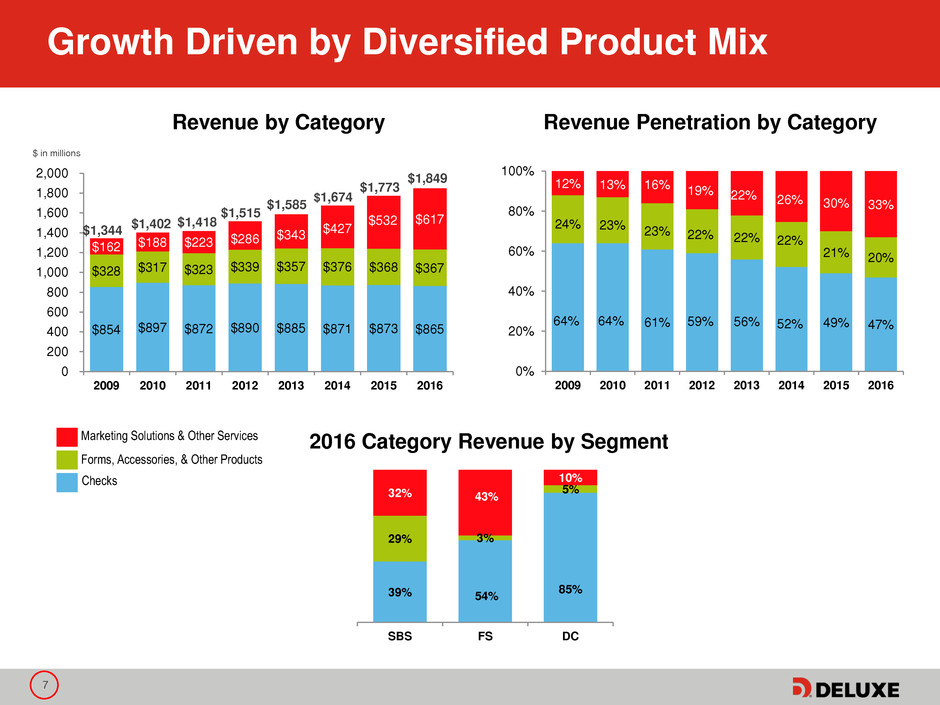
$1,344
$1,402 $1,418
$1,515
$1,585
$1,674
$1,773
$1,849
$1,945 to
$1,975
$2.44
$3.18
$3.11
$3.53
$3.87
$4.20
$4.59
$4.97
$5.15
to
$5.30
$2.00
$2.50
$3.00
$3.50
$4.00
$4.50
$5.00
$5.50
800
1,000
1,200
1,400
1,600
1,800
2,000
2009 2010* 2011 2012 2013 2014 2015 2016 2017
R
e
ve
n
u
e
$
(i
n
m
ill
io
n
s)
18%
40%
8%
15%
14%
6%
10%
7%
9%
7%
9%
-2%
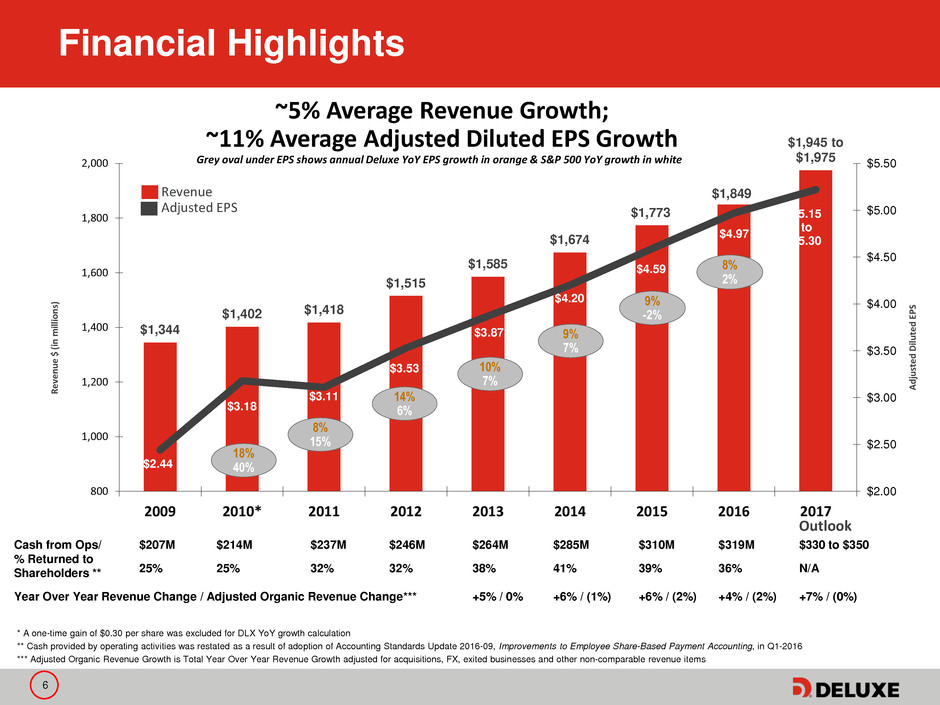
~5% Average Revenue Growth;
~11% Average Adjusted Diluted EPS Growth
Grey oval under EPS shows annual Deluxe YoY EPS growth in orange & S&P 500 YoY growth in white
Adjust
e
d
D
ilu
te
d
E
P
S
Financial Highlights
* A one-time gain of $0.30 per share was excluded for DLX YoY growth calculation
** Cash provided by operating activities was restated as a result of adoption of Accounting Standards Update 2016-09, Improvements to Employee Share-Based Payment Accounting, in Q1-2016
*** Adjusted Organic Revenue Growth is Total Year Over Year Revenue Growth adjusted for acquisitions, FX, exited businesses and other non-comparable revenue items
8%
2%
Cash from Ops/
% Returned to
Shareholders **
$207M $214M $237M $246M $264M $285M $310M $319M $330 to $350
25% 25% 32% 32% 38% 41% 39% 36% N/A
Year Over Year Revenue Change / Adjusted Organic Revenue Change*** +5% / 0% +6% / (1%) +6% / (2%) +4% / (2%) +7% / (0%)
Revenue
Adjusted EPS
Outlook
7
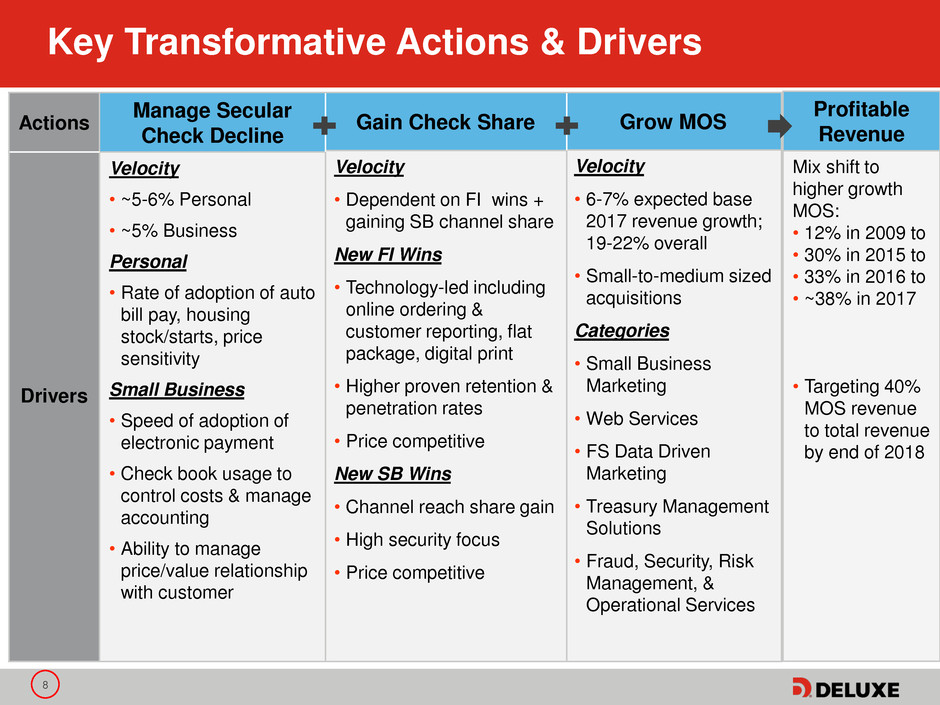
Growth Driven by Diversified Product Mix
Revenue by Category Revenue Penetration by Category
$ in millions
$854 $897 $872 $890 $885 $871 $873 $865
$328 $317 $323 $339 $357 $376 $368 $367
$162 $188 $223
$286 $343
$427
$532 $617
0
200
400
600
800
1,000
1,200
1,400
1,600
1,800
2,000
2009 2010 2011 2012 2013 2014 2015 2016
$1,674
64% 64% 61% 59% 56% 52% 49% 47%
24% 23% 23% 22% 22% 22%
21% 20%
12% 13% 16% 19% 22% 26% 30% 33%
0%
20%
40%
60%
80%
100%
2009 2010 2011 2012 2013 2014 2015 2016
$1,344 $1,402
$1,418
$1,515
$1,585
39% 54%
85%
29% 3%
5% 32% 43%
10%
SBS FS DC
2016 Category Revenue by Segment
$1,773
Marketing Solutions & Other Services
Forms, Accessories, & Other Products
Checks
$1,849
8
Grow MOS
Velocity
• 6-7% expected base
2017 revenue growth;
19-22% overall
• Small-to-medium sized
acquisitions
Categories
• Small Business
Marketing
• Web Services
• FS Data Driven
Marketing
• Treasury Management
Solutions
• Fraud, Security, Risk
Management, &
Operational Services
Gain Check Share
Velocity
• Dependent on FI wins +
gaining SB channel share
New FI Wins
• Technology-led including
online ordering &
customer reporting, flat
package, digital print
• Higher proven retention &
penetration rates
• Price competitive
New SB Wins
• Channel reach share gain
• High security focus
• Price competitive
Key Transformative Actions & Drivers
Actions
Manage Secular
Check Decline
Drivers
Velocity
• ~5-6% Personal
• ~5% Business
Personal
• Rate of adoption of auto
bill pay, housing
stock/starts, price
sensitivity
Small Business
• Speed of adoption of
electronic payment
• Check book usage to
control costs & manage
accounting
• Ability to manage
price/value relationship
with customer
Profitable
Revenue
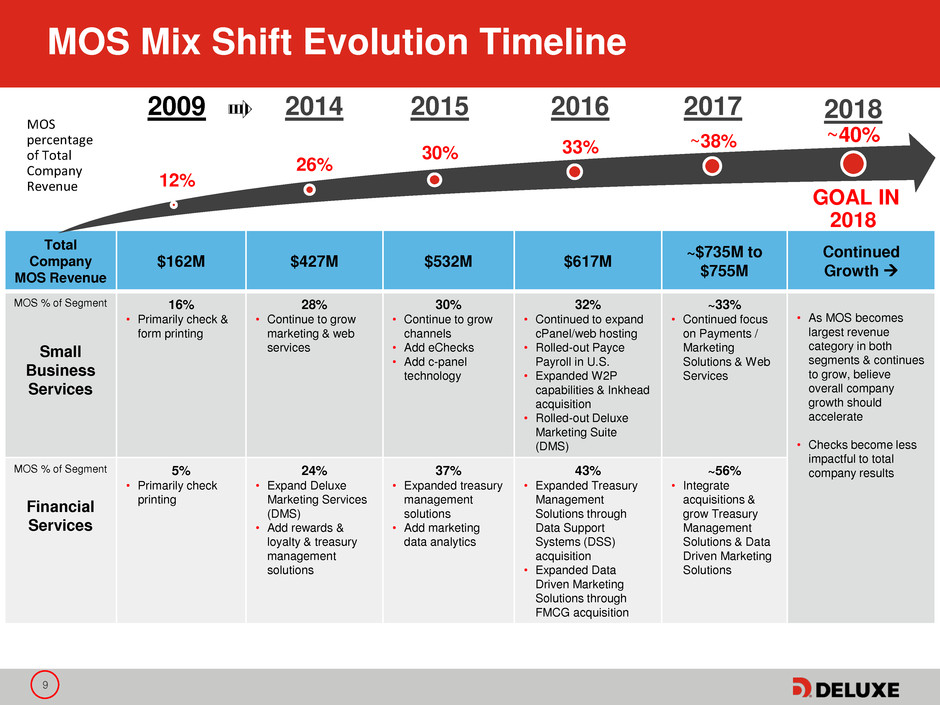
Mix shift to
higher growth
MOS:
• 12% in 2009 to
• 30% in 2015 to
• 33% in 2016 to
• ~38% in 2017
• Targeting 40%
MOS revenue
to total revenue
by end of 2018
9
MOS Mix Shift Evolution Timeline
Total
Company
MOS Revenue
$162M $427M $532M $617M
~$735M to
$755M
Continued
Growth
MOS % of Segment
Small
Business
Services
16%
• Primarily check &
form printing
28%
• Continue to grow
marketing & web
services
30%
• Continue to grow
channels
• Add eChecks
• Add c-panel
technology
32%
• Continued to expand
cPanel/web hosting
• Rolled-out Payce
Payroll in U.S.
• Expanded W2P
capabilities & Inkhead
acquisition
• Rolled-out Deluxe
Marketing Suite
(DMS)
~33%
• Continued focus
on Payments /
Marketing
Solutions & Web
Services
• As MOS becomes
largest revenue
category in both
segments & continues
to grow, believe
overall company
growth should
accelerate
• Checks become less
impactful to total
company results
MOS % of Segment
Financial
Services
5%
• Primarily check
printing
24%
• Expand Deluxe
Marketing Services
(DMS)
• Add rewards &
loyalty & treasury
management
solutions
37%
• Expanded treasury
management
solutions
• Add marketing
data analytics
43%
• Expanded Treasury
Management
Solutions through
Data Support
Systems (DSS)
acquisition
• Expanded Data
Driven Marketing
Solutions through
FMCG acquisition
~56%
• Integrate
acquisitions &
grow Treasury
Management
Solutions & Data
Driven Marketing
Solutions
2009
12%
2014
26%
2015
30%
2016
33%
2018
~40%
GOAL IN
2018
MOS
percentage
of Total
Company
Revenue
2017
~38%
10
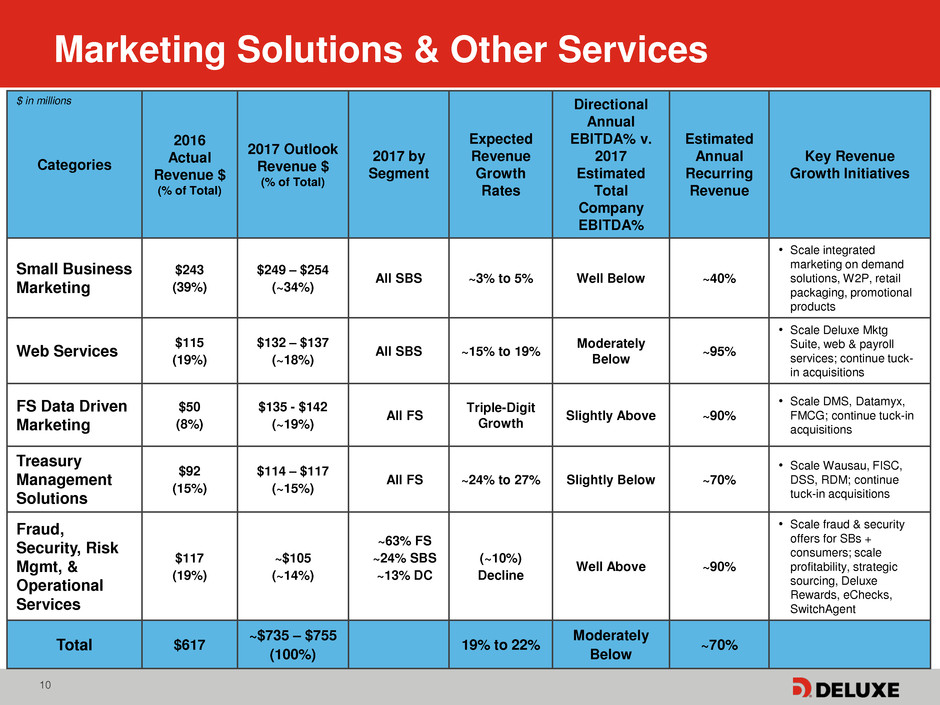
Marketing Solutions & Other Services
Categories
2016
Actual
Revenue $
(% of Total)
2017 Outlook
Revenue $
(% of Total)
2017 by
Segment
Expected
Revenue
Growth
Rates
Directional
Annual
EBITDA% v.
2017
Estimated
Total
Company
EBITDA%
Estimated
Annual
Recurring
Revenue
Key Revenue
Growth Initiatives
Small Business
Marketing
$243
(39%)
$249 – $254
(~34%)
All SBS ~3% to 5% Well Below ~40%
• Scale integrated
marketing on demand
solutions, W2P, retail
packaging, promotional
products
Web Services
$115
(19%)
$132 – $137
(~18%)
All SBS ~15% to 19%
Moderately
Below
~95%
• Scale Deluxe Mktg
Suite, web & payroll
services; continue tuck-
in acquisitions
FS Data Driven
Marketing
$50
(8%)
$135 - $142
(~19%)
All FS
Triple-Digit
Growth
Slightly Above ~90%
• Scale DMS, Datamyx,
FMCG; continue tuck-in
acquisitions
Treasury
Management
Solutions
$92
(15%)
$114 – $117
(~15%)
All FS ~24% to 27% Slightly Below ~70%
• Scale Wausau, FISC,
DSS, RDM; continue
tuck-in acquisitions
Fraud,
Security, Risk
Mgmt, &
Operational
Services
$117
(19%)
~$105
(~14%)
~63% FS
~24% SBS
~13% DC
(~10%)
Decline
Well Above ~90%
• Scale fraud & security
offers for SBs +
consumers; scale
profitability, strategic
sourcing, Deluxe
Rewards, eChecks,
SwitchAgent
Total $617
~$735 – $755
(100%)
19% to 22%
Moderately
Below
~70%
$ in millions
11
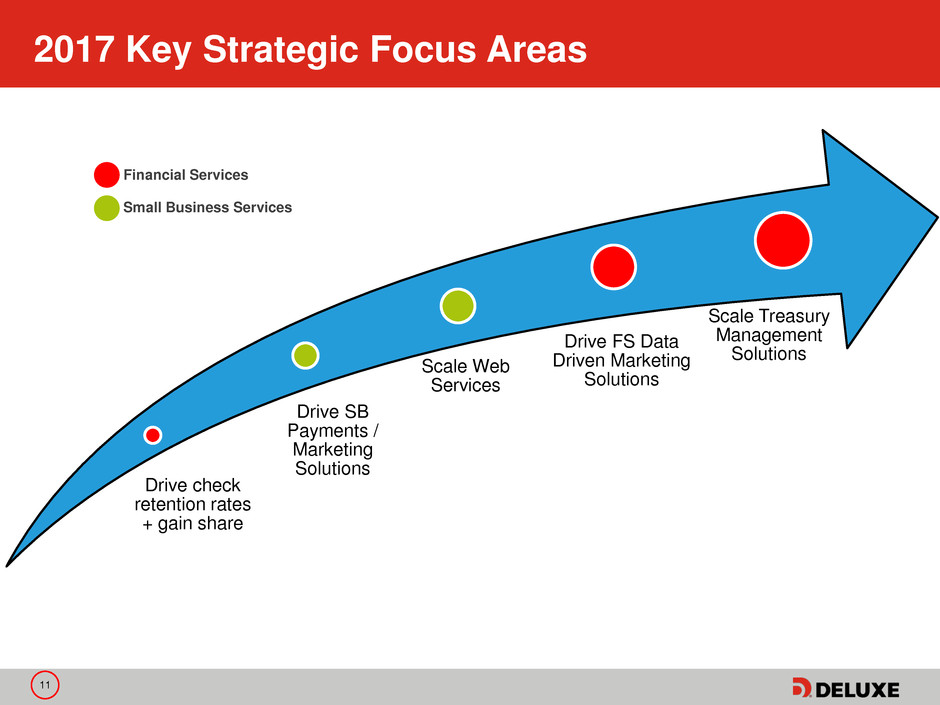
Drive check
retention rates
+ gain share
Drive SB
Payments /
Marketing
Solutions
Scale Web
Services
Drive FS Data
Driven Marketing
Solutions
Scale Treasury
Management
Solutions
2017 Key Strategic Focus Areas
Financial Services
Small Business Services
12
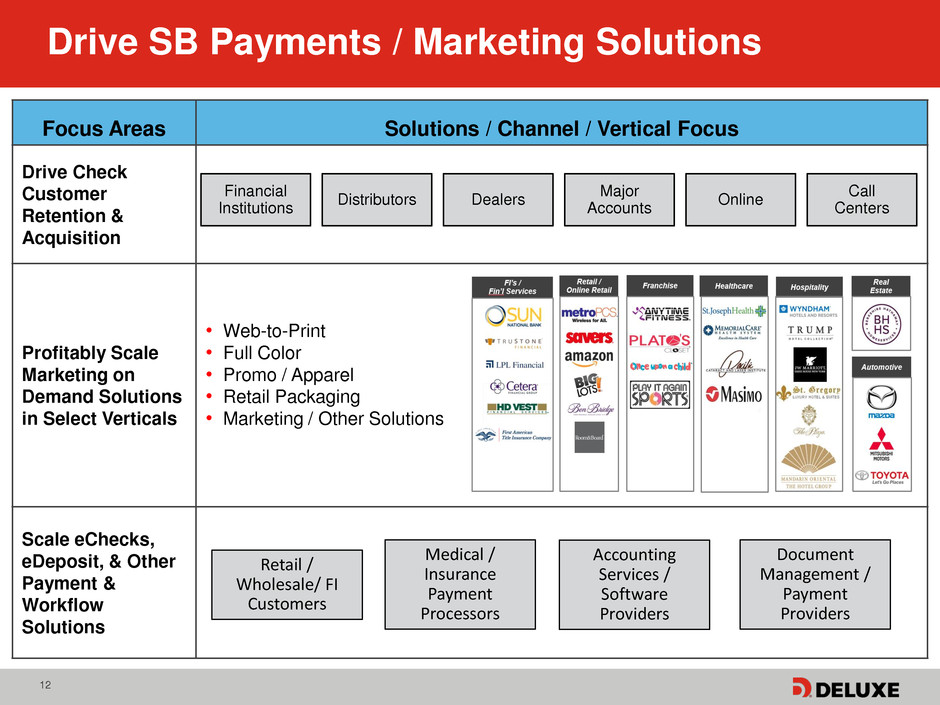
Focus Areas Solutions / Channel / Vertical Focus
Drive Check
Customer
Retention &
Acquisition
Profitably Scale
Marketing on
Demand Solutions
in Select Verticals
• Web-to-Print
• Full Color
• Promo / Apparel
• Retail Packaging
• Marketing / Other Solutions
Scale eChecks,
eDeposit, & Other
Payment &
Workflow
Solutions
Drive SB Payments / Marketing Solutions
Medical /
Insurance
Payment
Processors
Accounting
Services /
Software
Providers
Document
Management /
Payment
Providers
Retail /
Wholesale/ FI
Customers
Financial
Institutions
Distributors Dealers
Major
Accounts
Online
Call
Centers
13
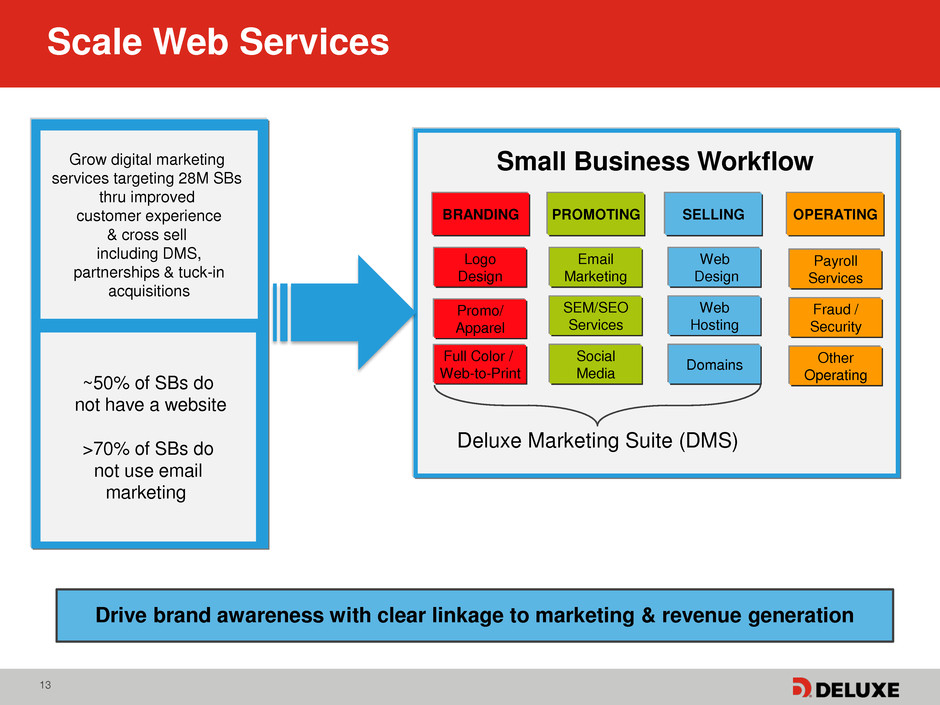
Scale Web Services
Domains
PROMOTING OPERATING
Social
Media
SEM/SEO
Services
Email
Marketing
Other
Operating
Fraud /
Security
Payroll
Services
Web
Hosting
Web
Design
SELLING
Small Business Workflow Grow digital marketing
services targeting 28M SBs
thru improved
customer experience
& cross sell
including DMS,
partnerships & tuck-in
acquisitions
~50% of SBs do
not have a website
>70% of SBs do
not use email
marketing
BRANDING
Full Color /
Web-to-Print
Promo/
Apparel
Logo
Design
Deluxe Marketing Suite (DMS)
Drive brand awareness with clear linkage to marketing & revenue generation
14
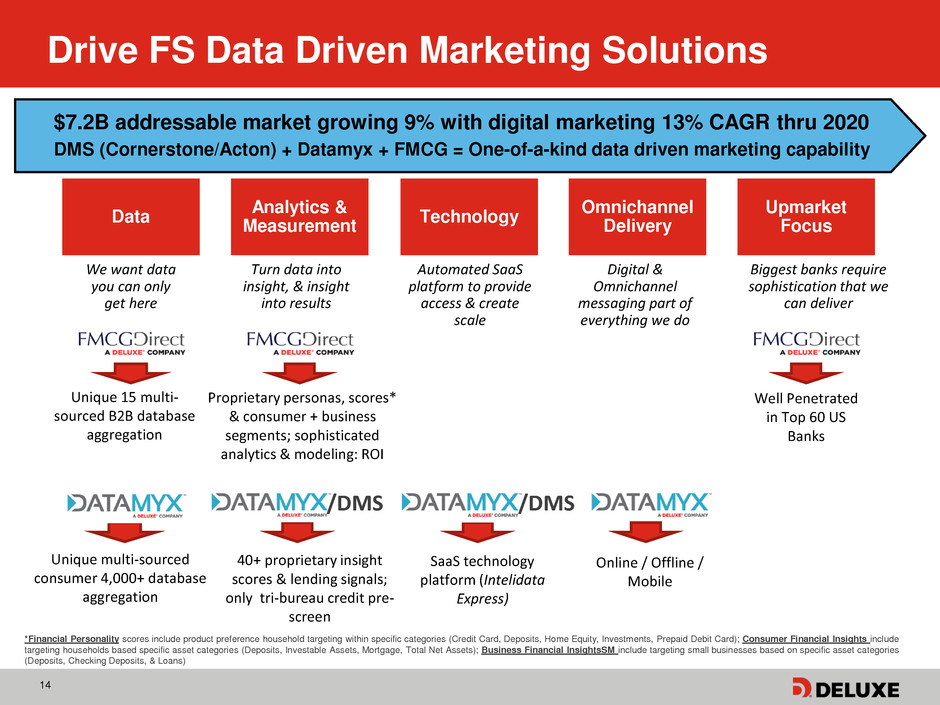
Drive FS Data Driven Marketing Solutions
Data
Upmarket
Focus
Omnichannel
Delivery
Analytics &
Measurement
We want data
you can only
get here
Biggest banks require
sophistication that we
can deliver
Digital &
Omnichannel
messaging part of
everything we do
Turn data into
insight, & insight
into results
Technology
Automated SaaS
platform to provide
access & create
scale
Unique 15 multi-
sourced B2B database
aggregation
Proprietary personas, scores*
& consumer + business
segments; sophisticated
analytics & modeling: ROI
Well Penetrated
in Top 60 US
Banks
$7.2B addressable market growing 9% with digital marketing 13% CAGR thru 2020
DMS (Cornerstone/Acton) + Datamyx + FMCG = One-of-a-kind data driven marketing capability
*Financial Personality scores include product preference household targeting within specific categories (Credit Card, Deposits, Home Equity, Investments, Prepaid Debit Card); Consumer Financial Insights include
targeting households based specific asset categories (Deposits, Investable Assets, Mortgage, Total Net Assets); Business Financial InsightsSM include targeting small businesses based on specific asset categories
(Deposits, Checking Deposits, & Loans)
Unique multi-sourced
consumer 4,000+ database
aggregation
40+ proprietary insight
scores & lending signals;
only tri-bureau credit pre-
screen
SaaS technology
platform (Intelidata
Express)
Online / Offline /
Mobile
/DMS /DMS
15
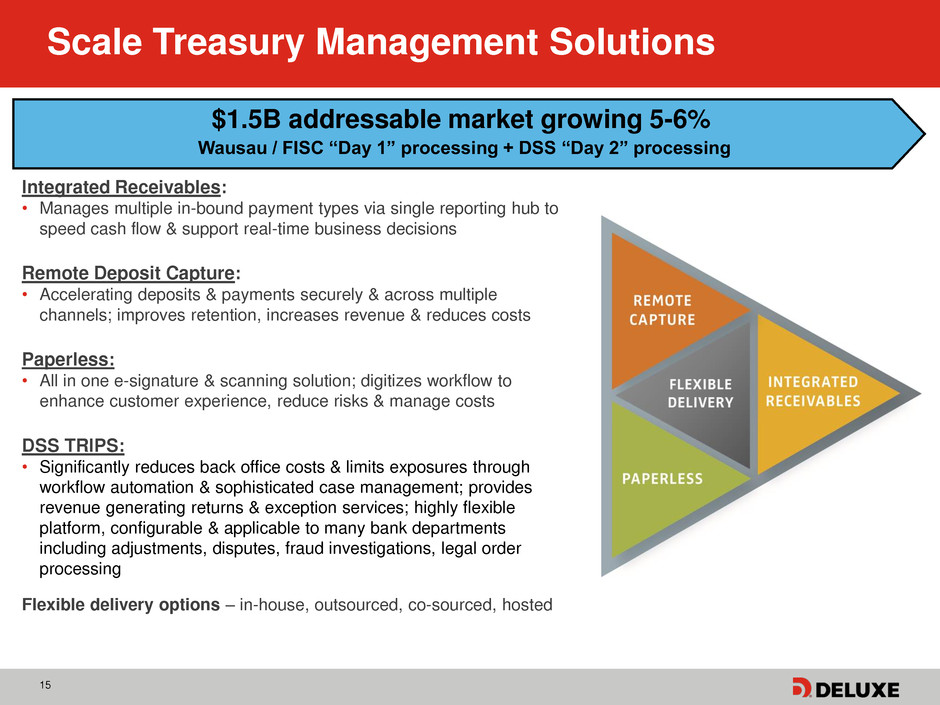
Scale Treasury Management Solutions
Integrated Receivables:
• Manages multiple in-bound payment types via single reporting hub to
speed cash flow & support real-time business decisions
Remote Deposit Capture:
• Accelerating deposits & payments securely & across multiple
channels; improves retention, increases revenue & reduces costs
Paperless:
• All in one e-signature & scanning solution; digitizes workflow to
enhance customer experience, reduce risks & manage costs
DSS TRIPS:
• Significantly reduces back office costs & limits exposures through
workflow automation & sophisticated case management; provides
revenue generating returns & exception services; highly flexible
platform, configurable & applicable to many bank departments
including adjustments, disputes, fraud investigations, legal order
processing
Flexible delivery options – in-house, outsourced, co-sourced, hosted
$1.5B addressable market growing 5-6%
Wausau / FISC “Day 1” processing + DSS “Day 2” processing
16
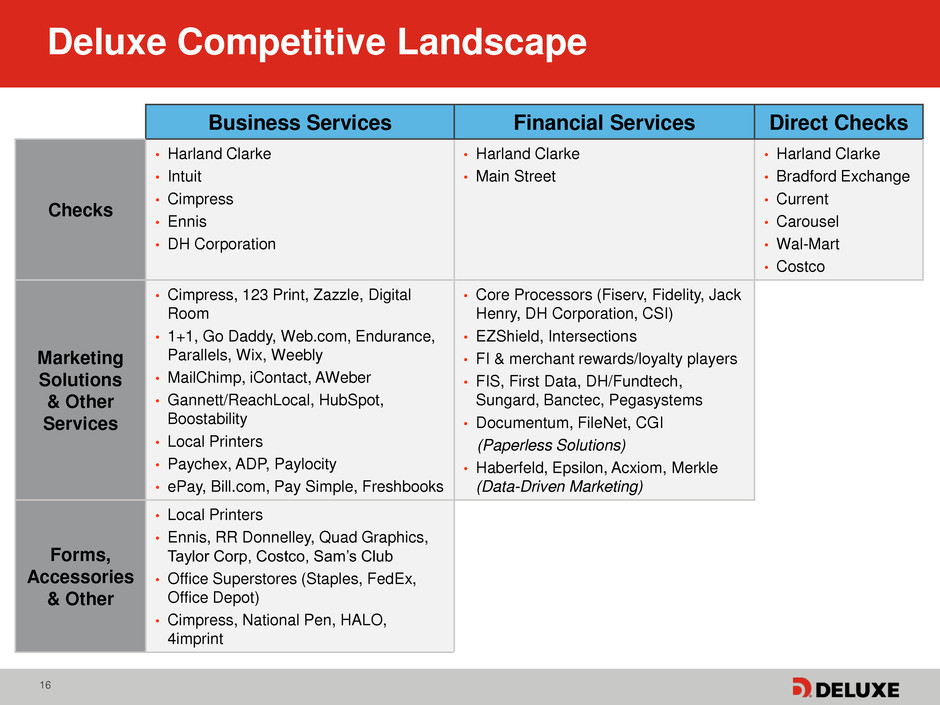
Business Services Financial Services Direct Checks
Checks
• Harland Clarke
• Intuit
• Cimpress
• Ennis
• DH Corporation
• Harland Clarke
• Main Street
• Harland Clarke
• Bradford Exchange
• Current
• Carousel
• Wal-Mart
• Costco
Marketing
Solutions
& Other
Services
• Cimpress, 123 Print, Zazzle, Digital
Room
• 1+1, Go Daddy, Web.com, Endurance,
Parallels, Wix, Weebly
• MailChimp, iContact, AWeber
• Gannett/ReachLocal, HubSpot,
Boostability
• Local Printers
• Paychex, ADP, Paylocity
• ePay, Bill.com, Pay Simple, Freshbooks
• Core Processors (Fiserv, Fidelity, Jack
Henry, DH Corporation, CSI)
• EZShield, Intersections
• FI & merchant rewards/loyalty players
• FIS, First Data, DH/Fundtech,
Sungard, Banctec, Pegasystems
• Documentum, FileNet, CGI
(Paperless Solutions)
• Haberfeld, Epsilon, Acxiom, Merkle
(Data-Driven Marketing)
Forms,
Accessories
& Other
• Local Printers
• Ennis, RR Donnelley, Quad Graphics,
Taylor Corp, Costco, Sam’s Club
• Office Superstores (Staples, FedEx,
Office Depot)
• Cimpress, National Pen, HALO,
4imprint
Deluxe Competitive Landscape
17
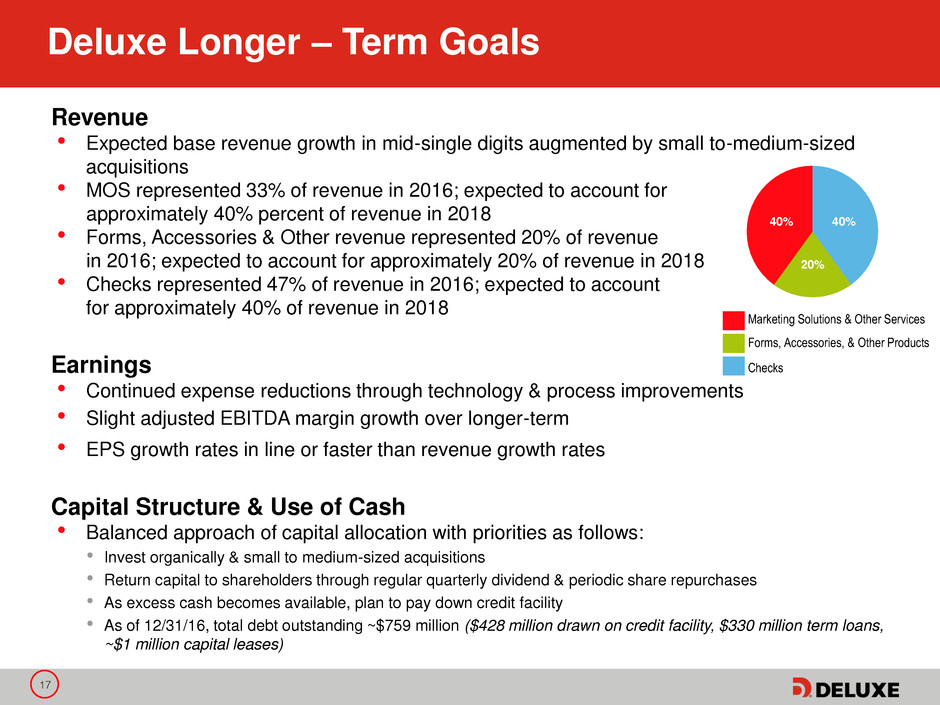
Deluxe Longer – Term Goals
Revenue
• Expected base revenue growth in mid-single digits augmented by small to-medium-sized
acquisitions
• MOS represented 33% of revenue in 2016; expected to account for
approximately 40% percent of revenue in 2018
• Forms, Accessories & Other revenue represented 20% of revenue
in 2016; expected to account for approximately 20% of revenue in 2018
• Checks represented 47% of revenue in 2016; expected to account
for approximately 40% of revenue in 2018
Earnings
• Continued expense reductions through technology & process improvements
• Slight adjusted EBITDA margin growth over longer-term
• EPS growth rates in line or faster than revenue growth rates
Capital Structure & Use of Cash
• Balanced approach of capital allocation with priorities as follows:
• Invest organically & small to medium-sized acquisitions
• Return capital to shareholders through regular quarterly dividend & periodic share repurchases
• As excess cash becomes available, plan to pay down credit facility
• As of 12/31/16, total debt outstanding ~$759 million ($428 million drawn on credit facility, $330 million term loans,
~$1 million capital leases)
Marketing Solutions & Other Services
Forms, Accessories, & Other Products
Checks
40%
20%
40%
18
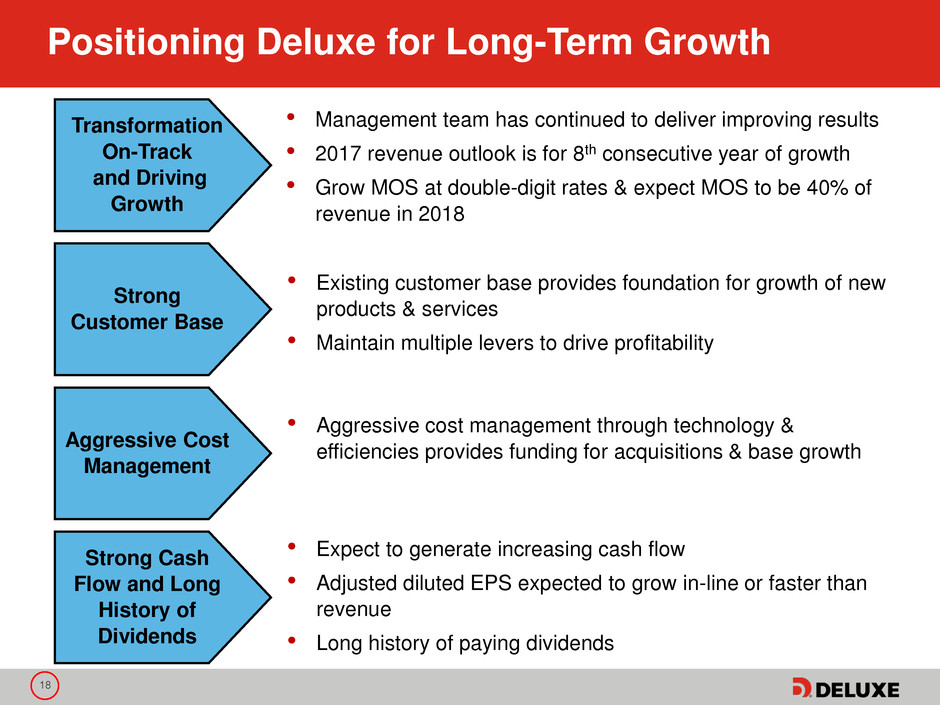
Positioning Deluxe for Long-Term Growth
• Management team has continued to deliver improving results
• 2017 revenue outlook is for 8th consecutive year of growth
• Grow MOS at double-digit rates & expect MOS to be 40% of
revenue in 2018
• Existing customer base provides foundation for growth of new
products & services
• Maintain multiple levers to drive profitability
• Aggressive cost management through technology &
efficiencies provides funding for acquisitions & base growth
• Expect to generate increasing cash flow
• Adjusted diluted EPS expected to grow in-line or faster than
revenue
• Long history of paying dividends
Strong Cash
Flow and Long
History of
Dividends
Transformation
On-Track
and Driving
Growth
Strong
Customer Base
Aggressive Cost
Management
19
Appendix
Reconciliations
20
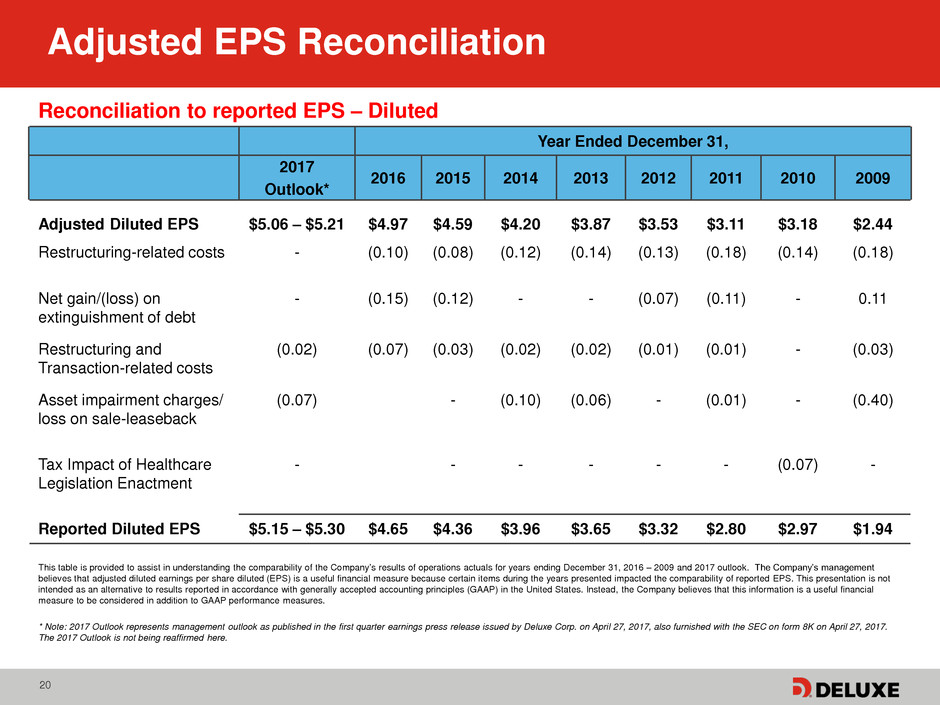
Adjusted EPS Reconciliation
Reconciliation to reported EPS – Diluted
Year Ended December 31,
2017
Outlook*
2016 2015 2014 2013 2012 2011 2010 2009
Adjusted Diluted EPS $5.06 – $5.21 $4.97 $4.59 $4.20 $3.87 $3.53 $3.11 $3.18 $2.44
Restructuring-related costs - (0.10) (0.08) (0.12) (0.14) (0.13) (0.18) (0.14) (0.18)
Net gain/(loss) on
extinguishment of debt
- (0.15) (0.12) - - (0.07) (0.11) -
0.11
Restructuring and
Transaction-related costs
(0.02) (0.07) (0.03) (0.02) (0.02) (0.01) (0.01) -
(0.03)
Asset impairment charges/
loss on sale-leaseback
(0.07) - (0.10) (0.06) - (0.01) -
(0.40)
Tax Impact of Healthcare
Legislation Enactment
- - - - - - (0.07) -
Reported Diluted EPS $5.15 – $5.30 $4.65 $4.36 $3.96 $3.65 $3.32 $2.80 $2.97 $1.94
This table is provided to assist in understanding the comparability of the Company’s results of operations actuals for years ending December 31, 2016 – 2009 and 2017 outlook. The Company’s management
believes that adjusted diluted earnings per share diluted (EPS) is a useful financial measure because certain items during the years presented impacted the comparability of reported EPS. This presentation is not
intended as an alternative to results reported in accordance with generally accepted accounting principles (GAAP) in the United States. Instead, the Company believes that this information is a useful financial
measure to be considered in addition to GAAP performance measures.
* Note: 2017 Outlook represents management outlook as published in the first quarter earnings press release issued by Deluxe Corp. on April 27, 2017, also furnished with the SEC on form 8K on April 27, 2017.
The 2017 Outlook is not being reaffirmed here.
21
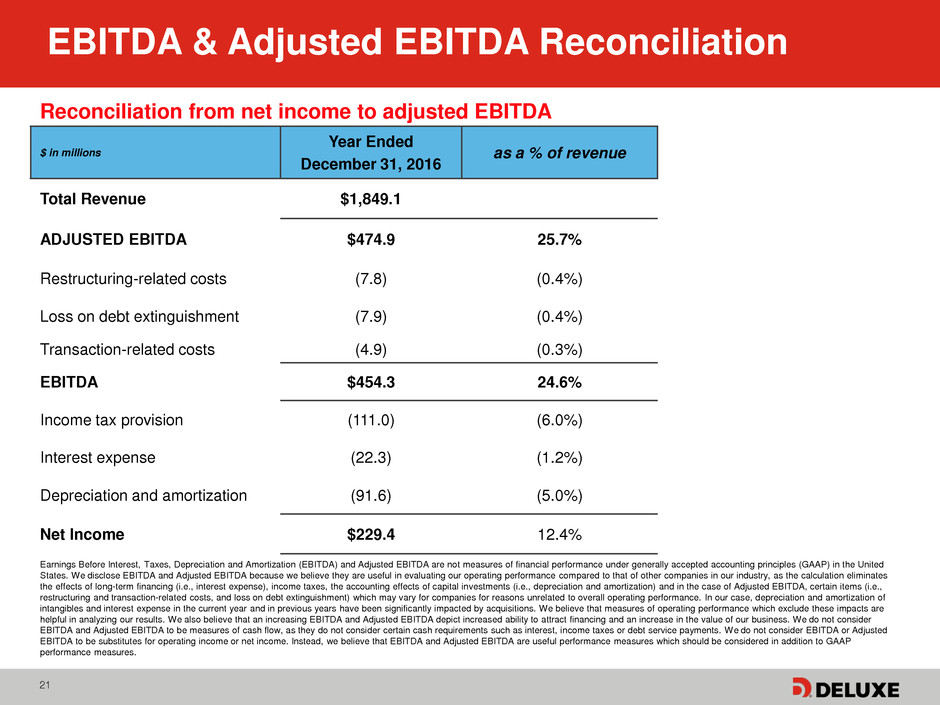
EBITDA & Adjusted EBITDA Reconciliation
Reconciliation from net income to adjusted EBITDA
$ in millions
Year Ended
December 31, 2016
as a % of revenue
Total Revenue $1,849.1
ADJUSTED EBITDA $474.9 25.7%
Restructuring-related costs (7.8) (0.4%)
Loss on debt extinguishment (7.9) (0.4%)
Transaction-related costs (4.9) (0.3%)
EBITDA $454.3 24.6%
Income tax provision (111.0) (6.0%)
Interest expense (22.3) (1.2%)
Depreciation and amortization (91.6) (5.0%)
Net Income $229.4 12.4%
Earnings Before Interest, Taxes, Depreciation and Amortization (EBITDA) and Adjusted EBITDA are not measures of financial performance under generally accepted accounting principles (GAAP) in the United
States. We disclose EBITDA and Adjusted EBITDA because we believe they are useful in evaluating our operating performance compared to that of other companies in our industry, as the calculation eliminates
the effects of long-term financing (i.e., interest expense), income taxes, the accounting effects of capital investments (i.e., depreciation and amortization) and in the case of Adjusted EBITDA, certain items (i.e.,
restructuring and transaction-related costs, and loss on debt extinguishment) which may vary for companies for reasons unrelated to overall operating performance. In our case, depreciation and amortization of
intangibles and interest expense in the current year and in previous years have been significantly impacted by acquisitions. We believe that measures of operating performance which exclude these impacts are
helpful in analyzing our results. We also believe that an increasing EBITDA and Adjusted EBITDA depict increased ability to attract financing and an increase in the value of our business. We do not consider
EBITDA and Adjusted EBITDA to be measures of cash flow, as they do not consider certain cash requirements such as interest, income taxes or debt service payments. We do not consider EBITDA or Adjusted
EBITDA to be substitutes for operating income or net income. Instead, we believe that EBITDA and Adjusted EBITDA are useful performance measures which should be considered in addition to GAAP
performance measures.
22
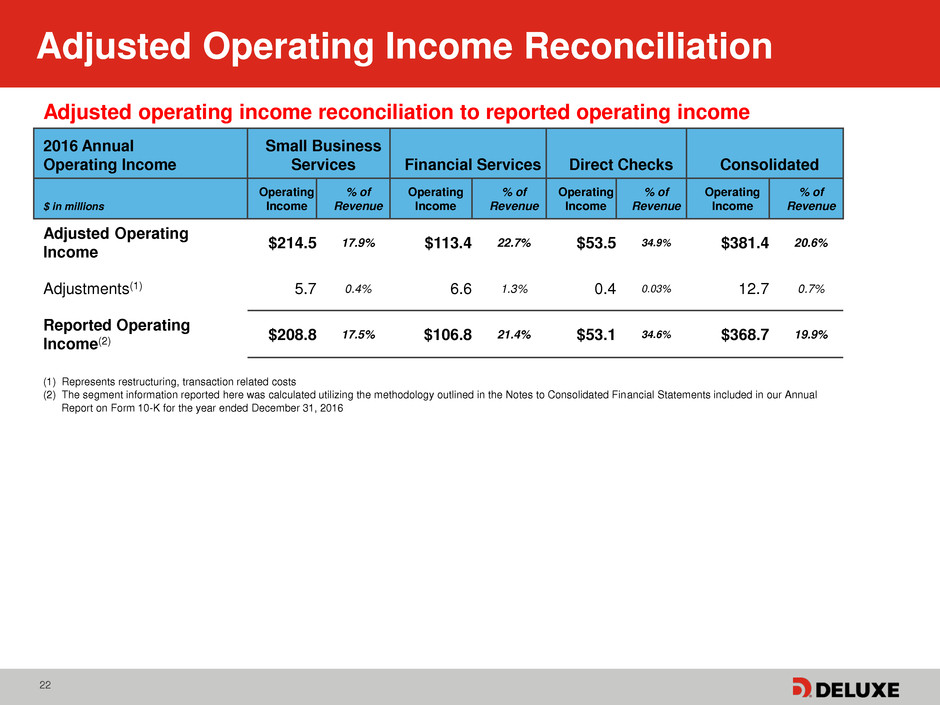
Adjusted Operating Income Reconciliation
Adjusted operating income reconciliation to reported operating income
2016 Annual
Operating Income
Small Business
Services Financial Services Direct Checks Consolidated
$ in millions
Operating
Income
% of
Revenue
Operating
Income
% of
Revenue
Operating
Income
% of
Revenue
Operating
Income
% of
Revenue
Adjusted Operating
Income
$214.5 17.9% $113.4 22.7% $53.5 34.9% $381.4 20.6%
Adjustments(1) 5.7 0.4% 6.6 1.3% 0.4 0.03% 12.7 0.7%
Reported Operating
Income(2)
$208.8 17.5% $106.8 21.4% $53.1 34.6% $368.7 19.9%
(1) Represents restructuring, transaction related costs
(2) The segment information reported here was calculated utilizing the methodology outlined in the Notes to Consolidated Financial Statements included in our Annual
Report on Form 10-K for the year ended December 31, 2016
23
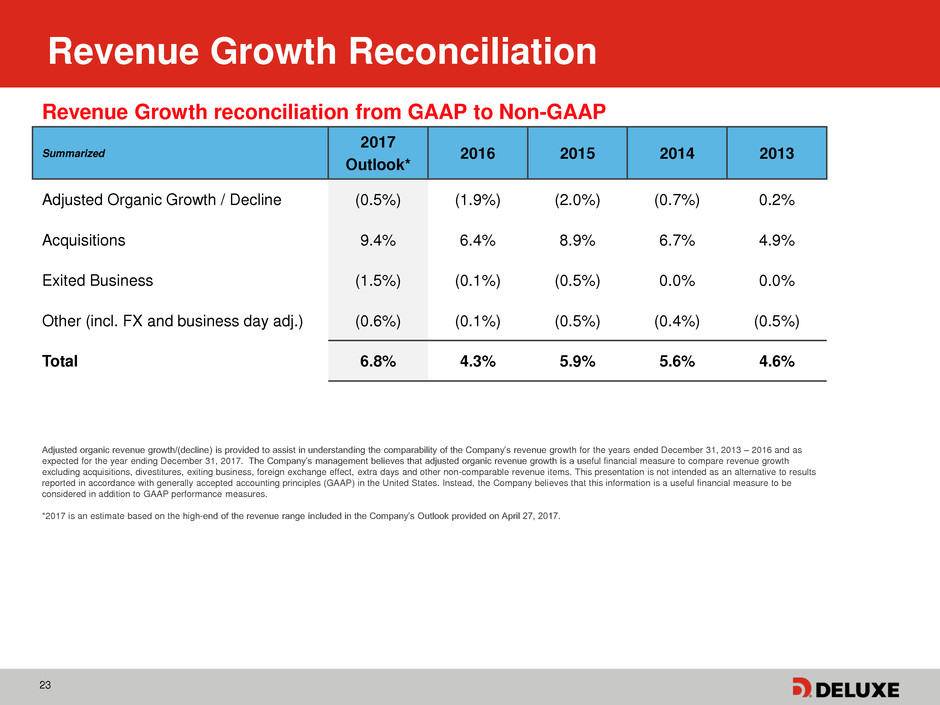
Revenue Growth Reconciliation
Revenue Growth reconciliation from GAAP to Non-GAAP
Summarized
2017
Outlook*
2016 2015 2014 2013
Adjusted Organic Growth / Decline (0.5%) (1.9%) (2.0%) (0.7%) 0.2%
Acquisitions 9.4% 6.4% 8.9% 6.7% 4.9%
Exited Business (1.5%) (0.1%) (0.5%) 0.0% 0.0%
Other (incl. FX and business day adj.) (0.6%) (0.1%) (0.5%) (0.4%) (0.5%)
Total 6.8% 4.3% 5.9% 5.6% 4.6%
Adjusted organic revenue growth/(decline) is provided to assist in understanding the comparability of the Company’s revenue growth for the years ended December 31, 2013 – 2016 and as
expected for the year ending December 31, 2017. The Company’s management believes that adjusted organic revenue growth is a useful financial measure to compare revenue growth
excluding acquisitions, divestitures, exiting business, foreign exchange effect, extra days and other non-comparable revenue items. This presentation is not intended as an alternative to results
reported in accordance with generally accepted accounting principles (GAAP) in the United States. Instead, the Company believes that this information is a useful financial measure to be
considered in addition to GAAP performance measures.
*2017 is an estimate based on the high-end of the revenue range included in the Company’s Outlook provided on April 27, 2017.
24
Investor Contact
Ed Merritt
Treasurer and Vice President
of Investor Relations
ed.merritt@deluxe.com
Tel: 651-787-1370