10-K: Annual report pursuant to Section 13 and 15(d)
Published on February 23, 2018
UNITED STATES
SECURITIES AND EXCHANGE COMMISSION
Washington, D.C. 20549
FORM 10-K
[X] |
Annual Report Pursuant to Section 13 or 15(d) of the Securities Exchange Act of 1934 for the fiscal year ended |
Commission file number: 1-7945

DELUXE CORPORATION
(Exact name of registrant as specified in its charter)
|
Minnesota
(State or other jurisdiction of incorporation or organization)
|
41-0216800
(I.R.S. Employer Identification No.)
|
|
3680 Victoria St. N., Shoreview, Minnesota
(Address of principal executive offices)
|
55126-2966
(Zip Code)
|
Registrant’s telephone number, including area code: (651) 483-7111
Securities registered pursuant to Section 12(b) of the Act:
|
Common Stock, par value $1.00 per share
(Title of each class)
|
New York Stock Exchange
(Name of each exchange on which registered)
|
Securities registered pursuant to Section 12(g) of the Act: None
Indicate by check mark if the registrant is a well-known seasoned issuer, as defined in Rule 405 of the Securities Act. [X] Yes [ ] No
Indicate by check mark if the registrant is not required to file reports pursuant to Section 13 or Section 15(d) of the Act. [ ] Yes [X] No
Indicate by check mark whether the registrant (1) has filed all reports required to be filed by Section 13 or 15(d) of the Securities Exchange Act of 1934 during the preceding 12 months (or for such shorter period that the registrant was required to file such reports), and (2) has been subject to such filing requirements for the past 90 days. [X] Yes [ ] No
Indicate by check mark whether the registrant has submitted electronically and posted on its corporate Web site, if any, every Interactive Data File required to be submitted and posted pursuant to Rule 405 of Regulation S-T (§232.405 of this chapter) during the preceding 12 months (or for such shorter period that the registrant was required to submit and post such files). [X] Yes [ ] No
Indicate by check mark if disclosure of delinquent filers pursuant to Item 405 of Regulation S-K (§229.405 of this chapter) is not contained herein, and will not be contained, to the best of registrant's knowledge, in definitive proxy or information statements incorporated by reference in Part III of this Form 10-K or any amendment to this Form 10-K. [X]
Indicate by check mark whether the registrant is a large accelerated filer, an accelerated filer, a non-accelerated filer, a smaller reporting company, or an emerging growth company . See the definitions of “large accelerated filer,” “accelerated filer,” “smaller reporting company,” and "emerging growth company" in Rule 12b-2 of the Exchange Act.
Large accelerated filer [X] |
Accelerated filer [ ] |
Non-accelerated filer [ ] (Do not check if a smaller reporting company) |
Smaller reporting company [ ] |
Emerging growth company [ ] |
|
If an emerging growth company, indicate by check mark if the registrant has elected not to use the extended transition period for complying with any new or revised financial accounting standards provided pursuant to Section 13(a) of the Exchange Act. [ ]
Indicate by check mark whether the registrant is a shell company (as defined in Rule 12b-2 of the Exchange Act). [ ] Yes [X] No
The aggregate market value of the voting stock held by non-affiliates of the registrant is $3,311,141,538 based on the last sales price of the registrant's common stock on the New York Stock Exchange on June 30, 2017. The number of outstanding shares of the registrant's common stock as of February 13, 2018 was 47,923,566 .
Documents Incorporated by Reference: Portions of our definitive proxy statement to be filed within 120 days after our fiscal year-end are incorporated by reference in Part III.
DELUXE CORPORATION
FORM 10-K
FOR THE YEAR ENDED DECEMBER 31, 2017
TABLE OF CONTENTS
Item |
Page |
|||
PART I
Item 1. Business.
Deluxe Corporation was founded in 1915 and was incorporated under the laws of the State of Minnesota in 1920. Our principal corporate offices are located at 3680 Victoria Street North, Shoreview, Minnesota 55126-2966. Our main telephone number is (651) 483-7111 and our web address is www.deluxe.com.
COMPANY OVERVIEW
Over 100 years ago, Deluxe Corporation began providing payment solutions. Our longevity is a testament to our innovation and our ability to evolve with our customers. Over the past several years, we have transformed from being primarily a check printing company to providing a diverse selection of products and services. Our vision is to be the best at helping small businesses and financial institutions grow and we have become a trusted partner to small businesses and an integral part of the financial services industry. We provide a selection of customer life cycle management solutions that help our customers acquire and engage their customers across multiple channels. To promote and sell a wide range of products and services, we use printed and electronic marketing; a direct sales force; referrals from financial institutions, telecommunication clients and other partners; networks of distributors and independent dealers; and an outbound telemarketing group. Over the past 24 months, our Small Business Services segment has provided products and services to approximately 4.4 million small business customers and our Direct Checks segment has provided products and services to more than 5.1 million consumers. Through our Financial Services segment, we provide products and services to approximately 4,900 financial institution clients.
Our product and service offerings are comprised of the following:
Checks – We remain one of the largest providers of checks in the United States. During 2017, checks represented 39% of our Small Business Services segment's revenue, 43% of our Financial Services segment's revenue and 84% of our Direct Checks segment's revenue.
Marketing solutions and other services (MOS) – We offer products and services designed to meet our customers’ sales and marketing needs, as well as various other service offerings. Our marketing products include digital printing and web-to-print solutions such as business cards, print marketing, promotional goods and apparel. Our web services offerings include logo design; hosting, domain name and web design services; search engine optimization; and marketing programs, including email, mobile and social media. We also offer fraud protection and security services, online and offline payroll services, and electronic checks ("eChecks"). Our Financial Services segment also offers a selection of financial technology ("FinTech") solutions. These solutions include data-driven marketing solutions, including outsourced marketing campaign targeting and execution; treasury management solutions, including accounts receivable processing and remote deposit capture; and digital engagement solutions, including loyalty and rewards programs. During 2017, MOS represented 34% of our Small Business Services segment's revenue, 55% of our Financial Services segment's revenue and 11% of our Direct Checks segment's revenue.
Forms – Our Small Business Services segment is a leading provider of printed forms to small businesses, including deposit tickets, billing forms, work orders, job proposals, purchase orders, invoices and personnel forms. This segment also offers computer forms compatible with accounting software packages commonly used by small businesses. Forms sold by our Financial Services and Direct Checks segments include deposit tickets and check registers.
Accessories and other products – Small Business Services offers products designed to provide small business owners with the customized documents necessary to efficiently manage their business, including envelopes, office supplies, ink stamps and labels. Our Financial Services and Direct Checks segments offer checkbook covers, labels and ink stamps.
Revenue, by product and service category, as a percentage of consolidated revenue for the years ended December 31 was as follows:
2017 |
2016 |
2015 |
2014 |
2013 |
|||||||||||
Checks |
43.3 |
% |
46.8 |
% |
49.3 |
% |
52.0 |
% |
55.8 |
% |
|||||
Marketing solutions and other services |
38.4 |
% |
33.4 |
% |
30.0 |
% |
25.5 |
% |
21.6 |
% |
|||||
Forms |
10.8 |
% |
11.6 |
% |
12.2 |
% |
13.0 |
% |
12.7 |
% |
|||||
Accessories and other products |
7.5 |
% |
8.2 |
% |
8.5 |
% |
9.5 |
% |
9.9 |
% |
|||||
Total revenue |
100.0 |
% |
100.0 |
% |
100.0 |
% |
100.0 |
% |
100.0 |
% |
|||||
3
BUSINESS SEGMENTS
Our business segments are generally organized by the type of customer served and reflect the way we manage the company. Additional information concerning our segments appears under the caption “Note 16: Business segment information” of the Notes to Consolidated Financial Statements appearing in Item 8 of this report.
Small Business Services
Small Business Services operates under various brands, including Deluxe®, Safeguard®, PsPrint®, Hostopia®, Aplus.net®, VerticalResponse®, Digital Pacific®, Inkhead®, PAYweb® and Payce®, among others. This is our largest segment in terms of revenue and operating income and we are concentrating on profitably growing this segment. Small Business Services strives to be a leading supplier to small businesses, as well as partners and channels that support small businesses, by providing personalized products and services that help them operate and market their businesses. This segment sells products and services to small businesses in North America, Australia and portions of South America and Europe.
Small Business Services' products are distributed through multiple channels. Our primary customer acquisition methods are direct response mail and internet advertising; referrals from financial institutions, telecommunications clients and other partners; affiliate relationships; networks of distributors and independent dealers; a direct sales force that focuses on selling to and through major accounts; and an outbound telemarketing group. Customer service for initial order support, product reorders and routine service is provided by a network of call center representatives located in the United States, Canada and Australia.
Our Small Business Services strategies are as follows:
• |
Effectively acquire and retain customers by optimizing each of our sales channels; |
• |
Expand sales of higher growth and recurring MOS offerings; |
• |
Increase our share of the amount small businesses spend on the types of products and services in our portfolio through increased brand awareness, channel coverage, and improved customer acquisition; and |
• |
Continue to optimize our cost and expense structure. |
To support our strategies and to reposition Small Business Services as not just a provider of business checks and printed forms, but also as a provider of higher growth MOS offerings, we have two strategic focus areas:
1. |
Web services: |
* |
Improve the digital marketing customer experience and cross-sell across all customers and channels, including through our integrated Deluxe Marketing Suite, while continuing to build partnerships and explore acquisition opportunities. |
* |
Accelerate our brand awareness transformation, building a clear linkage between marketing and revenue-generating capabilities. |
* |
Focus on scaling payroll services and continue to evaluate early stage businesses and other operational annuity growth solutions. |
2. |
Payments and marketing solutions: |
* |
Focus on core check retention and acquisition and on developing incremental retail customer acquisition channels. |
* |
Profitably scale integrated marketing-on-demand solutions, with the largest opportunity in major accounts. |
* |
Optimize electronic payment solutions with a focus on building opportunities with financial institutions, medical and insurance payment processors, accounting services and software providers, and other document management and payment solution companies. |
In support of our strategies, we expect to continue identifying opportunities to expand sales to our existing customers and to acquire new customers, including the small business customer referrals we receive through our Deluxe Business Advantage® program. This program provides a fast and simple way for financial institutions to offer expanded personalized service to small businesses. Our relationships with financial institutions are important in helping us more deeply serve unique customer segments such as contractors, retailers and professional services firms. In addition, we expect to continue to acquire customers through our affiliate partners, telecommunications clients, media partners and major account clients. We invest in our e-commerce and technology platforms to increase opportunities to market and sell online, and we utilize various marketing channels, including internet, direct mail solicitations and television. Our distributor and dealer networks and our major accounts channel increase our distribution reach through dedicated “feet on the street,” resellers and partner operations, and allow us to increase sales to existing customers and acquire new customers via multiple methods.
We continuously evaluate ways to strengthen our portfolio of products and services through acquisitions, partnerships and internal development. In recent years, we have acquired a number of businesses that have expanded our MOS offerings, including technology-based solutions such as web services, payroll services, web-to-print capabilities, internet marketing services and eChecks. Sales of these higher growth products and services are expected to represent an increasing portion of our revenue. Additional information concerning our acquisitions appears under the caption “Note 5: Acquisitions” of the Notes to
4
Consolidated Financial Statements appearing in Item 8 of this report. In addition, we track innovations within the marketplace coming from competitors, best-of-breed companies and evolving technology products and communities. When making decisions regarding the technologies and methodologies to employ within our product and service areas, we incorporate leading new techniques when they meet our fundamental need for scale, performance, flexibility and security. We also monitor feedback from our customer channels to ensure we are offering the products and features our customers want.
We continue our efforts within Small Business Services to simplify processes, eliminate complexity and lower costs. Small Business Services outsources the production of many of its products, including certain business forms, promotional products and apparel. In conjunction with our cost reduction initiatives, we strive to further enhance our strategic supplier sourcing arrangements. In addition, the expertise we have developed in logistics, productivity and inventory management has allowed us to reduce the number of facilities we operate, while still meeting customer requirements. During 2017, we closed a retail packaging sales location in Dallas, Texas. During 2016, we closed a call center located in Los Angeles, California, a warehouse located in Houston, Texas and a facility housing general office space in Burnsville, Minnesota. During 2015, we closed a facility located in American Fork, Utah that housed a call center and administrative functions, as well as a call center located in Charlotte, North Carolina and a sales facility located in Venice, California. The operations of these facilities were integrated into existing Small Business Services operations.
Financial Services
Financial Services' products and services are sold primarily through a direct sales force, which executes product and service supply contracts with our financial institution clients, including banks, credit unions and financial services companies. Building on our long-standing reputation in the financial services industry as a leading check provider, we have expanded our offerings to include a growing selection of software and cloud-based products and services designed to help financial institutions better address the needs of their customers throughout the customer life cycle. Our sales force is selling these life cycle management solutions through our existing financial institution customer channel to existing clients and to new clients. In addition, certain of our service offerings, such as digital engagement solutions, are sold to clients other than financial institutions.
Our Financial Services strategies are as follows:
• |
Expand sales of higher growth MOS offerings that differentiate us from the competition; |
• |
Optimize core check revenue streams and acquire new clients; and |
• |
Continue to optimize our cost and expense structure. |
We have two focus areas that support our Financial Services strategies:
1. |
Data-driven marketing solutions: |
* |
Leverage data-driven analytics and marketing capabilities to grow financial institution depository and lending products, and assess new acquisitions. |
2. |
Treasury management solutions: |
* |
Profitably scale our treasury management solutions. |
* |
Further integrate previous acquisitions and execute additional acquisitions. |
Despite the decline in check usage, checks continue to be an important source of revenue. Our check supply contracts usually range in duration from 3 to 6 years. As part of our check programs, we provide enhanced services such as customized reporting, file management, expedited account conversion support, fraud protection services, new account support, trackable delivery and billing services. Consumers typically submit their check order to their financial institution, which then forwards the order to us. However, consumers may also submit their check orders over the phone or internet. We process the order and ship it directly to the consumer. We also continue to leverage our Deluxe Business Advantage program, which is designed to maximize financial institution business check programs. It offers many of the products and services of our Small Business Services segment to the small business customers of financial institutions through a number of service level options. The revenue from the products and services sold through this program is reflected in our Small Business Services segment.
In our ongoing efforts to expand our client relationships with relevant growth services, we offer several solutions designed to help financial institutions operate more effectively and better address the needs of their customers throughout the customer life cycle. All of these offerings build on our reputation as a longstanding and trusted partner of financial institutions, especially when it comes to outsourced solutions and securely managing sensitive customer data. Our service offerings include the following:
• |
Deluxe Marketing Solutions – a variety of direct marketing solutions that help financial institutions acquire new customers, deepen existing customer relationships and retain customers. These offerings leverage data and analytics to help our clients execute marketing campaigns for deposit and lending products across multiple contact channels, including direct mail, email, online and other digital media. These offerings were augmented by the December 2016 acquisition of FMCG, a provider of data-driven marketing solutions for financial institutions, and the October 2015 acquisition of Datamyx®, a software-as-a-service data and analytics platform focused on marketing programs for lending products.
|
5
• |
Deluxe Treasury Management – comprehensive treasury management solutions, including accounts receivable processing and remote deposit capture, available at the customer site and as software-as-a-service and business process outsourced deployment models. These solutions include the offerings of RDM Corporation, which was acquired in April 2017, Data Support Systems, which was acquired in October 2016, and FISC Solutions, which was acquired in December 2015. |
• |
Deluxe Rewards – a loyalty and rewards platform that offers multiple touch points that enable our clients to have ongoing engagement with their customers. |
• |
Deluxe Strategic Sourcing – a comprehensive, outsourced service that enables financial institutions to improve efficiency, financial controls and pricing compared to self-managing multiple supplier relationships. |
• |
Banker's Dashboard® – online financial management tools that provide financial institutions with comprehensive daily insights into their financial picture.
|
• |
Provent® – a comprehensive suite of identity protection services largely complementary to our check offerings.
|
We continue to advance our MOS offerings both via acquisitions and internal development. In recent years, we have acquired a number of businesses that have expanded our MOS offerings, including data and analytics-driven marketing solutions and treasury management solutions. Sales of these higher growth services are expected to represent an increasing portion of our revenue. Additional information concerning our acquisitions appears under the caption “Note 5: Acquisitions” of the Notes to Consolidated Financial Statements appearing in Item 8 of this report. We expect that providing a growing selection of products and services will offset the impacts of the decline in check usage and the continued pricing pressure we are experiencing in our check programs. As such, we focus on accelerating the pace at which we introduce new products and services, utilizing client feedback and market research to identify client needs and gaps. We have also invested in extending the Deluxe brand to increase brand awareness and loyalty in the financial services market beyond check-related solutions.
Financial Services continues to simplify processes, eliminate complexity and lower costs. During 2017, we closed administrative facilities located in Omaha, Nebraska and Lincoln, Nebraska. During 2016, we closed a warehouse located in Nashville, Tennessee and during 2015, we closed a call center located in Plymouth, Michigan, as well as a warehouse located in Livonia, Michigan. The operations of these facilities were integrated into existing Financial Services operations.
Direct Checks
Direct Checks is the nation's leading direct-to-consumer check supplier, selling under various brand names, including Checks Unlimited®, Designer Checks®, Checks.com®, Check Gallery®, The Styles Check Company®, and Artistic Checks®, among others.
We use a variety of direct marketing techniques to acquire new customers, including newspaper inserts, in-package advertising, statement stuffers and co-op advertising. We also use search engine marketing and search engine optimization strategies to direct traffic to our websites, which include: checksunlimited.com, designerchecks.com, checks.com, 4checks.com, checkgallery.com, styleschecks.com, and artisticchecks.com, among others.
Direct Checks competes primarily on price and design. We believe that pricing in the direct-to-consumer channel is generally lower than retail prices charged to consumers in the financial institution channel. We compete on design by seeking to offer the most attractive selection of images with high consumer appeal, many of which are licensed from well-known artists and organizations.
Our Direct Checks strategies are as follows:
• |
Maximize the lifetime value of customers by selling new features, accessories and products; |
• |
Continue to optimize our cost and expense structure; and |
• |
Optimize cash flow. |
We market our products and services through targeted advertising, focusing on the internet channel. We continue to explore avenues to expand sales to existing customers through sales of accessories and other check-related products and services. One such example is the check protection service we offer in partnership with EZShield, Inc., which provides reimbursement to consumers for losses resulting from forged signatures or endorsements and altered checks. As in our other two business segments, Direct Checks continues to simplify processes, eliminate complexity and lower costs. We continue to identify additional opportunities to lower our cost and expense structure in all functional areas, particularly in the areas of marketing and fulfillment.
MANUFACTURING AND FULFILLMENT/SUSTAINABLE PRACTICES
We continue to focus on improving the customer experience by providing excellent service and quality, reducing costs and increasing productivity. We accomplish this by embedding lean operating principles in all processes, while emphasizing a culture of continuous improvement. Under this approach, employees work together to produce products, rather than working on
6
individual tasks in a linear fashion. Because employees assume more ownership of the end product, we experience improved quality and productivity, as well as lower costs.
We continue to sponsor “sustainability” initiatives that encompass environmentally-friendly practices. We have aligned with suppliers that promote sustainable business practices and we seek opportunities to eliminate wasted material, reduce cycle times and use more environmentally-friendly materials. More than 90% of our check and form paper is purchased from Forest Stewardship Council certified supplier mills and we use environmentally-friendly janitorial supplies. Our sustainability initiatives have also benefited our results of operations over the past several years as we focus on reducing our consumption of water, electricity and natural gas, and improving our transportation efficiency. We continue efforts to reduce solid waste sent to landfills, and we have been a member of the Environmental Protection Agency's Green Power Leadership Club since 2010. The renewable energy that we purchased during 2017 amounted to approximately 82% of our annual United States electricity needs.
Our expertise in logistics, productivity and inventory management has allowed us to reduce the number of production facilities we operate, while still meeting customer requirements. During 2017, we closed our Westlake Village, California fulfillment operation, during 2016, we moved production out of our Lancaster, California manufacturing facility, and during 2015, we closed our Plymouth, Michigan and Burnsville, Minnesota fulfillment operations. These operations were moved to other existing locations.
We have a shared services approach, which allows our 3 business segments to leverage shared manufacturing facilities to optimize capacity utilization, enhance operational excellence and foster a culture of continuous improvement. We continue to reduce costs by utilizing our assets and printing technologies more efficiently and by enabling employees to better leverage their capabilities and talents.
INDUSTRY OVERVIEW
Checks
According to the Federal Reserve study released in December 2016, debit card, credit card and ACH payments all exceeded the number of checks written in 2015. Approximately 19.4 billion checks were written in 2015, accounting for approximately 13% of all non-cash payment transactions. This is a reduction from the Federal Reserve Study released in December 2013 when checks written accounted for approximately 17% of all non-cash payment transactions. Checks written includes check payments and checks converted to ACH payments, which uses the check as a source document to initiate the ACH payment. The Federal Reserve estimates that checks written declined at an annual rate of approximately 4.8% between 2012 and 2015, a slower decline than the 8.8% annual decline documented between 2009 and 2012. In December 2017, the Federal Reserve released a supplement to its 2016 study. This supplement did not update the data regarding checks written; however, it did indicate that the annual decline in check payments was 3.1% between 2012 and 2015, lower than the December 2016 estimate of 4.4%. In 2018, we anticipate check orders to decline approximately 7%, slightly higher than our 2017 decline rate. We expect that the number of checks written will continue to decline due to the increasing use of alternative payment methods, including credit cards, debit cards, direct deposit, wire and ACH transfers, and internet-based bill paying services, as well as automated teller machines.
In addition, steps have been taken in the development of a real-time payments system in the United States. The Federal Reserve established the Faster Payments Task Force with the objective of identifying and evaluating approaches for implementing a faster payments system. In late 2017, The Clearing House Payments Company, LLC (TCH) implemented a clearing and settlement system allowing consumers and businesses to send and receive payments in real-time directly from their accounts at financial institutions. The National Automated Clearing House Association (NACHA) adopted Same-Day ACH rules to speed up the processing of ACH payments and systems such as Zelle®, Venmo®, Apple Pay® and various other mobile applications allow individuals to transfer funds to other users. In addition, cryptocurrencies have been gaining acceptance in the marketplace. We cannot predict the rate and the extent to which alternative payment methods will achieve acceptance and replace checks, whether as a result of legislative developments, changing payment systems, personal preferences or otherwise.
In addition to the shift to electronic payment methods, consumer spending, employment levels, and housing stock and starts also impact the number of checks consumers use. We estimate that the 2017 growth rates for consumer spending and private sector employment most likely had a neutral impact on our personal check businesses. An increase in housing stock and starts has a positive impact on the number of checks purchased, as new households typically are in need of new checks. According to statistics released by the United States Census Bureau in January 2018, housing units completed during 2017 increased almost 9% as compared to 2016. We cannot predict whether these economic trends will improve, stay the same or worsen in the near future.
Small Business Customers
According to data published by the United States Census Bureau, there were approximately 31 million small businesses in the United States in 2015, defined as independent businesses having fewer than 500 employees. According to data published
7
by Statistics Canada, there were approximately 4 million small businesses in Canada in 2016, defined as employer businesses with fewer than 100 employees.
In recent years, we believe the economy negatively impacted our operating results and/or our growth opportunities in our Small Business Services segment. We believe small businesses are more likely to be significantly affected by economic conditions than larger, more established companies. During a sluggish economy, it may be more difficult for small businesses to obtain credit and small businesses may choose to spend their limited funds on items other than our products and services. In addition, the December 2017 repeal of net neutrality rules could negatively affect our small business customers. If small businesses are forced to pay higher fees to maintain adequate speeds for their websites, it could reduce their spending on our products and services. The National Federation of Independent Business (NFIB) publishes the results of quarterly surveys which provide an indication of small business owners' view of economic conditions. The index of small business optimism published by the NFIB in December 2017 was 104.9, down slightly from 105.8 in December 2016. For 2017, the average index was 104.8, up significantly from the 96.3 average in 2016. At the same time, the net percent of small business owners expecting general business conditions to be better in 6 months declined to 37% in December 2017, as compared to 50% in December 2016. Although there continues to be some optimism from small business owners, including some belief that they will benefit from federal tax reform under the Tax Cuts and Jobs Act of 2017, we cannot predict whether sustainable positive trends will translate into economic growth. We also cannot predict whether economic trends will improve, stay the same or worsen in the near future.
Sales of business checks and forms have been declining, and we expect this trend to continue. In addition to the decrease in the use of checks due to the availability of alternative payment methods, continual technological improvements have provided small business customers with alternative means to execute and record business transactions. For example, because of the lower price and higher performance capabilities of personal computers, printers and mobile devices, small businesses now have alternate means to print many business forms. Additionally, electronic transaction systems, off-the-shelf business software applications, web-based solutions and mobile applications have been designed to replace pre-printed business forms. Greater acceptance of electronic signatures also contributes to the overall decline in printed products. It is difficult to predict the pace at which these alternative products and services will achieve widespread acceptance and replace standardized business forms.
Financial Institution Clients
Checks are most commonly ordered through financial institutions, including banks, credit unions and other financial services companies. As such, several developments related to financial institutions have affected the check printing portion of the payments industry.
Financial institutions seek to maintain the profits they have historically generated from their check programs, despite the decline in check usage. This continues to put significant pricing pressure on check printers. In addition, the number of potential financial institution clients in the United States is declining. According to statistics currently available online from the Federal Deposit Insurance Corporation and the Credit Union National Association, the number of financial institutions has been declining for many years. When financial institutions consolidate through mergers and acquisitions, often the newly combined entity seeks to reduce costs by leveraging economies of scale in purchasing, including its check supply contracts. This results in check providers competing intensely on price in order to retain not only their previous business with one of the financial institutions, but also to gain the business of the other financial institution in the merger/acquisition. Financial institution mergers and acquisitions can also impact the duration of our contracts. Normally, the length of our supply contracts with financial institutions ranges from 3 to 6 years. However, contracts may be renegotiated or bought out mid-term due to a consolidation of financial institutions. Banks, especially larger ones, may request prepaid product discounts in the form of cash incentives payable at the beginning of a contract. These contract acquisition payments negatively impact check producers' cash flows at the beginning of these contracts. To the extent financial institution failures and consolidations impact large portions of our customer base, this could have a significant impact on our financial institution check programs.
Direct Mail Response Rates
Direct Checks and portions of Small Business Services have, at times, experienced declines in response rates related to direct mail promotional materials. While we believe that media response rates have declined across a wide variety of products and services, we believe that the declines we have experienced are also attributable to the decline in check usage, the gradual obsolescence of standardized forms and the increasing use of e-commerce by both consumers and small businesses. We continually evaluate and redirect our marketing techniques in order to utilize the most effective and affordable advertising media.
8
Competition
Suppliers of small business services and supplies are highly fragmented and geographically dispersed, with many small local suppliers, large national retailers and internet-based providers. In these markets, the competitive factors influencing a customer's purchase decision are breadth and quality of product and service offerings, ease of use of web and other services, price, speed of delivery, convenience, the responsiveness and quality of customer support, and past experience with the supplier. Our primary competitors include traditional storefront printing companies; office superstores; companies offering website design and hosting and domain name registration; wholesale printers; online printing companies; email and social media marketing services companies; small business products and services resellers; media directory providers; and online and off-line suppliers of custom apparel, promotional products and customized gifts. Additionally, the competitive landscape for online small business suppliers continues to be challenging as new internet businesses are introduced and traditional businesses establish an online presence. We believe we are well-positioned in this competitive landscape through our broad customer base, including limited international expansion in web services, the breadth of our small business product and service offerings, multiple distribution channels, established relationships with our financial institution and telecommunications clients and other partners, competitive pricing tiers, ease of use of our web and other services, high quality and dependable service.
In the check printing portion of the payments industry, we face considerable competition from another large check printer in our traditional financial institution sales channel, from direct mail and internet-based sellers of personal and business checks, from check printing software vendors and from some retailers. We expect competition to remain intense as check usage continues to decline. Moreover, the check product must compete with alternative payment methods, including credit cards, debit cards, direct deposit, wire transfers, internet-based bill paying services and digital wallet applications, as well as automated teller machines. The principal factors on which we compete are product and service breadth, price, quality and check merchandising program management. We believe the key items which differentiate us from our competition include our fully automated flat check delivery package, our online performance dashboard and portal analytics tools for financial institution branches, our personalized customer call center experience, and our Deluxe Business Advantage program, which provides a fast and simple way for financial institutions to offer expanded personalized service to small businesses. In addition, to provide our small business customers with an online payment solution, our Small Business Services segment offers eChecks.
At times, check suppliers have reduced the prices of their products during the supplier selection process in an attempt to gain greater volume. The corresponding pricing pressure has negatively impacted our profit margins. Pricing pressure will continue to impact our results of operations through lower pricing levels or client losses. Additionally, product discounts in the form of cash incentives payable to financial institutions upon contract execution are a common practice within the industry. Both the number of financial institutions requesting these payments and the size of the payments has fluctuated in recent years. These up-front payments negatively impact check printers' cash flows at the beginning of the contracts, so we attempt to minimize them by structuring new contracts with alternative incentives throughout the duration of the contract.
Our Financial Services MOS offerings also face intense competition, including competition from financial institution core banking software providers, advertising agencies, providers of data and analytics marketing solutions, and numerous financial technology services providers offering services such as customer and account acquisition, fraud and security risk management, receivables management and treasury support services, and rewards and loyalty solutions. We expect the intensity of competition to increase from established and emerging financial technology companies. The competitive factors affecting Financial Services MOS offerings include breadth and quality of services, ease of use, price, solution completeness, responsiveness and quality of customer support, as well as the ability to manage end-to-end financial institution processes.
Seasonality
We experience seasonal trends in sales of some of our products. For example, holiday card and retail packaging sales and revenues from rewards and loyalty solutions, as well as search and email marketing, are typically stronger in the fourth quarter of the year due to the holiday season. Sales of tax forms are stronger in the first and fourth quarters of the year, and check sales for our Direct Checks segment have historically been stronger in the first quarter of the year. In addition, we may experience some fluctuations in revenue driven by our customers' marketing campaign cycles.
Materials, Supplies and Service Providers
The principal materials used in producing our main products are paper, plastics, ink, cartons and printing plate material, which we purchase from various sources. We also purchase stock business forms and promotional apparel produced by third parties. We believe that we will be able to obtain an adequate supply of materials from current or alternative suppliers.
We have entered into agreements with third-party providers for information technology services, including telecommunications and network server and transaction processing services. We also rely upon third parties to provide a portion of the data used to maintain our proprietary and non-proprietary databases, including credit and non-credit data from the national credit bureaus and other data brokers. We believe we would be able to obtain an alternative source of supply if one or more of our service providers failed to perform.
9
Governmental Regulation
We are subject to numerous international, federal, state and local laws and regulations that affect our business activities in areas including, but not limited to, labor, advertising, taxation, data privacy and security, digital content, consumer reports, consumer protection, online payment services, real estate, e-commerce, intellectual property, health care, environmental matters, and workplace health and safety. The cost of complying with these laws and regulations is significant and regulators may adopt new laws or regulations at any time. We believe that our business is operated in substantial compliance with all applicable laws and regulations. Further information regarding the impact of specific laws and regulations can be found in Item 1A of this report. At this time, we are not aware of any changes in laws or regulations that will have a significant impact on our business during 2018, with the exception of the Tax Cuts and Jobs Act that was enacted in December 2017 (the 2017 Act). We expect that our annual effective income tax rate for 2018 will be approximately 25% and we expect that our total tax payments in 2018 will be approximately $25.0 million less than in 2017, driven primarily by the 2017 Act.
Intellectual Property
We rely on a combination of trademark and copyright laws, trade secret and patent protection, and confidentiality and license agreements to protect our trademarks, software and other intellectual property. These protective measures afford only limited protection. Despite our efforts to protect our intellectual property, third parties may infringe or misappropriate our intellectual property or otherwise independently develop substantially equivalent products or services that do not infringe on our intellectual property rights, either of which may adversely impact our results of operations. In addition, we may be the target of aggressive and opportunistic enforcement of patents by third parties, including non-practicing entities.
EMPLOYEES
As of December 31, 2017, we employed 5,119 employees in the United States, 657 employees in Canada and 110 employees in Australia and Europe. None of our employees are represented by labor unions, and we consider our employee relations to be good.
AVAILABILITY OF COMMISSION FILINGS
We make available through our investor relations website, Deluxe.com/investor, our annual reports on Form 10-K, quarterly reports on Form 10-Q, current reports on Form 8-K and amendments to these reports filed or furnished pursuant to section 13(a) or 15(d) of the Exchange Act as soon as reasonably practicable after these items are electronically filed with or furnished to the SEC. These reports can also be accessed via the SEC website, sec.gov, or via the SEC's Public Reference Room located at 100 F Street N.E., Washington, D.C. 20549. Information concerning the operation of the SEC's Public Reference Room can be obtained by calling 1-800-SEC-0330.
A printed copy of this report may be obtained without charge by calling 651-787-1068, by sending a written request to the attention of Investor Relations, Deluxe Corporation, P.O. Box 64235, St. Paul, Minnesota 55164-0235, or by sending an email request to investorrelations@deluxe.com.
Further information about Deluxe Corporation is also available at Deluxe.com, facebook.com/deluxecorp and twitter.com/deluxecorp.
CODE OF ETHICS AND CORPORATE GOVERNANCE GUIDELINES
We have adopted a Code of Business Ethics that applies to all of our employees and our board of directors. The Code of Business Ethics is available on our investor relations website, Deluxe.com/investor, and also can be obtained free of charge upon written request to the attention of Investor Relations, Deluxe Corporation, P.O. Box 64235, St. Paul, Minnesota 55164-0235. Any changes or waivers of the Code of Business Ethics will be disclosed on our website. In addition, our Corporate Governance Guidelines and the charters of the Audit, Compensation, Corporate Governance and Finance Committees of our board of directors are available on our website or upon written request.
10
EXECUTIVE OFFICERS OF THE REGISTRANT
Our executive officers are elected by the board of directors each year. The following summarizes our executive officers and their positions.
Name |
Age |
Present Position |
Executive Officer Since |
Lee Schram |
56 |
Chief Executive Officer |
2006 |
Pete Godich |
53 |
Senior Vice President, Fulfillment |
2008 |
Julie Loosbrock |
58 |
Senior Vice President, Human Resources |
2008 |
Malcolm McRoberts |
53 |
Senior Vice President, Small Business Services |
2008 |
John Filby |
55 |
Senior Vice President, Financial Services |
2012 |
Tracey Engelhardt |
53 |
Senior Vice President, Direct-to-Consumer |
2012 |
Michael Mathews |
45 |
Senior Vice President, Chief Information Officer |
2013 |
Amanda Brinkman |
38 |
Vice President, Chief Brand and Communications Officer |
2014 |
Keith Bush |
47 |
Senior Vice President, Chief Financial Officer |
2017 |
Lee Schram has served as Chief Executive Officer since joining us in May 2006.
Pete Godich was named Senior Vice President, Fulfillment in March 2011.
Julie Loosbrock was named Senior Vice President, Human Resources in September 2008.
Malcolm McRoberts was named Senior Vice President, Small Business Services in February 2011.
John Filby was named Senior Vice President, Financial Services in April 2012.
Tracey Engelhardt was named Senior Vice President, Direct-to-Consumer in March 2017. From July 2012 to March 2017, Ms. Engelhardt served as Vice-President, Direct-to-Consumer.
Michael Mathews was named Senior Vice President, Chief Information Officer in March 2017. Mr. Mathews joined us in May 2013 as Vice President, Chief Information Officer. Prior to joining us, Mr. Mathews served as Senior Vice President, Strategy and Enterprise Programs for UnitedHealth Group from July 2009 to May 2013. UnitedHealth Group is a publicly traded diversified health and well-being company that provides health care coverage and benefits services and information and technology-enabled health services.
Amanda Brinkman joined us in January 2014 as Vice President, Chief Brand and Communications Officer. Prior to joining us, Ms. Brinkman was self-employed, operating her own brand agency from January 2013 to December 2013.
Keith Bush joined us in March 2017 as Senior Vice President, Chief Financial Officer. Prior to joining us, Mr. Bush was self-employed as a consultant to the airline industry from July 2016 to March 2017. From June 2009 through July 2016, Mr. Bush served as Senior Vice President, Finance for American Airlines.
Item 1A. Risk Factors.
Our business, prospects, results of operations, financial condition and cash flows could be adversely affected by various risks and uncertainties. These risks include, but are not limited to, the principal factors listed below and the other matters set forth in this Annual Report on Form 10-K. We have disclosed all known material risks. Additional risks not presently known to us, or that we currently believe are immaterial, may also adversely affect us. You should carefully consider all of these risks and uncertainties before investing in our common stock or other securities.
The following important factors could cause our actual results to differ materially from the statements we make from time to time regarding our expected future results, including, but not limited to, forecasts regarding revenue, earnings per share, cash provided by operating activities and expected cost savings. Any forecast reflects various assumptions that are subject to significant uncertainties and, as a matter of course, may prove to be incorrect. Further, the achievement of any forecast depends on numerous factors that are beyond our control. Consequently, we caution investors that forward-looking statements are predictions based on our current expectations about future events and are not guarantees of future performance. The variation of actual results or events from such statements may be material and adverse. You are cautioned not to base your entire analysis of our business and prospects upon isolated statements, and are encouraged to use the entire mix of historical and forward-looking information made available by us, and other information affecting us and our products and services, including the following factors.
11
We may not be successful at implementing our growth strategies.
We continue to execute strategies intended to drive sustained revenue and earnings growth with a focus on increasing marketing solutions and other services revenue, particularly treasury management, data-driven marketing solutions and web services. We believe these revenue streams represent our most significant growth opportunity. We have invested and plan to continue investing in several key enablers to achieve our strategies, including strengthening our portfolio of products and services, particularly technology-based solutions; investing in acquisitions; attracting and retaining customers; scaling our service offerings; enhancing brand awareness and positioning; growing our major accounts and dealer networks; and improving the customer experience. Our business strategies could fall short of our expectations for many reasons, including, among others:
• |
our failure to generate profitable revenue growth; |
• |
our failure to acquire new customers, retain our current customers and sell more products and services to current and new customers; |
• |
our inability to identify suitable acquisition candidates or to complete acquisitions on acceptable terms; |
• |
our failure to effectively operate, integrate or leverage the businesses we acquire; |
• |
the failure of our digital services and products to achieve widespread customer acceptance; |
• |
our inability to promote, strengthen and protect our brand; |
• |
our inability to implement improvements to our technology and other key assets to increase efficiency, enhance our competitive advantage and scale our operations; |
• |
our failure to effectively manage the growth, expanding complexity and pace of change of our business and operations; and |
• |
general economic conditions. |
In addition, we are focused on targeting our financial technology ("FinTech") solutions to larger financial institutions. These FinTech offerings include data-driven marketing solutions, including outsourced marketing campaign targeting and execution; treasury management solutions; and digital engagement solutions, including loyalty and rewards programs. If we are able to increase sales of these services to larger financial institutions, we may experience fluctuations in revenue driven by our clients' marketing campaign cycles. This may adversely affect our ability to accurately predict the timing of revenues and to meet short-term expectations of operating results. The resulting customer concentration could also increase our sensitivity to any material, adverse developments affecting our significant customers, and our top customers’ purchasing power could, in some cases, give them the ability to make greater demands with regard to pricing and contractual terms in general.
We can provide no assurance that our growth strategies will be successful either in the short-term or in the long-term, that they will generate a positive return on our investment, or that they will not reduce our operating margins. Additionally, if our strategies are not successful, or if there is market perception that our strategies are not successful, our reputation and brand may be damaged and our stock price may decline.
If we are unable to attract customers in a cost-effective manner or effectively develop and operate a multichannel customer experience, our business and results of operations would be adversely affected.
We use a variety of methods to promote our products and services, including direct mail advertising, email marketing, purchased search results from online search engines, broadcast media, advertising banners, social media and other online links. The profitability of our Direct Checks segment depends in large part on our ability to secure adequate advertising media placements at acceptable rates. We can provide no assurance regarding the future cost, effectiveness and/or availability of suitable advertising media. Additionally, our Direct Checks segment and portions of our Small Business Services segment have, at times, experienced declines in response rates related to direct mail promotional materials. While we believe that media response rates have declined across a wide variety of products and services, we believe that the declines we have experienced are also attributable to the decline in check usage, the gradual obsolescence of standardized forms products and the increasing use of e-commerce by both consumers and small businesses. In an attempt to offset these impacts, we continually modify our marketing and sales efforts and continue to shift a greater portion of our advertising investment to the internet. Competitive pressure may inhibit our ability to reflect increased costs in the prices of our products and new marketing strategies may not be successful. We can provide no assurance that we will be able to offset a decline in response rates, even with additional marketing and sales efforts.
In addition to print and email advertising, many customers come to our websites through internet search engines. If the search engines on which we rely modify their algorithms or terminate their relationship with us, fewer customers may be directed to our websites. As we analyze our overall advertising strategy, we may be forced to resort to more costly resources to replace lost internet traffic, which would adversely affect our results of operations. In addition, the cost of purchased search engine listings will likely increase as demand for them continues to grow, and further cost increases could negatively affect our profitability.
We believe we must maintain a relevant, multichannel experience for our customers. Customers expect to be able to order products and services from us however they please, whether that is via the mail, land-line phone, computer, tablet or
12
mobile phone. In particular, smart phones and tablet computing devices are increasingly being used as the primary means for accessing the internet and conducting e-commerce. Designing and purchasing custom products on mobile devices is more difficult than doing so with a traditional computer due to limited screen sizes, bandwidth and other variables. Beyond these difficulties, the development of mobile-oriented user interfaces and other technologies is complex and expensive. We are also dependent on the functionality of our systems with web browsers, mobile devices and operating systems that are controlled by third parties. These parties frequently introduce new devices, and from time to time they may introduce new operating systems or modify existing ones. Network carriers may also impact the ability to access specified content on mobile devices, and with the repeal of net neutrality rules in December 2017, network carriers could, at their discretion, negatively impact the speeds of our websites. In this situation, it may be necessary to pay additional fees for higher internet speeds, which could negatively affect our profitability.
Although we are constantly making investments to update our technology, we cannot predict the success of these investments. Multichannel marketing is rapidly evolving and we must keep pace with the changing expectations of our customers and new developments by our competitors. If we are unable to implement improvements to our customer-facing technology in a timely manner, or if our customer-facing technology does not function as designed, we could find it increasingly difficult to attract new and repeat visitors to our websites and convert these visitors to customers, which would result in decreased revenue.
The check printing and related products portion of the payments industry is mature, and check usage is declining.
Check printing continues to be a significant portion of our business. Revenue generated by the sale of checks was 43% of our consolidated revenue in 2017. We sell checks for personal and small business use and believe that there will continue to be a substantial demand for these checks for the foreseeable future, although the total number of checks written in the United States has been in decline since the mid-1990's. According to the most recent Federal Reserve study released in December 2016, the total number of checks written declined 4.8% each year between 2012 and 2015. We believe that the number of checks written will continue to decline due to the increasing use of alternative payment methods, including credit cards, debit cards, direct deposit, wire and ACH transfers, and internet-based bill paying services, as well as automated teller machines.
In addition, steps have been taken in the development of a real-time payments system in the United States. The Federal Reserve established the Faster Payments Task Force with the objective of identifying and evaluating approaches for implementing a faster payments system. In late 2017, The Clearing House Payments Company, LLC (TCH) implemented a clearing and settlement system allowing consumers and businesses to send and receive payments in real-time directly from their accounts at financial institutions. The National Automated Clearing House Association (NACHA) adopted Same-Day ACH rules to speed up the processing of ACH payments and systems such as Zelle®, Venmo®, Apple Pay® and various other mobile applications allow individuals to transfer funds to other users. In addition, cryptocurrencies have been gaining acceptance in the marketplace.
The rate and the extent to which alternative payment methods will achieve acceptance and replace checks, whether as a result of legislative developments, changing payment systems, personal preference or otherwise, cannot be predicted with certainty. A surge in the popularity of any of these alternative payment methods, or our inability to successfully offset the decline in check usage with other sources of revenue, would have an adverse effect on our business and results of operations.
Small Business Services' standardized business forms and related products face technological obsolescence and changing customer preferences.
Revenue generated by the sale of business forms was 11% of our consolidated revenue in 2017. Continual technological improvements have provided small business customers with alternative means to execute and record business transactions. For example, because of the lower price and higher performance capabilities of personal computers, printers and mobile devices, small businesses now have alternate means to print many business forms. Additionally, electronic transaction systems, off-the-shelf business software applications, web-based solutions and mobile applications have been designed to replace pre-printed business forms. Greater acceptance of electronic signatures also contributes to the overall decline in printed products. It is difficult to predict the pace at which these alternative products and services will achieve widespread acceptance and replace standardized business forms. If small business preferences change rapidly and we are unable to develop new products and services with comparable operating margins, our results of operations would be adversely affected.
We face intense competition in all areas of our business, and we expect that competition will continue to increase.
Although we are one of the leading check printers in the United States, we face considerable competition. In addition to competition from alternative payment methods, we also face intense competition from another large check printer in our traditional financial institution sales channel, from direct mail and internet-based sellers of personal and business checks, from check printing software vendors and from some retailers. In addition, the suppliers of small business and financial services products and services are intensely competitive, highly fragmented and geographically dispersed. Current and potential competitors for our Small Business Services segment include traditional storefront printing companies; office superstores; companies offering website design and hosting and domain name registration; wholesale printers; online printing companies; email and social media marketing services companies; small business products and services resellers; media directory providers; and offline and online suppliers of custom apparel, promotional products and customized gifts. Additionally, the
13
competitive landscape for online small business suppliers continues to be challenging as new internet businesses are introduced and traditional businesses establish an online presence. Current and potential competitors for Financial Services service offerings include financial institution core banking software providers, advertising agencies, providers of data and analytics marketing solutions, and numerous FinTech service providers offering services such as customer and account acquisition, fraud and security risk management, receivables management and treasury support services, and rewards and loyalty solutions. In addition, many of our potential financial institution clients have historically developed their key applications in-house and thus, we must compete with their in-house capacities. For financial institutions, switching from one vendor to another can be a significant undertaking, with some potential clients perceiving disadvantages such as loss of accustomed functionality, conversion costs and business disruption. Through our ongoing efforts to expand well beyond our legacy check-related products, we strive to overcome this resistance to changing vendors. We offer several solutions designed to help financial institutions operate more effectively and better address the needs of their customers throughout the customer life cycle, building on our reputation as a longstanding and trusted partner of financial institutions. However, our clients may continue to be reluctant to change suppliers and they may be hesitant to rely on outsourced solutions.
We can provide no assurance that we will be able to compete effectively against current and future competitors. In recent years, our revenue has benefited from price increases in all 3 of our business segments. Pricing is becoming more competitive for product and service providers, as the internet allows customers to easily compare prices. Pricing also continues to be competitive in our financial institution sales channel, as financial institutions seek to maintain their previous levels of profitability, even as check usage declines. We can provide no assurance that we will be able to increase prices in the future while remaining competitive. Continued competition could result in price reductions, reduced profit margins, loss of customers and an increase in up-front cash payments to financial institutions upon contract execution or renewal, all of which would have an adverse effect on our results of operations and cash flows.
Security breaches, computer malware or other cyber attacks involving the confidential information of our customers, employees or business partners could substantially harm our reputation and business.
Information security risks have increased in recent years, in part because of the proliferation of new technologies and increased use of the internet, as well as the increased sophistication and activities of hackers, terrorists and activists, some of which may be linked to hostile nation-state actors. We use internet-based channels that collect customers’ account and credit card information, as well as other sensitive information, including proprietary business information and personally identifiable information of our customers, employees, contractors, suppliers and business partners. We process hundreds of millions of records containing data related to individuals and small businesses. The secure and uninterrupted operation of our networks and systems, and of the processing and maintenance of this information, is critical to our business operations and strategy. We rely on various security procedures and systems to ensure the secure storage and transmission of information, including encryption and authentication technology licensed from third parties. Computer networks and the internet are, by nature, vulnerable to unauthorized access. An accidental or willful security breach could result in unauthorized access and/or use of customer information, including consumers' personally identifiable information. Our security measures could be breached by third-party action, computer viruses, accidents, employee or contractor error, or malfeasance by rogue employees.
Because techniques used to obtain unauthorized access, disable or degrade service, or sabotage computer systems change frequently, may be difficult to detect immediately, and generally are not recognized until they are launched against a target, we may be unable to implement adequate preventive measures. Unauthorized parties may also attempt to gain access to our systems or facilities through various means, including hacking into our systems or facilities, fraud, trickery or other means of deceiving employees and contractors. We have experienced distributed denial of service attacks by hackers aimed at disrupting internet traffic and/or attempting to place illegal or abusive content on our or our customers’ websites. Additionally, our customers and employees have been and will continue to be targeted by parties using fraudulent "phishing" emails to misappropriate personal information or to introduce viruses or other malware through "trojan horse" programs to our users' computers. To-date, these various threats have not materially impacted our business or financial results. However, we can provide no assurance of a similar result in the future.
Although we invest in a system of information security and controls, a party that is able to circumvent our security measures could misappropriate our or our customers' personal and proprietary information, cause interruption in our operations, damage our computers or those of our users, or otherwise damage our reputation, all of which could deter clients and consumers from ordering our products and services, and result in the termination of client contracts. Additionally, it is possible that there could be vulnerabilities that could impact large segments of mobile, computer or server architecture. Any of these events would adversely affect our business and financial results. In addition, if we were to experience an information security breach, we may be required to expend significant amounts to remedy, protect against, or mitigate the effect of the breach, and we may not be able to remedy the situation in a timely manner, or at all. We could also be exposed to time-consuming and expensive litigation, government inquiries and/or enforcement actions. If we are unsuccessful in defending a lawsuit regarding information security breaches, we may be forced to pay damages, penalties and fines, any of which would have an adverse effect on our financial results.
In addition, there are federal, state and international laws requiring companies to notify individuals of information security breaches involving their personal data, the cost of which could negatively affect our financial results. These mandatory disclosures regarding an information security breach often lead to widespread negative publicity. If we were required to make
14
such a disclosure, it may cause our clients and customers to lose confidence in the effectiveness of our information security measures. Likewise, general publicity regarding information security breaches at other companies could lead to the perception among the general public that e-commerce is not secure. This could decrease traffic to our websites, negatively affect our financial results and limit future business opportunities.
Interruptions to our website operations or information technology systems, or failure to maintain our information technology platform, could damage our reputation and harm our business.
The satisfactory performance, reliability and availability of our information technology systems is critical to our reputation and our ability to attract and retain customers. We could experience temporary interruptions in our websites, transaction processing systems, network infrastructure, service technologies, printing production facilities or customer service operations for a variety of reasons, including, among others: human error, software errors, security breaches, power loss, telecommunications failures, equipment failures, vandalism, fire, flood, extreme weather, terrorism, and other events beyond our control. Furthermore, as we focus resources on our growth strategies, we have reduced our investment in the development of our legacy systems that support our checks and forms businesses, with a focus on sustaining and maintaining such systems. These legacy systems operate with minimal or no vendor support, contain hardware and software that we are not able to update and are difficult to maintain, yet any interruption caused by a failure or breach of these systems could create disruption in the core businesses that generate a declining portion of our revenue. In addition, our technology, infrastructure and processes may contain undetected errors or design faults that may cause our websites or operating systems to fail. Over the past two years, we shifted a substantial portion of our applications to a private cloud-based environment. While we maintain redundant systems and backup databases and applications software to ensure continuous access to cloud services, it is possible that access to our software capabilities could be interrupted and our disaster recovery planning may not account for all eventualities. The failure of our systems could interfere with the delivery of products and services to our customers, impede our customers' ability to do business and result in the loss or corruption of critical data. In addition to the potential loss of customers, we may be required to incur additional development costs and divert technical and other resources, and we may be the subject of negative publicity and/or liability claims, all of which would adversely affect our reputation and operating results.
In addition, our continued development and implementation of new generation software solutions and information technology infrastructure may take longer than originally expected and require the acquisition of additional personnel and other resources, which may adversely affect our business, results of operations and financial condition. Any inability to deploy new generation information technology throughout our organization would result in our operating multiple platforms, which would increase costs.
We face uncertainty regarding the success of recent and future acquisitions, which could have an adverse impact on our operating results.
We have acquired over 25 companies in the last 3 years, the details of which appear under the caption “Note 5: Acquisitions” of the Notes to Consolidated Financial Statements appearing in Item 8 of this report. We have invested in acquisitions that offer marketing solutions and other services and that extend the range of products and services we offer to financial institutions and small businesses, including treasury management and data-driven marketing solutions. In addition, over the past several years, we have purchased the operations of many small business distributors with the intention of growing revenue in our major accounts and dealer channels. The integration of any acquisition involves numerous risks, including, among others:
• |
difficulties and/or delays in assimilating operations, products and services, including effectively scaling revenue and ensuring a strong system of information security and controls is in place; |
• |
failure to realize expected synergies and savings or to achieve projected profitability levels on a sustained basis; |
• |
diversion of management's attention from other business concerns and risks of managing an increasingly diverse set of products and services across expanded and new industries; |
• |
unanticipated integration costs; |
• |
difficulty in maintaining controls, procedures and policies, especially when the acquired business was a non-public company and may not have employed the same rigor in these areas as required for a publicly traded company; |
• |
decisions by our customers or the customers of the acquired business to temporarily or permanently seek alternate suppliers; |
• |
difficulty in assimilating the acquired business into our corporate culture; |
• |
failure to address legacy distributor account protection rights; |
• |
unidentified issues not discovered during our due diligence process, including product or service quality issues, intellectual property issues and tax or legal contingencies; and |
• |
loss of key employees. |
One or more of these factors could impact our ability to successfully operate, integrate or leverage an acquisition and could negatively affect our results of operations.
We expect to continue to invest in acquisitions. The time and expense associated with finding suitable businesses, technologies or services to acquire can be disruptive to our ongoing business and may divert management’s attention. We
15
cannot predict whether suitable acquisition candidates can be acquired on acceptable terms or whether any acquired products, technologies or businesses will contribute to our revenue or earnings to any material extent. We may need to seek financing for larger acquisitions, which would increase our debt obligations and may not be available on terms that are favorable to us. Additionally, significant acquisitions typically result in additional contingent liabilities and/or additional amortization expense related to acquired intangible assets, and thus, could adversely affect our business, results of operations and financial condition.
We may not succeed in promoting and strengthening our brand, which could prevent us from acquiring customers and increasing revenue.
The success of our businesses depends, in part, on our ability to attract new and repeat customers. For this reason, a component of our business strategy is the promotion and strengthening of the Deluxe brand. We believe that the importance of brand recognition is essential for the success of our service offerings because of the level of competition for these services. Customer awareness of our brand, as well as the perceived value of our brand, will depend largely on the success of our marketing efforts and our ability to provide a consistent, high quality customer experience. To promote our brand, we have incurred, and will continue to incur, expense related to advertising and other marketing efforts. We can provide no assurance that these efforts will be successful or that our revenue will increase at a level commensurate with our marketing expenditures. There is also the risk that negative information about Deluxe, even if based on rumor or misunderstanding, could adversely affect our business. In early 2018, we entered into a partnership with television personality Ty Pennington, who will appear in our online series, Small Business Revolution – Main Street. Previously, we had a partnership with Robert Herjavec of the television show Shark Tank, and his episodes of the Small Business Revolution series remain available online. If our business partners are the subject of adverse news reports or negative publicity, such events could reduce the effectiveness of our partnerships, which in turn, could adversely affect our business and results of operations.
A component of our brand promotion strategy is establishing a relationship of trust with our customers, which we believe can be achieved by providing a high-quality customer experience. We have invested, and will continue to invest, resources in website development, design and technology, and customer service and production operations. Our ability to provide a high-quality customer experience is also dependent on external factors including the reliability and performance of our suppliers, telecommunications providers and third-party carriers. If we are unable to provide a high-quality customer experience for any reason, our reputation may be harmed and our efforts to develop brand loyalty could be adversely impacted. The failure of our brand promotion activities to meet our expectations could adversely affect our ability to attract new customers and maintain customer relationships, adversely harming our business and results of operations.
If we do not adapt to changes in technology in a timely and cost-effective manner, our ability to sustain and grow our business could be adversely affected.
Changes in the nature of technology solutions used by small businesses and their customers may occur rapidly. In addition, the markets for many of the services provided by our Financial Services segment are characterized by constant technological changes. The introduction of competing products and services using new technologies, the evolution of industry standards or the introduction of more attractive products or services could make some or all of our products and services less desirable, or even obsolete. These potential changes are magnified by the intense competition we face. To be successful, our technology-based products and services must keep pace with technological developments and evolving industry standards, address the ever-changing and increasingly sophisticated needs of our customers, and achieve market acceptance. We could lose current and potential customers if we are unable to develop products and services that meet these changing demands in a timely manner. Additionally, our operating results could be adversely affected if we are required to incur substantial costs to keep pace with technological advances.
If third-party providers of certain significant information technology needs are unable to provide services, our business could be disrupted and the cost of such services could increase.
We have entered into agreements with third-party providers for information technology services, including telecommunications, network server, cloud computing and transaction processing services. In addition, we have agreements with companies to provide services such as online payment solutions. A service provider's ability to provide services could be disrupted for a variety of reasons, including unauthorized access, computer viruses, accidental or intentional actions, electrical disruptions, or other conditions. In the event that one or more of our service providers is unable to provide adequate or timely information technology services, our ability to deliver products and services to our customers could be adversely affected. Although we believe we have taken reasonable steps to protect our business through contractual arrangements with our service providers, we cannot completely eliminate the risk of disruption in service. Any significant disruption could harm our business, including damage to our brand and loss of customers. Additionally, although we believe that information technology services are available from numerous sources, a failure to perform by one or more of our service providers could cause a material disruption in our business while we obtain an alternative source of supply. The use of substitute third-party providers could also result in increased expense.
16
Asset impairment charges would have a negative impact on our consolidated results of operations.
Goodwill and an indefinite-lived trade name represented 52% of our total assets as of December 31, 2017. On at least an annual basis, we assess whether the carrying value of these assets is impaired. This analysis considers factors including, but not limited to, economic, market and industry conditions. Circumstances that could indicate a decline in the fair value of one or more of our reporting units include, but are not limited to, the following:
• |
a decline in our stock price for a sustained period; |
• |
a downturn in economic conditions that negatively affects our actual and forecasted operating results; |
• |
a material acceleration of order volume declines for our Direct Checks segment; |
• |
the failure of recent acquisitions to achieve expected operating results; or |
• |
changes in our business strategies. |
Such situations may require us to record an impairment charge for a portion of goodwill and/or our indefinite-lived trade name. For example, during 2017, we recorded a goodwill impairment charge of $28.4 million related to our Small Business Services Safeguard reporting unit. The impairment analysis of this reporting unit, which incorporated the results of the annual strategic planning process, indicated lowered projected long-term revenue growth and profitability levels resulting from changes in market trends and the mix of products and services sold, including the continuing decline in checks and forms. We are also required to assess the carrying value of other long-lived assets, including amortizable intangibles and assets held for sale. If we were required to record additional asset impairment charges for any reason, our consolidated results of operations would be adversely affected.
Our variable-rate indebtedness exposes us to interest rate risk and our credit facility matures in February 2019.
Borrowings under our credit facility are subject to variable rates of interest and expose us to interest rate risk. If interest rates were to increase, our interest expense would increase, negatively affecting earnings and reducing cash flows available for working capital, capital expenditures and acquisitions.
Our credit facility matures in February 2019. As such, we will need to repay, refinance, replace or otherwise extend the maturity of our credit facility. Our ability to do so will be dependent on, among other things, business conditions, our financial performance and the general condition of the financial markets. If a financial disruption were to occur at the time that we are required to repay, refinance or replace indebtedness outstanding under our credit facility, we could be forced to undertake alternate financings under current market terms, negotiate for an extension of the maturity of the credit facility or sell assets and delay capital expenditures in order to generate proceeds that could be used to repay our indebtedness. We can provide no assurance that the terms of any new debt agreements will be as favorable as those under our current credit facility, which would negatively affect our results of operations and cash flow.
Governmental regulation is continuously evolving and could limit or harm our business.
We are subject to numerous international, federal, state and local laws and regulations that affect our business activities in areas including, but not limited to, labor, advertising, taxation, data privacy and security, digital content, consumer reports, consumer protection, online payment services, real estate, e-commerce, intellectual property, health care, environmental matters, and workplace health and safety. The cost of complying with these laws and regulations is significant. In addition, regulators may adopt new laws or regulations at any time, including triggering enforcement actions, or their interpretation of existing laws may change and/or differ from ours. These various regulatory requirements could impose significant limitations on our business activities, require changes to our business, restrict our use or storage of personal information, or cause changes in our customers' purchasing behavior which may make our business more costly and/or less efficient and may require us to modify our current or future products, services, systems or processes. We cannot quantify or predict with any certainty the likely impact of such changes on our business, prospects, financial condition or results of operations.
Portions of our business operate within highly regulated industries and our business results could be significantly affected by the laws and regulations to which we are subject. For example, federal, state and international laws and regulations regarding the protection of certain consumer information require us to develop, implement and maintain policies and procedures to protect the security and confidentiality of consumers' nonpublic personal information. Portions of our business are subject to regulations affecting payment processing, including ACH, remote deposit capture, and lockbox services. These laws and regulations require us to develop, implement, and maintain certain policies and procedures related to payment processing. We are also subject to additional requirements in certain of our contracts with financial institution clients and communications service providers, which are often more restrictive than the regulations, as well as confidentiality clauses in certain of our contracts related to small businesses’ customer information. These regulations and agreements typically limit our ability to use or disclose nonpublic personal information for other than the purposes originally intended, which could limit business opportunities. Proposed cyber security regulations may also increase the cost of compliance for the protection of nonpublic personal information. The complexity of compliance with these various regulations may increase our cost of doing business and may affect our financial institution clients, reducing their discretionary spending and thus, reducing their capacity to purchase our products and services.
17
Due to our increasing use of the internet for sales and marketing, laws specifically governing digital commerce, the internet, mobile applications, search engine optimization, behavioral advertising and email marketing may have an impact on our business. Existing and future laws governing issues such as net neutrality, digital and social marketing, privacy, consumer protection or commercial email may limit our ability to market and provide our products and services. Changing data protection regulations may increase the cost of compliance in servicing international markets for our wholesale and retail business services channels. More restrictive legislation, such as new privacy laws, search engine marketing restrictions, “anti-spam” regulations, or email privacy rules, could decrease marketing opportunities, decrease traffic to our websites, and/or increase the cost of obtaining new customers.
Because of additional regulatory costs, financial institutions may put significant pricing pressure on their suppliers, including their check and service providers. The increase in cost and profit pressure may also lead to further consolidation of financial institutions. Additionally, some financial institutions are wary of offering add-on services, such as bundled products, fraud/identity protection, expedited check delivery or rewards programs, to their customers. It would have an adverse impact on our results of operations if we were unable to market such services to consumers or small businesses through our financial institution clients. Additionally, as our product and service offerings become more technologically focused, and with expanded regulatory expectations for supervision of third-party service providers, additional portions of our business could become subject to direct federal regulation and/or examination. This would increase our cost of doing business and could slow our ability to introduce new products and services and otherwise adapt to a rapidly changing business environment.
We are subject to environmental risks which, if realized, could have an adverse impact on our operating results. Our printing facilities are subject to many federal, state and local regulations designed to protect the environment, including those related to air emissions, wastewater discharge, waste disposal, and remediation of contaminated sites. We have sold former printing facilities to third parties and, in some instances, have agreed to indemnify the buyer of the facility for certain environmental liabilities. Unforeseen conditions at current or former facilities could result in additional liability and expense beyond our insurance coverage.
Sales and other tax collection requirements could have an adverse effect on our business. We currently collect sales, use and similar taxes in jurisdictions where our legal entities have a physical presence, in accordance with landmark decisions of the United States Supreme Court. States and local jurisdictions have begun enacting legislation requiring collection beyond our current practices. This potential increased cost to our customers may discourage them from purchasing our products and services, which would have an adverse effect on our business. Furthermore, if one or more state or local jurisdictions successfully asserts that we should have collected sales or other taxes in the past, but did not, we could incur a substantial liability for uncollected taxes. In addition, federal and state income tax laws and regulations are subject to change and could impact our consolidated results of operations and financial position. Federal tax reform legislation, which was enacted in December 2017 as the Tax Cuts and Jobs Act (the 2017 Act), resulted in a reduction in our 2017 income tax expense of approximately $20.5 million. We expect that our annual effective income tax rate for 2018 will be approximately 25% and we expect that our total tax payments in 2018 will be approximately $25.0 million less than in 2017, driven primarily by the 2017 Act.
Economic conditions could have an adverse effect on operating results in each of our business segments.
Economic conditions have affected, and will continue to affect, our results of operations and financial position. Current and future economic conditions that affect consumer and business spending, including unemployment levels, the availability of credit, and small business confidence, as well as the financial condition and growth prospects of our customers, may adversely affect our business and results of operations.
A significant portion of our business relies on small business spending. As such, the level of small business confidence and the rate of small business formations and closures impact our business. We believe small businesses are more likely to be significantly affected by economic downturns than larger, more established companies. During a sluggish economy, it may be more difficult for small businesses to obtain credit and small businesses may choose to spend their limited funds on items other than our products and services. The National Federation of Independent Business (NFIB) publishes the results of monthly surveys that provide an indication of small business owners' view of economic conditions. The index of small business optimism published by the NFIB in December 2017 was 104.9, down slightly from 105.8 in December 2016. For 2017, the average index was 104.8, up significantly from the 96.3 average in 2016. At the same time, the net percent of small business owners expecting general business conditions to be better in 6 months declined to 37% in December 2017, as compared to 50% in December 2016. Although there continues to be some optimism from small business owners, including some belief that they will benefit from federal tax reform under the Tax Cuts and Jobs Act of 2017, we cannot predict whether sustainable positive trends will translate into economic growth. Within our personal check printing businesses, consumer spending, employment levels, and housing stock and starts impact the number of checks consumers use. We estimate that the 2017 growth rates for consumer spending and private sector employment most likely had a neutral impact on our personal check businesses. An increase in housing stock and starts has a positive impact on the number of checks purchased, as new households typically are in need of new checks. According to statistics released by the United States Census Bureau in January 2018, housing units completed during 2017 increased almost 9% as compared to 2016. We cannot predict whether these economic trends will improve, stay the same or worsen in the near future.
18
As a result of global economic conditions in recent years, a number of financial institutions sought additional capital, merged with other financial institutions and, in some cases, failed. This turmoil in the financial services industry affected and may continue to affect our results of operations. The failure of one or more of our larger financial institution clients, or large portions of our customer base, could adversely affect our operating results. In addition to the possibility of losing a significant client, the inability to recover contract acquisition payments made to one or more of our larger financial institution clients, or the inability to collect accounts receivable or contractually required contract termination payments, could have a significant negative impact on our results of operations. There may also be an increase in financial institution mergers and acquisitions during periods of economic uncertainty. Such an increase could adversely affect our operating results. Often the newly combined entity seeks to reduce costs by leveraging economies of scale in purchasing, including its check supply and business services contracts. This results in providers competing intensely on price in order to retain not only their previous business with one of the financial institutions, but also to gain the business of the other party in the merger/acquisition. In addition, we are focused on targeting our FinTech solutions to larger financial institutions. The resulting customer concentration could increase our sensitivity to any material, adverse developments affecting our significant customers, including adverse economic conditions. Although we devote considerable effort toward the development of a competitively-priced, high-quality selection of products and services for the financial services industry, there can be no assurance that significant financial institution clients will be retained or that the impact of the loss of a significant client can be offset through the addition of new clients or by expanded sales to our remaining clients.
A deterioration in financial markets and/or in general business conditions in 2018 would negatively affect our operating results.
If we are unable to attract and retain key personnel and other qualified employees, our business could suffer.
The success of our business depends on the contributions and abilities of key employees, especially in our digital services businesses and specifically in sales, marketing, product management, data analytics and information technology. If we are unable to retain our existing employees and/or attract qualified personnel, we may not be able to grow and manage our business effectively. We can provide no assurance that we will be successful in attracting and retaining such personnel.
The cost and availability of materials, delivery services and energy could adversely affect our operating results.
We are subject to risks associated with the cost and availability of paper, plastics, ink, retail packaging supplies, promotional materials, other raw materials, delivery services and energy. Paper costs represent a significant portion of our materials cost. Paper is a commodity and its price has been subject to volatility due to supply and demand in the marketplace, as well as volatility in the raw material and other costs incurred by our paper suppliers. There are also relatively few paper suppliers and these suppliers are under financial pressure as paper use declines. As such, when our suppliers increase paper prices, we may not be able to obtain better pricing from alternative suppliers. Historically, we have not been negatively impacted by paper shortages because of our relationships with paper suppliers. However, we can provide no assurance that we will be able to purchase sufficient quantities of paper if such a shortage were to occur.
We depend upon third-party providers for delivery services and for outsourced products and services. Events resulting in the inability of these service providers to perform their obligations, such as work slowdowns or extended labor strikes, could adversely impact our results of operations by requiring us to secure alternate providers at higher costs. Postal rates are dependent on the operating efficiency of the United States Postal Service (USPS) and on legislative mandates imposed upon the USPS. Postal rates have increased in recent years and the USPS has incurred significant financial losses. This may result in changes to the breadth and/or frequency of USPS mail delivery services in the future. In addition, fuel costs have fluctuated over the past several years. Increased fuel costs can increase the costs we incur to deliver products to our customers, as well as the price we pay for outsourced products and services. Competitive pressures and/or contractual arrangements may inhibit our ability to reflect increased costs in the price of our products.
The failure to reduce costs could have an adverse impact on our operating results.
Intense competition, declines in the use of checks and business forms, the commoditization of web services, and sluggish economic conditions compel us to continually improve our operating efficiency in order to maintain or improve profitability. We have significantly reduced costs over the past several years, primarily within sales, marketing, service fulfillment and operational support, as well as our shared services functions, including product fulfillment, information technology, real estate, finance and human resources. We realized net cost reductions of approximately $45.0 million in 2017, as compared to our 2016 results of operations, and we will continue to explore ways to simplify our business processes and reduce our cost and expense structure. Cost reduction initiatives have required and will continue to require up-front expenditures related to items such as redesigning and streamlining processes, consolidating information technology platforms, standardizing technology applications, further enhancing our strategic supplier sourcing arrangements, improving real estate utilization and funding employee severance benefits. We can provide no assurance that we will achieve future cost reductions or that we will do so without incurring unexpected or greater than anticipated expenditures. Moreover, we may find that we are unable to achieve business simplification and/or cost reduction goals without disrupting our business and, as a result, may choose to delay or forgo certain cost reductions as business conditions require. Failure to continue to improve our operating efficiency could adversely affect our business if we are unable to remain competitive.
19
We could lose access to data sources which could harm our ability to provide certain of our products and services.
We rely upon data from external sources to maintain our proprietary and non-proprietary databases, including data received from customers, strategic partners and various government and public record sources. This data includes credit and non-credit data from the national credit bureaus and other data brokers. Although we have not experienced material issues in this regard, our data sources could stop providing data, they could provide untimely data, or they could fail to adhere to our quality control standards, causing us to incur additional expense to appropriately utilize the data. In addition, our data sources could increase the costs of their data for a variety of reasons, including legislatively or judicially imposed restrictions on use, a perception that our systems are insecure, or for competitive reasons.
If a substantial number of data sources or certain key data sources were to withdraw their services, if we were to lose access to data due to government regulation, if we were to lose exclusive right to the use of data, or if the collection of data were to become uneconomical, our ability to provide our products and services could be negatively impacted. We can provide no assurance that we would be able to identify and contract with suitable alternative data suppliers and integrate these data sources into our product and service offerings.
Third-party claims could result in costly and distracting litigation, and in the event of an unfavorable outcome, could have an adverse effect on our business, financial condition and results of operations.
From time to time, we are involved in claims, litigation and other proceedings relating to the conduct of our business, including purported class action litigation. Such legal proceedings may include claims related to our employment practices; claims alleging breach of contractual obligations; claims asserting deceptive, unfair or illegal business practices; or claims alleging violations of consumer protection-oriented laws. In addition, third parties may assert patent and other intellectual property infringement claims against us and/or our clients, which could include aggressive and opportunistic enforcement of patents by non-practicing entities. Any such claims could result in litigation against us and could also result in proceedings being brought against us by various federal and state agencies that regulate our business. The number and significance of these claims and proceedings has increased as our businesses have evolved and expanded in scope. These claims, whether successful or not, could divert management's attention, result in costly and time-consuming litigation, or both. Accruals for identified claims or lawsuits are established based on our best estimates of our probable liability. However, we cannot accurately predict the ultimate outcome of any such proceedings due to the inherent uncertainties of litigation and other dispute resolution mechanisms. Any unfavorable outcome of a material claim or material litigation could result in a material adverse effect on our business, financial condition and results of operations.
We are subject to customer payment-related risks, which could adversely affect our business and financial results.
We accept payments for our products and services on our websites by a variety of methods, including credit and debit cards, checks and wire transfers. For debit and credit cards, we pay interchange and other fees that may increase over time. We are also subject to payment card association operating rules and requirements, including Payment Card Industry Data Security Standards, a set of security standards designed to ensure that all companies that accept, process, store or transmit credit card information maintain a secure environment. These rules and requirements have changed over time and could change in the future or be reinterpreted to make it more costly, more difficult or impossible for us to comply. If we fail to comply with these rules and requirements, we may be subject to fines and/or higher transaction fees. Any changes could increase our cost of compliance, which would negatively affect our financial results. We could also lose our ability to accept credit and debit card payments from our customers, which would likely result in the loss of customers and the inability to attract new customers.
In addition, we may be liable for fraudulent transactions conducted on our websites, such as the use of stolen credit card numbers. While we do have safeguards in place, we cannot prevent all fraudulent transactions. To date, we have not incurred significant losses from payment-related fraud. However, such transactions negatively impact our results of operations and could subject us to penalties from payment card associations for inadequate fraud protection.
We may be unable to protect our rights in intellectual property, which could harm our business and ability to compete.
We rely on a combination of trademark and copyright laws, trade secret and patent protection, and confidentiality and license agreements to protect our trademarks, software and other intellectual property. These protective measures afford only limited protection. Despite our efforts to protect our intellectual property, third parties may infringe or misappropriate our intellectual property or otherwise independently develop substantially equivalent products or services that do not infringe on our intellectual property rights. Policing unauthorized use of our intellectual property is difficult. We may be required to spend significant resources to protect our trade secrets and to monitor and police our intellectual property rights. The loss of intellectual property protection or the inability to secure or enforce intellectual property protection could harm our business and ability to compete.
20
A decline in the value of our postretirement medical plan assets and/or a significant increase in the number of participants in our postretirement medical plan could adversely affect our operating results and cash flows.
The fair value of our postretirement medical plan assets is subject to various risks, including credit, interest and overall market volatility risk. If the equity markets were to experience a significant decline in value, the fair value of our plan assets would decrease. This would affect the funded status of our plan and result in higher postretirement benefit expense in the future. Although our obligation is limited to funding benefits as they become payable, future declines in the fair value of our plan assets could also result in the need to contribute increased amounts of cash to fund benefits payable under the plan.
The number of participants in our postretirement medical plan could increase significantly. For the 2018 plan year, 43.8% of those eligible to participate in our postretirement medical plan have elected not to participate. If a significant portion of those not participating were to opt-in to our plan, our benefit obligation would increase, which would result in increased expense. Although our plan is currently overfunded, a significant increase in plan participants could also require us to contribute increased amounts of cash to fund benefits payable under the plan.
Item 1B. Unresolved Staff Comments.
None.
Item 2. Properties.
Our principal executive office is an owned property located in Shoreview, Minnesota. As of December 31, 2017, we occupied 65 facilities throughout the United States, 7 facilities in Canada, 2 facilities in Europe and a facility in Australia where we conduct printing and fulfillment, call center, data center and administrative functions. Approximately 20% of our facilities are owned, while the remaining 80% are leased. These facilities have a combined floor space of approximately 3.0 million square feet. We believe that our properties are sufficiently maintained and are adequate and suitable for our business needs as presently conducted.
Item 3. Legal Proceedings.
We record provisions with respect to identified claims or lawsuits when it is probable that a liability has been incurred and the amount of the loss can be reasonably estimated. Claims and lawsuits are reviewed quarterly and provisions are taken or adjusted to reflect the status of a particular matter. We believe the recorded reserves in our consolidated financial statements are adequate in light of the probable and estimable outcomes. Recorded liabilities were not material to our financial position, results of operations or liquidity, and we do not believe that any of the currently identified claims or litigation will materially affect our financial position, results of operations or liquidity upon resolution. However, litigation is subject to inherent uncertainties, and unfavorable rulings could occur. If an unfavorable ruling were to occur, it may cause a material adverse impact on our financial position, results of operations or liquidity in the period in which the ruling occurs or future periods.
Item 4. Mine Safety Disclosures.
Not applicable.
21
PART II
Item 5. Market for Registrant's Common Equity, Related Stockholder Matters and Issuer Purchases of Equity Securities.
Our common stock is traded on the New York Stock Exchange under the symbol DLX. Dividends are declared by our board of directors on a current basis, and therefore, are subject to change in the future. As of December 31, 2017, the number of shareholders of record was 6,491. The table below shows the per share price ranges of our common stock for the past two fiscal years as quoted on the New York Stock Exchange, as well as the quarterly dividend amount for each period.
Stock price |
||||||||||||||||
Dividend |
High |
Low |
Close |
|||||||||||||
2017 |
||||||||||||||||
Quarter 4 |
$ |
0.30 |
$ |
77.36 |
$ |
66.98 |
$ |
76.84 |
||||||||
Quarter 3 |
0.30 |
74.60 |
67.01 |
72.96 |
||||||||||||
Quarter 2 |
0.30 |
74.13 |
66.43 |
69.22 |
||||||||||||
Quarter 1 |
0.30 |
75.94 |
69.93 |
72.17 |
||||||||||||
2016 |
||||||||||||||||
Quarter 4 |
$ |
0.30 |
$ |
73.42 |
$ |
59.47 |
$ |
71.61 |
||||||||
Quarter 3 |
0.30 |
70.26 |
64.78 |
66.82 |
||||||||||||
Quarter 2 |
0.30 |
67.81 |
59.83 |
66.37 |
||||||||||||
Quarter 1 |
0.30 |
62.77 |
49.46 |
62.49 |
||||||||||||
The following table shows purchases of our own equity securities, based on trade date, which were completed during the fourth quarter of 2017:
Period |
Total number of shares purchased |
Average price paid per share |
Total number of shares purchased as part of publicly announced plans or programs |
Maximum approximate dollar value of shares that may yet be purchased under the plans or programs |
||||||||||
|
October 1, 2017 -
October 31, 2017
|
14,400 |
$ |
69.37 |
14,400 |
$ |
253,657,577 |
||||||||
|
November 1, 2017 -
November 30, 2017
|
170,300 |
68.89 |
170,300 |
241,926,212 |
||||||||||
|
December 1, 2017 -
December 31, 2017
|
30,716 |
71.62 |
30,716 |
239,726,484 |
||||||||||
Total |
215,416 |
69.31 |
215,416 |
239,726,484 |
||||||||||
In May 2016, our board of directors approved an authorization for the repurchase of up to $300.0 million of our common stock, effective at the conclusion of a previous authorization. This authorization has no expiration date and $239.7 million remained available for purchase as of December 31, 2017.
While not considered repurchases of shares, we do at times withhold shares that would otherwise be issued under equity-based awards to cover the withholding taxes due as a result of the exercise or vesting of such awards. During the fourth quarter of 2017, we withheld 36,154 shares in conjunction with the vesting and exercise of equity-based awards.
There are currently no limitations on the amount of dividends and share repurchases under the terms of our credit agreement. However, if our leverage ratio, defined as total debt less unrestricted cash to earnings before interest, taxes, depreciation and amortization (EBITDA), should exceed 2.75 to 1, there would be an annual limitation on the amount of dividends and share repurchases under the terms of this agreement.
22
The table below compares the cumulative total shareholder return on our common stock for the last five fiscal years with the cumulative total return of the S&P MidCap 400 Index and the Dow Jones U.S. Support Services (DJUSIS) Index.
Comparison of Five-Year Cumulative Total Return
Assumes Initial Investment of $100
December 2017
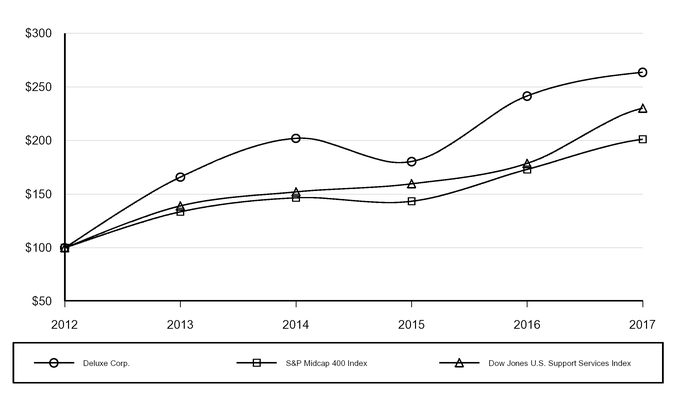
The graph assumes that $100 was invested on December 31, 2012 in each of Deluxe common stock, the S&P MidCap 400 Index and the DJUSIS Index, and that all dividends were reinvested.
23
Item 6. Selected Financial Data.
The following table shows certain selected financial data for the five years ended December 31, 2017. This information should be read in conjunction with Management's Discussion and Analysis of Financial Condition and Results of Operations appearing in Item 7 of this report and our consolidated financial statements appearing in Item 8 of this report. These items include discussion of various factors that affect the comparability of the selected financial data, including the Tax Cuts and Jobs Act of 2017, asset impairment charges and business acquisitions. Historical results are not necessarily indicative of future results.
(dollars and orders in thousands, except per share and per order amounts) |
2017 |
2016 |
2015 |
2014 |
2013 |
|||||||||||||||
Statement of Income Data: |
||||||||||||||||||||
Total revenue |
$ |
1,965,556 |
$ |
1,849,062 |
$ |
1,772,817 |
$ |
1,674,082 |
$ |
1,584,824 |
||||||||||
As a percentage of total revenue: |
||||||||||||||||||||
Gross profit |
62.2 |
% |
63.9 |
% |
63.9 |
% |
63.8 |
% |
64.6 |
% |
||||||||||
Selling, general and administrative expense |
42.2 |
% |
43.6 |
% |
43.7 |
% |
43.0 |
% |
43.6 |
% |
||||||||||
Operating income |
16.8 |
% |
19.9 |
% |
20.0 |
% |
19.9 |
% |
20.1 |
% |
||||||||||
Operating income |
$ |
331,192 |
$ |
368,727 |
$ |
354,331 |
$ |
332,633 |
$ |
317,914 |
||||||||||
Net income: |
230,155 |
229,382 |
218,629 |
199,794 |
186,652 |
|||||||||||||||
Per share - basic |
4.75 |
4.68 |
4.39 |
3.99 |
3.68 |
|||||||||||||||
Per share - diluted |
4.72 |
4.65 |
4.36 |
3.96 |
3.65 |
|||||||||||||||
Cash dividends per share |
1.20 |
1.20 |
1.20 |
1.15 |
1.00 |
|||||||||||||||
Balance Sheet Data: |
||||||||||||||||||||
Cash and cash equivalents |
$ |
59,240 |
$ |
76,574 |
$ |
62,427 |
$ |
61,541 |
$ |
121,089 |
||||||||||
Return on average assets(1)
|
10.5 |
% |
11.4 |
% |
12.4 |
% |
12.3 |
% |
12.6 |
% |
||||||||||
Total assets |
$ |
2,208,827 |
$ |
2,184,338 |
$ |
1,842,153 |
$ |
1,683,682 |
$ |
1,563,887 |
||||||||||
Long-term obligations(2)
|
709,300 |
758,648 |
629,018 |
549,603 |
635,062 |
|||||||||||||||
Statement of Cash Flows Data: |
||||||||||||||||||||
Net cash provided by operating activities |
$ |
338,431 |
$ |
319,312 |
$ |
309,631 |
$ |
285,098 |
$ |
263,729 |
||||||||||
Net cash used by investing activities |
(180,891 |
) |
(310,786 |
) |
(251,140 |
) |
(136,043 |
) |
(101,050 |
) |
||||||||||
Net cash (used) provided by financing activities |
(176,949 |
) |
4,275 |
(48,387 |
) |
(204,048 |
) |
(84,524 |
) |
|||||||||||
Purchases of capital assets |
(47,450 |
) |
(46,614 |
) |
(43,261 |
) |
(41,119 |
) |
(37,459 |
) |
||||||||||
Payments for acquisitions, net of cash acquired |
(139,223 |
) |
(270,939 |
) |
(212,990 |
) |
(105,029 |
) |
(69,709 |
) |
||||||||||
Payments for common shares repurchased |
(65,000 |
) |
(55,224 |
) |
(59,952 |
) |
(60,119 |
) |
(48,798 |
) |
||||||||||
Other Data: |
||||||||||||||||||||
Orders(3)
|
49,981 |
52,176 |
53,138 |
52,632 |
52,584 |
|||||||||||||||
Revenue per order(3)
|
$ |
39.33 |
$ |
35.44 |
$ |
33.36 |
$ |
31.81 |
$ |
30.14 |
||||||||||
Number of employees |
5,886 |
6,026 |
5,874 |
5,830 |
5,575 |
|||||||||||||||
Number of printing facilities(4)
|
11 |
12 |
11 |
11 |
12 |
|||||||||||||||
Number of call center facilities(4)
|
26 |
26 |
14 |
16 |
16 |
|||||||||||||||
(1) Return on average assets is calculated as net income divided by average assets for the period.
(2) Long-term obligations includes the current and long-term portions of our debt obligations, including capital leases. We had no short-term borrowings outstanding as of December 31 for any of the periods presented. As such, these amounts also represent our total debt obligations.
(3) Orders is our company-wide measure of volume and includes both products and services.
(4) As of December 31, 2017, we had 2 facilities that contain both printing and call center functions and thus, are included in both captions. We had 40 additional facilities which house small customer fulfillment operations and general office space. This information excludes facilities associated with businesses held for sale as of each date. Further information regarding assets held for sale can be found under the caption "Note 2: Supplemental balance sheet and cash flow information" of the Notes to Consolidated Financial Statements appearing in Item 8 of this report.
24
Item 7. Management’s Discussion and Analysis of Financial Condition and Results of Operations.
Our Management's Discussion and Analysis of Financial Condition and Results of Operations (MD&A) includes the following sections:
• |
Executive Overview that discusses what we do, our operating results at a high level and our financial outlook for the upcoming year. |
• |
Consolidated Results of Operations, Restructuring Costs and Segment Results that includes a more detailed discussion of our revenue and expenses. |
• |
Cash Flows and Liquidity, Capital Resources and Other Financial Position Information that discusses key aspects of our cash flows, capital structure and financial position. |
• |
Off-Balance Sheet Arrangements, Guarantees and Contractual Obligations that discusses our financial commitments. |
• |
Critical Accounting Policies that discusses the policies we believe are important to understanding the assumptions and judgments underlying our financial statements. |
You should note that this MD&A discussion contains forward-looking statements that involve risks and uncertainties. Please see Item 1A of this report for important information to consider when evaluating our forward-looking statements. The Private Securities Litigation Reform Act of 1995 (the Reform Act) provides a “safe harbor” for forward-looking statements to encourage companies to provide prospective information. We are filing this cautionary statement in connection with the Reform Act. When we use the words or phrases “should result,” “believe,” “intend,” “plan,” “are expected to,” “targeted,” “will continue,” “will approximate,” “is anticipated,” “estimate,” “project,” “outlook,” "forecast" or similar expressions in this Annual Report on Form 10-K, in future filings with the Securities and Exchange Commission, in our press releases, investor presentations and in oral statements made by our representatives, they indicate forward-looking statements within the meaning of the Reform Act.
EXECUTIVE OVERVIEW
We provide solutions that help our customers acquire and engage their customers across multiple channels, as well as operate their businesses efficiently and effectively. To promote and sell a wide range of products and services, we use printed and electronic marketing; a direct sales force; referrals from financial institutions, telecommunication clients and other partners; networks of Safeguard® distributors and independent dealers; and an outbound telemarketing group. Over the past 24 months, our Small Business Services segment has provided products and services to approximately 4.4 million small business customers and our Direct Checks segment has provided products and services to more than 5.1 million consumers. Through our Financial Services segment, we provide products and services to approximately 4,900 financial institution clients. We operate primarily in the United States. Small Business Services also has operations in Canada, Australia and portions of Europe.
Our product and service offerings are comprised of the following:
Checks – We remain one of the largest providers of checks in the United States. During 2017, checks represented 39% of our Small Business Services segment's revenue, 43% of our Financial Services segment's revenue and 84% of our Direct Checks segment's revenue.
Marketing solutions and other services (MOS) – We offer products and services designed to meet our customers’ sales and marketing needs, as well as various other service offerings. Our marketing products include digital printing and web-to-print solutions such as business cards, print marketing, promotional goods and apparel. Our web services offerings include logo design; hosting, domain name and web design services; search engine optimization; and marketing programs, including email, mobile and social media. We also offer fraud protection and security services, online and offline payroll services, and electronic checks ("eChecks"). Our Financial Services segment also offers a selection of financial technology ("FinTech") solutions. These solutions include data-driven marketing solutions, including outsourced marketing campaign targeting and execution; treasury management solutions, including accounts receivable processing and remote deposit capture; and digital engagement solutions, including loyalty and rewards programs. During 2017, MOS represented 34% of our Small Business Services segment's revenue, 55% of our Financial Services segment's revenue and 11% of our Direct Checks segment's revenue.
Forms – Our Small Business Services segment is a leading provider of printed forms to small businesses, including deposit tickets, billing forms, work orders, job proposals, purchase orders, invoices and personnel forms. This segment also offers computer forms compatible with accounting software packages commonly used by small businesses. Forms sold by our Financial Services and Direct Checks segments include deposit tickets and check registers.
Accessories and other products – Small Business Services offers products designed to provide small business owners with the customized documents necessary to efficiently manage their business including envelopes, office supplies, ink stamps and labels. Our Financial Services and Direct Checks segments offer checkbook covers, labels and ink stamps.
Throughout the past several years, we have focused on opportunities to increase revenue and operating income despite the continuing decline in check and forms usage. These opportunities have included new product and service offerings, brand awareness and positioning initiatives, investing in technology for our service offerings, enhancing our information technology
25
capabilities and infrastructure, improving customer segmentation, extending the reach of our sales channel, and reducing costs. In addition, we invested in various acquisitions that extend the range of products and services we offer to our customers, primarily MOS offerings. Information about our acquisitions can be found under the caption "Note 5: Acquisitions" of the Notes to Consolidated Financial Statements appearing in Item 8 of this report. During 2018, we plan to continue our focus in these areas, with an emphasis on profitable revenue growth and increasing the mix of MOS revenue, primarily data-driven marketing, treasury management and web services. We also plan to assess acquisitions that complement our large customer bases, with a focus on MOS offerings. We believe we have reached a turning point where revenue from our MOS offerings will grow at a faster rate going forward, augmented by acquisitions. MOS revenue was 40.0% of consolidated revenue in the fourth quarter of 2017. A more detailed discussion of our business strategies can be found under the caption "Business Segments" appearing in Item 1 of this report.
Earnings for 2017, as compared to 2016, increased due to price increases, a $20.5 million benefit from federal tax reform under the Tax Cuts and Jobs Act of 2017, continuing initiatives to reduce our cost structure, primarily within our sales, marketing and fulfillment organizations, and aggregate gains of $8.7 million from the sale of businesses within Small Business Services. These increases in earnings were partially offset by pre-tax asset impairment charges of $54.9 million in 2017, volume reductions for personal and business checks due primarily to the continuing decline in check and forms usage, increased incentive compensation expense and higher material and delivery rates in 2017.
Business Challenges/Market Risks
Our business, consolidated results of operations, financial condition and cash flows could be adversely affected by various risks and uncertainties. We have disclosed all known material risks in Item 1A of this report, including discussion of the declining market for checks and business forms, competition, factors affecting our financial institution clients, data security risks, risks related to acquisitions, the impact of economic conditions and the ability to attract and retain key employees. All of these factors could cause our actual results to differ materially from the statements we make from time to time regarding our expected future results, including, but not limited to, forecasts regarding estimated revenue, MOS revenue, earnings per share, cash provided by operating activities and expected cost savings.
Cost Reduction Initiatives
For several years, we have been pursuing cost reduction and business simplification initiatives, including: reducing shared services infrastructure costs; streamlining our call center and fulfillment activities; eliminating system and work stream redundancies; and strengthening our ability to quickly develop new products and services and bring them to market. We have also standardized products and services and improved the sourcing of third-party goods and services. As a result of all of these efforts, we realized net cost savings of approximately $45.0 million during 2017, as compared to our 2016 results of operations, generated primarily by our sales, marketing and fulfillment organizations. Approximately 75% of these savings impacted selling, general and administrative (SG&A) expense, with the remaining 25% affecting total cost of revenue. We anticipate that we will realize additional net cost reductions of approximately $50.0 million in 2018, as compared to our 2017 results of operations, which will also be generated primarily by our sales, marketing and fulfillment organizations. In sales and marketing, we plan to focus on sales channel optimization, platform and tool consolidation, and leveraging sales and marketing efficiencies, including integrating recent acquisitions. In fulfillment, we expect to continue our lean initiatives, reduce direct and indirect spend, drive delivery technology and process efficiencies, and continue with other supply chain improvements and efficiencies. We also expect to better leverage our information technology platform. Approximately 75% of our 2018 savings are expected to impact SG&A expense, with the remaining 25% expected to impact total cost of revenue.
Outlook for 2018
We anticipate that consolidated revenue will be between $2.065 billion and $2.105 billion for 2018, compared to $1.966 billion for 2017. In Small Business Services, we expect revenue to increase between 4% and 5% compared to 2017 revenue of $1.240 billion. Volume declines in core business products are expected to be more than offset by growth in our online, dealer and major accounts channels, price increases, increased revenue from our MOS offerings and continued tuck-in acquisitions. In Financial Services, we expect revenue to increase between 11% and 16% compared to 2017 revenue of $585.3 million. We expect increased revenue from MOS, including data-driven marketing solutions and treasury management solutions, as well as continued acquisitions. Our outlook includes incremental revenue from the acquisition of RDM Corporation in the second quarter of 2017. We expect these revenue increases to be partially offset by year-over-year secular check order declines of approximately 7%, the expected loss of about $10.0 million in Deluxe Rewards revenue primarily due to the loss of Verizon Communications Inc. as a customer, and we expect some impact from pricing pressure in our check programs. In Direct Checks, we expect revenue to decline approximately 11% compared to 2017 revenue of $140.5 million, driven primarily by secular check order volume declines resulting from reduced check usage.
We expect that 2018 diluted earnings per share will be between $5.42 and $5.67, compared to $4.72 for 2017. Our 2018 outlook includes estimated charges of $0.13 per share for integration costs, primarily related to data-driven marketing, treasury management and web services offerings. Earnings per share for 2017 included total net charges of $0.55 per share for asset impairment charges, restructuring and integration costs and transaction costs related to acquisitions, partially offset by a benefit from federal tax reform under the Tax Cuts and Jobs Act of 2017. We expect that the benefits of additional cost reduction
26
activities will be partially offset by the continuing decline in check and forms usage and continued investments in growth opportunities, particularly in talent, technology and process improvements to accelerate data-driven marketing and treasury management revenue and to drive development innovation in our treasury management infrastructure. We also expect material costs and delivery rates to increase in 2018. We estimate that our annual effective tax rate for 2018 will be approximately 25%.
We anticipate that net cash provided by operating activities will be between $360.0 million and $380.0 million in 2018, compared to $338.4 million in 2017, driven by stronger operating performance and a decrease of approximately $25.0 million in income tax payments driven primarily by the Tax Cuts and Jobs Act of 2017, partially offset by higher interest and medical payments. We anticipate contract acquisition payments of approximately $27.0 million in 2018, and we estimate that capital spending will be approximately $55.0 million in 2018 as we plan to accelerate investments in key revenue growth initiatives and order fulfillment and information technology infrastructure.
We believe that cash generated by operating activities, along with availability under our revolving credit facility, will be sufficient to support our operations in 2018, including dividend payments, capital expenditures, and required debt principal and interest payments, as well as likely acquisitions. We also believe we have access to capital markets should additional cash be necessary to fund acquisitions that exceed amounts available under our credit facility. As of December 31, 2017, $101.6 million was available for borrowing under our revolving credit facility. We expect to maintain a disciplined approach to capital deployment that focuses on our need to continue investing in initiatives to drive revenue growth, including acquisitions. We anticipate that our board of directors will maintain our current dividend level. However, dividends are approved by the board of directors on a quarterly basis, and thus are subject to change. To the extent we generate excess cash, we plan to opportunistically repurchase common shares and/or reduce the amounts outstanding under our credit facility.
As of December 31, 2017, $707.9 million was outstanding under our credit facility agreement that matures in February 2019. We plan to obtain a new multi-year credit facility to refinance the amount outstanding under the current credit facility and to satisfy those obligations. We have been successful in obtaining long-term financing with terms and in amounts adequate to meet our objectives in the past, and we expect to execute the new credit facility in the first half of 2018.
CONSOLIDATED RESULTS OF OPERATIONS
Consolidated Revenue
Change |
||||||||||||||||
(in thousands, except per order amounts) |
2017 |
2016 |
2015 |
2017 vs. 2016 |
2016 vs. 2015 |
|||||||||||
Total revenue |
$ |
1,965,556 |
$ |
1,849,062 |
$ |
1,772,817 |
6.3% |
4.3% |
||||||||
Orders |
49,981 |
52,176 |
53,138 |
(4.2%) |
(1.8%) |
|||||||||||
Revenue per order |
$ |
39.33 |
$ |
35.44 |
$ |
33.36 |
11.0% |
6.2% |
||||||||
The increase in total revenue in each of the past 2 years was driven by incremental revenue from acquired businesses of approximately $173.0 million in 2017 and $114.0 million in 2016, as well as price increases in all of our segments. Information regarding our acquisitions can be found under the caption "Note 5: Acquisitions" of the Notes to Consolidated Financial Statements appearing in Item 8 of this report. These increases in revenue were partially offset by lower order volume for both personal and business checks, as well as forms and accessories sold by Small Business Services. In addition, revenue declined due to continued pricing allowances within Financial Services.
Service revenue represented 25.2% of total revenue in 2017, 20.3% in 2016 and 18.1% in 2015. As such, the majority of our revenue is generated by product sales. We do not manage our business based on product versus service revenue. Instead, we analyze our products and services based on the following categories:
Change |
|||||||||||||
2017 |
2016 |
2015 |
2017 vs. 2016 |
2016 vs. 2015 |
|||||||||
Checks |
43.3 |
% |
46.8 |
% |
49.3 |
% |
(3.5) pt. |
(2.5) pt. |
|||||
Marketing solutions and other services |
38.4 |
% |
33.4 |
% |
30.0 |
% |
5.0 pt. |
3.4 pt. |
|||||
Forms |
10.8 |
% |
11.6 |
% |
12.2 |
% |
(0.8) pt. |
(0.6) pt. |
|||||
Accessories and other products |
7.5 |
% |
8.2 |
% |
8.5 |
% |
(0.7) pt. |
(0.3) pt. |
|||||
Total revenue |
100.0 |
% |
100.0 |
% |
100.0 |
% |
— |
— |
|||||
The number of orders decreased in each of the past 2 years driven by the impact of the continuing decline in check and forms usage, partially offset by growth in MOS, including the impact of acquisitions. Revenue per order increased in each of the
27
past 2 years primarily due to the benefit of price increases and favorable product and service mix, partially offset by the impact of continued pricing allowances in Financial Services.
Consolidated Cost of Revenue
Change |
||||||||||||||||
(in thousands) |
2017 |
2016 |
2015 |
2017 vs. 2016 |
2016 vs. 2015 |
|||||||||||
Total cost of revenue |
$ |
742,090 |
$ |
667,241 |
$ |
639,209 |
11.2% |
4.4% |
||||||||
Total cost of revenue as a percentage of total revenue |
37.8 |
% |
36.1 |
% |
36.1 |
% |
1.7 pt. |
— |
||||||||
Cost of revenue consists primarily of raw materials used to manufacture our products, shipping and handling costs, third-party costs for outsourced products and services, payroll and related expenses, information technology costs, depreciation and amortization of assets used in the production process and in support of digital service offerings, and related overhead.
The increase in total cost of revenue for 2017, as compared to 2016, was primarily attributable to the increase in revenue, including incremental costs of approximately $101.0 million for acquired businesses. In addition, delivery rates and material costs increased in 2017. Partially offsetting these increases in total cost of revenue was the impact of lower order volume for both personal and business checks, as well as forms and accessories sold by Small Business Services, and favorable product mix. In addition, total cost of revenue decreased approximately $11.0 million due to manufacturing efficiencies and other benefits resulting from our continued cost reduction initiatives.
The increase in total cost of revenue for 2016, as compared to 2015, was primarily attributable to our increase in revenue, including incremental costs of approximately $61.0 million for acquired businesses. In addition, delivery rates and material costs increased in 2016. Partially offsetting these increases in total cost of revenue was the impact of lower order volume for both personal and business checks, as well as forms and accessories sold by Small Business Services. In addition, total cost of revenue decreased approximately $15.0 million during 2016 due to manufacturing efficiencies and other benefits resulting from our continued cost reduction initiatives.
Consolidated Selling, General & Administrative Expense
Change |
||||||||||||||||
(in thousands) |
2017 |
2016 |
2015 |
2017 vs. 2016 |
2016 vs. 2015 |
|||||||||||
SG&A expense |
$ |
828,832 |
$ |
805,970 |
$ |
774,859 |
2.8% |
4.0% |
||||||||
SG&A expense as a percentage of total revenue |
42.2 |
% |
43.6 |
% |
43.7 |
% |
(1.4) pt. |
(0.1) pt. |
||||||||
The increase in SG&A expense for 2017, as compared to 2016, was driven primarily by incremental operating expenses of acquired businesses of approximately $63.0 million, as well as an increase in incentive compensation expense of approximately $5.0 million and investments in various revenue growth opportunities, including marketing investments and higher financial institution commission rates. These increases were partially offset by various expense reduction initiatives of approximately $34.0 million, primarily within our sales and marketing organizations, an $8.7 million gain from the sale of businesses within our Small Business Services segment and lower legal costs. Further information regarding the business sales can be found in the discussion of assets held for sale under the caption "Note 2: Supplemental balance sheet and cash flow information" of the Notes to Consolidated Financial Statements appearing in Item 8 of this report.
The increase in SG&A expense for 2016, as compared to 2015, was driven primarily by incremental operating expenses of $51.0 million for acquired businesses, as well as investments in various revenue growth opportunities, and an increase in medical costs of approximately $3.0 million. These increases were partially offset by various expense reduction initiatives of approximately $35.0 million, primarily within our sales and marketing organizations, as well as a decrease of approximately $6.0 million in incentive compensation expense.
Net Restructuring Charges
Change |
||||||||||||||||||||
(in thousands) |
2017 |
2016 |
2015 |
2017 vs. 2016 |
2016 vs. 2015 |
|||||||||||||||
Net restructuring charges |
$ |
8,562 |
$ |
7,124 |
$ |
4,418 |
$ |
1,438 |
$ |
2,706 |
||||||||||
We recorded restructuring charges and reversals related to the cost reduction initiatives discussed under Executive Overview. The net charges for each period primarily relate to costs of our restructuring and integration activities such as employee severance benefits, information technology costs, employee and equipment moves, training and travel. In addition to the restructuring charges shown here, restructuring charges of $0.6 million in 2017 and 2016 and $1.8 million in 2015 were
28
included within total cost of revenue in our consolidated statements of income. Further information can be found under Restructuring Costs.
Asset Impairment Charges
Change |
||||||||||||||||||||
(in thousands) |
2017 |
2016 |
2015 |
2017 vs. 2016 |
2016 vs. 2015 |
|||||||||||||||
Asset impairment charges |
$ |
54,880 |
$ |
— |
$ |
— |
$ |
54,880 |
$ |
— |
||||||||||
During the third quarter of 2017, we recorded pre-tax asset impairment charges of $46.6 million within Small Business Services related to goodwill, the discontinued NEBS trade name and other non-current assets, primarily internal-use software. Further information regarding these charges can be found under the caption "Note 7: Fair value measurements" of the Notes to Consolidated Financial Statements appearing in Item 8 of this report. Also during 2017, we recorded pre-tax asset impairment charges of $8.3 million related to a small business distributor that was sold during the second quarter of 2017. Further information regarding these charges can be found in the discussion of assets held for sale under the caption "Note 2: Supplemental balance sheet and cash flow information" of the Notes to Consolidated Financial Statements appearing in Item 8 of this report.
Loss on Early Debt Extinguishment
Change |
||||||||||||||||||||
(in thousands) |
2017 |
2016 |
2015 |
2017 vs. 2016 |
2016 vs. 2015 |
|||||||||||||||
Loss on early debt extinguishment |
$ |
— |
$ |
7,858 |
$ |
8,917 |
$ |
(7,858 |
) |
$ |
(1,059 |
) |
||||||||
During the fourth quarter of 2016, we retired all $200.0 million of our 6.0% senior notes due in November 2020, realizing a pre-tax loss of $7.9 million, consisting of a contractual call premium and the write-off of related debt issuance costs. To fund the retirement, we amended the credit agreement governing our credit facility to include a new term loan facility. Further information regarding the term loan facility can be found under the caption "Note 13: Debt and lease obligations" of the Notes to Consolidated Financial Statements appearing in Item 8 of this report.
During the first quarter of 2015, we retired all $200.0 million of our 7.0% senior notes due in March 2019, realizing a pre-tax loss of $8.9 million, consisting of a contractual call premium and the write-off of related debt issuance costs. We funded the retirement utilizing our revolving credit facility and a short-term bank loan that we repaid in December 2015.
Interest Expense
Change |
||||||||||||||||
(in thousands) |
2017 |
2016 |
2015 |
2017 vs. 2016 |
2016 vs. 2015 |
|||||||||||
Interest expense |
$ |
21,359 |
$ |
22,302 |
$ |
20,299 |
(4.2%) |
9.9% |
||||||||
Weighted-average debt outstanding |
754,289 |
620,357 |
560,070 |
21.6% |
10.8% |
|||||||||||
Weighted-average interest rate |
2.55 |
% |
2.85 |
% |
3.22 |
% |
(0.30) pt. |
(0.37) pt. |
||||||||
The decrease in interest expense for 2017, as compared to 2016, was primarily driven by our lower weighted-average interest rate in 2017 resulting from the fourth quarter 2016 retirement of long-term debt that carried a higher interest rate. In addition, 2016 included a charge to interest expense of $2.8 million resulting from the write-off of the fair value adjustment to hedged long-term debt when the debt was retired during the fourth quarter of 2016. Partially offsetting this decrease in interest expense was our higher weighted-average debt level during 2017.
The increase in interest expense for 2016, as compared to 2015, was attributable to interest expense of $2.8 million resulting from the write-off of the fair value adjustment to hedged long-term debt when the debt was retired during 2016. In addition, our weighted-average debt outstanding increased during 2016. Partially offsetting these increases in interest expense was the decrease in our weighted-average interest rate as compared to 2015, primarily driven by the March 2015 retirement of long-term debt with an interest rate of 7.0%. This debt was replaced with borrowings under our revolving credit facility, which had a weighted-average interest rate of 1.9% during 2016.
29
Income Tax Provision
Change |
||||||||||||||||
(in thousands) |
2017 |
2016 |
2015 |
2017 vs. 2016 |
2016 vs. 2015 |
|||||||||||
Income tax provision |
$ |
82,672 |
$ |
111,004 |
$ |
109,318 |
(25.5%) |
1.5% |
||||||||
Effective tax rate |
26.4 |
% |
32.6 |
% |
33.3 |
% |
(6.2) pt. |
(0.7) pt. |
||||||||
The decrease in our effective tax rate for 2017, as compared to 2016, was driven primarily by the impact of federal tax reform under the Tax Cuts and Jobs Act of 2017, which reduced income tax expense $20.5 million and reduced our effective tax rate 6.6 points. Further information regarding the impact of this legislation can be found under the caption "Note 9: Income tax provision" of the Notes to Consolidated Financial Statements appearing in Item 8 of this report. Also reducing our effective tax rate in 2017 was the impact of the asset impairment charges recorded during 2017 related to a small business distributor that was sold during the second quarter of 2017. These impairment charges reduced the book basis of the assets relative to our tax basis in the stock of the small business distributor, which increased the related deferred tax asset $1.7 million. In addition, we reversed tax reserves upon the completion of audit activity during 2017. Partially offsetting these decreases in our effective tax rate was the impact of the goodwill impairment charge in 2017, which increased our effective tax rate 1.5 points. We expect that our effective tax rate for 2018 will be approximately 25%.
The decrease in our effective tax rate for 2016, as compared to 2015, was primarily due to the tax impact of stock-based compensation, which reduced income tax expense $4.0 million for 2016 and reduced our effective tax rate 1.2 points. In addition, our effective tax rate for 2016 included the benefit of the reversal of a foreign valuation allowance of $0.5 million. Partially offsetting these decreases in our effective tax rate for 2016 was a lower production activities deduction and a higher state income tax rate in 2016, as well as a higher benefit in 2015 related to company-owned life insurance policies.
RESTRUCTURING COSTS
We have recorded expenses related to our restructuring activities, including accruals consisting primarily of employee severance benefits, as well as costs that are expensed when incurred, including information technology costs, employee and equipment moves, training and travel. Our restructuring activities are driven by our cost reduction and integration initiatives, including employee reductions in various functional areas, as well as the closing of facilities. During 2017, we closed a retail packaging sales location, a fulfillment facility and 2 administrative facilities. During 2016, we closed a printing facility, a call center, 2 warehouses and a facility housing general office space, and during 2015, we closed 2 call centers, a sales office, a warehouse, a fulfillment facility and a facility that contained both fulfillment and call center functions. Restructuring costs have been reduced by the reversal of severance accruals when fewer employees receive severance benefits than originally estimated.
Net restructuring charges for the years ended December 31 were as follows:
(dollars in thousands) |
2017 |
2016 |
2015 |
|||||||||
Severance accruals |
$ |
7,843 |
$ |
7,217 |
$ |
5,891 |
||||||
Severance reversals |
(667 |
) |
(864 |
) |
(1,197 |
) |
||||||
Operating lease obligations |
23 |
59 |
338 |
|||||||||
Net restructuring accruals |
7,199 |
6,412 |
5,032 |
|||||||||
Other costs |
1,931 |
1,359 |
1,202 |
|||||||||
Net restructuring charges |
$ |
9,130 |
$ |
7,771 |
$ |
6,234 |
||||||
Number of employees included in severance accruals |
200 |
265 |
290 |
|||||||||
The majority of the employee reductions included in our restructuring accruals are expected to be completed by mid-2018, and we expect most of the related severance payments to be paid by the third quarter of 2018, utilizing cash from operations.
As a result of our employee reductions and facility closings, we realized cost savings of approximately $2.0 million in total cost of revenue and $16.0 million in SG&A expense in 2017, in comparison to our 2016 results of operations, which represents a portion of the approximately $45.0 million of total net cost reductions we realized in 2017. In 2018, we expect to realize cost savings of approximately $2.0 million in total cost of revenue and $11.0 million in SG&A expense, in comparison to our 2017 results of operations, which represents a portion of the estimated $50.0 million of total net cost reductions we expect to realize in 2018. Expense reductions consist primarily of labor and facility costs. Information about the other initiatives driving our cost savings can be found in Executive Overview.
30
Further information regarding our restructuring charges can be found under the caption “Note 8: Restructuring charges” of the Notes to Consolidated Financial Statements appearing in Item 8 of this report.
SEGMENT RESULTS
Additional financial information regarding our business segments appears under the caption “Note 16: Business segment information” of the Notes to Consolidated Financial Statements appearing in Item 8 of this report.
Small Business Services
This segment's products and services are promoted through direct response mail and internet advertising; referrals from financial institutions, telecommunications clients and other partners; networks of Safeguard distributors and independent dealers; a direct sales force that focuses on selling to and through major accounts; and an outbound telemarketing group. Results for this segment were as follows:
Change |
||||||||||||||||
(in thousands) |
2017 |
2016 |
2015 |
2017 vs. 2016 |
2016 vs. 2015 |
|||||||||||
Total revenue |
$ |
1,239,739 |
$ |
1,195,743 |
$ |
1,151,916 |
3.7% |
3.8% |
||||||||
Operating income |
182,807 |
208,789 |
203,933 |
(12.4%) |
2.4% |
|||||||||||
Operating margin |
14.7 |
% |
17.5 |
% |
17.7 |
% |
(2.8) pt. |
(0.2) pt. |
||||||||
The increase in total revenue for 2017, as compared to 2016, was driven by incremental revenue from acquired businesses of approximately $56.0 million, as well as the benefit of price increases. Information about our acquisitions can be found under the caption “Note 5: Acquisitions” of the Notes to Consolidated Financial Statements appearing in Item 8 of this report. These increases in revenue were partially offset by lower order volume, primarily related to checks, forms and accessories, as check and forms usage continues to decline, as well as the strategic decision to eliminate low margin business.
The decrease in operating income and operating margin for 2017, as compared to 2016, was primarily due to pre-tax asset impairment charges of $54.9 million related to goodwill, the discontinued NEBS trade name, a small business distributor that was sold during the second quarter of 2017, and other non-current assets, primarily internal-use software. These charges reduced operating margin 4.4 points for 2017. Further information regarding these charges can be found under the caption "Note 7: Fair value measurements" of the Notes to Consolidated Financial Statements appearing in Item 8 of this report. In addition, operating income was impacted by lower order volume for checks, forms and accessories; investments in various revenue growth opportunities, including marketing investments and higher financial institution commission rates; higher incentive compensation expense; and increased material and delivery rates. Partially offsetting these decreases in operating income were price increases and benefits of our cost reduction initiatives, as well as gains of $8.7 million from the sale of businesses in 2017. Further information regarding the business sales can be found in the discussion of assets held for sale under the caption "Note 2: Supplemental balance sheet and cash flow information" of the Notes to Consolidated Financial Statements appearing in Item 8 of this report. The results of acquired businesses resulted in a slight increase in operating income for 2017, including acquisition-related amortization, but resulted in a 0.9 point decrease in operating margin for 2017.
The increase in total revenue for 2016, as compared to 2015, was driven by incremental revenue of approximately $75.0 million from acquired businesses, as well as the benefit of price increases. Further information about our acquisitions can be found under the caption “Note 5: Acquisitions” of the Notes to Consolidated Financial Statements appearing in Item 8 of this report. These increases in revenue were partially offset by lower order volume, primarily related to business checks, forms and accessories, as check and forms usage continues to decline. In addition, revenue declined due to an unfavorable currency exchange rate impact of approximately $3.0 million.
The increase in operating income for 2016, as compared to 2015, was primarily due to price increases, benefits of our cost reduction initiatives and lower incentive compensation expense. Partially offsetting these increases in operating income were increased delivery rates and material costs in 2016, higher medical costs and an increase in commission expense of approximately $2.0 million due primarily to increased financial institution commission rates. While the impact of acquired businesses was slightly positive to operating income for 2016, operating margin decreased 1.1 points for 2016 due to acquired businesses.
31
Financial Services
Financial Services' products and services are sold primarily through a direct sales force, which executes product and service supply contracts with our financial institution clients, including banks, credit unions and financial services companies. Results for this segment were as follows:
Change |
||||||||||||||||
(in thousands) |
2017 |
2016 |
2015 |
2017 vs. 2016 |
2016 vs. 2015 |
|||||||||||
Total revenue |
$ |
585,275 |
$ |
499,976 |
$ |
455,390 |
17.1% |
9.8% |
||||||||
Operating income |
101,644 |
106,820 |
91,539 |
(4.8%) |
16.7% |
|||||||||||
Operating margin |
17.4 |
% |
21.4 |
% |
20.1 |
% |
(4.0) pt. |
1.3 pt. |
||||||||
The increase in revenue for 2017, as compared to 2016, was driven by growth in MOS revenue of approximately $106.0 million, primarily from incremental revenue from acquired businesses of approximately $117.0 million. The increase from acquisitions was partially offset by a decrease in Deluxe Rewards revenue of approximately $9.0 million driven primarily by pricing adjustments and the loss of Verizon Communications Inc. as a customer. Further information about our acquisitions can be found under the caption “Note 5: Acquisitions” of the Notes to Consolidated Financial Statements appearing in Item 8 of this report. In addition, revenue benefited from price increases. Partially offsetting these revenue increases was lower check order volume due to the continued decline in check usage, as well as the impact of continued pricing allowances.
The decrease in operating income and operating margin for 2017, as compared to 2016, was primarily due to the impact of lower check order volume; continued pricing allowances; higher incentive compensation expense; increased delivery and material rates; and the decline in Deluxe Rewards revenue. Partially offsetting these decreases in operating income were price increases and the benefit of our continuing cost reduction initiatives. While acquired businesses contributed approximately $7.0 million to operating income in 2017, including acquisition-related amortization, operating margin decreased 3.0 points for 2017 due to acquired businesses.
The increase in revenue for 2016, as compared to 2015, was driven by growth in MOS revenue of approximately $48.0 million for 2016, including incremental revenue from acquired businesses of approximately $39.0 million, as well as growth of approximately $8.0 million in revenue from treasury management solutions. Further information about our acquisitions can be found under the caption “Note 5: Acquisitions” of the Notes to Consolidated Financial Statements appearing in Item 8 of this report. In addition, revenue benefited from previous price increases. Partially offsetting these revenue increases was lower check order volume due to the continued decline in check usage, as well as the impact of continued pricing allowances.
The increase in operating income and operating margin for 2016, as compared to 2015, was primarily due to previous price increases, the benefit of our continuing cost reduction initiatives, compensation expense in 2015 of approximately $4.0 million for an earn-out agreement related to a 2013 acquisition and lower incentive compensation expense. Partially offsetting these increases in operating income was the impact of lower check order volume, continued pricing allowances, investments in revenue growth opportunities and increased delivery, material and medical costs in 2016. Additionally, transaction costs related to acquisitions increased approximately $3.0 million in 2016 due to costs associated with the acquisition of FMCG in December 2016, and restructuring costs increased approximately $1.0 million. Further information regarding restructuring costs can be found under Restructuring Costs. While the impact of acquired businesses was slightly positive to operating income for 2016, including acquisition-related amortization, operating margin decreased 1.5 points for 2016 due to acquired businesses.
Direct Checks
Direct Checks sells products and services directly to consumers using direct marketing, including print advertising and search engine marketing and optimization strategies. Direct Checks sells under various brand names, including Checks Unlimited®, Designer Checks®, Checks.com®, Check Gallery®, The Styles Check Company®, and Artistic Checks®, among others. Results for this segment were as follows:
Change |
||||||||||||||||
(in thousands) |
2017 |
2016 |
2015 |
2017 vs. 2016 |
2016 vs. 2015 |
|||||||||||
Total revenue |
$ |
140,542 |
$ |
153,343 |
$ |
165,511 |
(8.3%) |
(7.4%) |
||||||||
Operating income |
46,741 |
53,118 |
58,859 |
(12.0%) |
(9.8%) |
|||||||||||
Operating margin |
33.3 |
% |
34.6 |
% |
35.6 |
% |
(1.3) pt. |
(1.0) pt. |
||||||||
The decrease in revenue for 2017, as compared to 2016, was primarily due to a reduction in orders stemming from the continued decline in check usage. Partially offsetting the volume decline was higher revenue per order, driven by price increases and various sales initiatives.
32
The decrease in operating income and operating margin for 2017, as compared to 2016, was due primarily to lower order volume and increased delivery and material costs in 2017. These decreases in operating income were partially offset by benefits from our cost reduction initiatives, including lower advertising expense driven by changes in circulation intended to maximize response rates, and higher revenue per order.
The decrease in revenue for 2016, as compared to 2015, was primarily due to a reduction in orders stemming from the continued decline in check usage. Partially offsetting the volume decline was higher revenue per order, primarily driven by an improved call center incentive plan.
The decrease in operating income and operating margin for 2016, as compared to 2015, was due primarily to lower order volume and increased delivery rates and material costs in 2016. These decreases in operating income were partially offset by benefits from our cost reduction initiatives, including lower advertising expense, as well as higher revenue per order.
CASH FLOWS AND LIQUIDITY
As of December 31, 2017, we held cash and cash equivalents of $59.2 million. The following table shows our cash flow activity for the last 3 years, and should be read in conjunction with the consolidated statements of cash flows appearing in Item 8 of this report.
Change |
||||||||||||||||||||
(in thousands) |
2017 |
2016 |
2015 |
2017 vs. 2016 |
2016 vs. 2015 |
|||||||||||||||
Net cash provided by operating activities |
$ |
338,431 |
$ |
319,312 |
$ |
309,631 |
$ |
19,119 |
$ |
9,681 |
||||||||||
Net cash used by investing activities |
(180,891 |
) |
(310,786 |
) |
(251,140 |
) |
129,895 |
(59,646 |
) |
|||||||||||
Net cash (used) provided by financing activities |
(176,949 |
) |
4,275 |
(48,387 |
) |
(181,224 |
) |
52,662 |
||||||||||||
Effect of exchange rate change on cash |
2,075 |
1,346 |
(9,218 |
) |
729 |
10,564 |
||||||||||||||
Net change in cash and cash equivalents |
$ |
(17,334 |
) |
$ |
14,147 |
$ |
886 |
$ |
(31,481 |
) |
$ |
13,261 |
||||||||
The $19.1 million increase in net cash provided by operating activities for 2017, as compared to 2016, was primarily due to cash generated by operations, an $11.6 million decrease in payments for incentive compensation and the payment in 2016 of an incentive related to a 2013 acquisition. These increases in net cash provided by operating activities were partially offset by a $27.6 million increase in income tax payments, as well as higher contract acquisition payments.
The $9.7 million increase in net cash provided by operating activities for 2016, as compared to 2015, was primarily due to stronger operating performance and a $13.7 million decrease in income tax payments. These increases in net cash provided by operating activities were partially offset by a $10.3 million increase in contract acquisition payments, a $7.5 million increase in medical benefit payments and the payment in 2016 of a $5.4 million incentive related to a 2013 acquisition. The increase in medical benefit payments was due to increased medical costs in 2016, as well as the use in 2015 of the remaining assets of the trust we used to fund medical benefits, which was discontinued effective December 31, 2015.
33
Included in net cash provided by operating activities were the following operating cash outflows:
Change |
||||||||||||||||||||
(in thousands) |
2017 |
2016 |
2015 |
2017 vs. 2016 |
2016 vs. 2015 |
|||||||||||||||
Income tax payments |
$ |
124,878 |
$ |
97,309 |
$ |
110,999 |
$ |
27,569 |
$ |
(13,690 |
) |
|||||||||
Medical benefit payments(1)
|
38,806 |
35,217 |
27,764 |
3,589 |
7,453 |
|||||||||||||||
Contract acquisition payments |
27,079 |
23,068 |
12,806 |
4,011 |
10,262 |
|||||||||||||||
Incentive compensation payments(2)
|
21,174 |
32,792 |
31,046 |
(11,618 |
) |
1,746 |
||||||||||||||
Interest payments |
19,465 |
20,975 |
24,286 |
(1,510 |
) |
(3,311 |
) |
|||||||||||||
Severance payments |
6,981 |
5,938 |
5,172 |
1,043 |
766 |
|||||||||||||||
Incentive payment related to previous acquisition |
— |
5,434 |
— |
(5,434 |
) |
5,434 |
||||||||||||||
(1) For 2015, this amount represents payments made to fund our voluntary employee beneficiary association (VEBA) trust used to pay medical benefits, as well as retiree medical benefits paid from company funds. The VEBA trust was discontinued effective December 31, 2015. For 2017 and 2016, this amount represents cash payments made directly to medical service providers for employee medical benefits, as well as retiree medical benefits paid from company funds.
(2) Amounts reflect payments based on company performance.
Net cash used by investing activities in 2017 was $129.9 million lower than in 2016, driven primarily by a decrease in payments for acquisitions of $131.7 million. In 2017, we made aggregate payments for acquisitions of $139.2 million, net of cash acquired, compared to aggregate payments for acquisitions of $270.9 million in 2016, net of cash acquired. Information regarding our acquisitions can be found under the caption “Note 5: Acquisitions” of the Notes to Consolidated Financial Statements appearing in the Item 8 of this report.
Net cash used by investing activities in 2016 was $59.6 million higher than in 2015, driven primarily by an increase in payments for acquisitions of $57.9 million. In 2016, we made aggregate payments for acquisitions of $270.9 million, net of cash acquired, compared to aggregate payments for acquisitions of $213.0 million in 2015, net of cash acquired. Information regarding our acquisitions can be found under the caption “Note 5: Acquisitions” of the Notes to Consolidated Financial Statements appearing in the Item 8 of this report.
Net cash used by financing activities in 2017 was $181.2 million higher than in 2016, due primarily to a net increase in payments on long-term debt of $168.0 million, a $9.8 million increase in share repurchases and a $3.8 million increase in employee taxes paid for shares withheld related to stock-based compensation activity.
Net cash provided by financing activities in 2016 was $52.7 million higher than in 2015, due primarily to an increase in net borrowings of $50.9 million, which were used primarily for acquisitions and share repurchases. In addition, payments for share repurchases were $4.7 million less in 2016.
Significant cash transactions, excluding those related to operating activities, for each period were as follows:
Change |
||||||||||||||||||||
(in thousands) |
2017 |
2016 |
2015 |
2017 vs. 2016 |
2016 vs. 2015 |
|||||||||||||||
Payments for acquisitions, net of cash acquired |
$ |
(139,223 |
) |
$ |
(270,939 |
) |
$ |
(212,990 |
) |
$ |
131,716 |
$ |
(57,949 |
) |
||||||
Payments for common shares repurchased |
(65,000 |
) |
(55,224 |
) |
(59,952 |
) |
(9,776 |
) |
4,728 |
|||||||||||
Cash dividends paid to shareholders |
(58,098 |
) |
(58,720 |
) |
(59,755 |
) |
622 |
1,035 |
||||||||||||
Net change in debt |
(51,165 |
) |
116,811 |
65,938 |
(167,976 |
) |
50,873 |
|||||||||||||
Purchases of capital assets |
(47,450 |
) |
(46,614 |
) |
(43,261 |
) |
(836 |
) |
(3,353 |
) |
||||||||||
Proceeds from issuing shares under employee plans |
9,033 |
9,114 |
5,895 |
(81 |
) |
3,219 |
||||||||||||||
We anticipate that net cash provided by operating activities will be between $360.0 million and $380.0 million in 2018, compared to $338.4 million in 2017, driven by stronger operating performance and a decrease in income tax payments of approximately $25.0 million driven primarily by the Tax Cuts and Jobs Act of 2017, partially offset by higher interest and medical payments. We anticipate that net cash generated by operating activities in 2018, along with availability under our revolving credit facility, will be utilized for dividend payments, capital expenditures of approximately $55.0 million, and required debt principal and interest payments, as well as likely acquisitions. We intend to focus our capital spending on key revenue growth initiatives and investments in order fulfillment and information technology infrastructure. As of December 31, 2017, $101.6 million was available for borrowing under our revolving credit facility. To the extent we generate excess cash, we plan to opportunistically repurchase common shares and/or reduce the amount outstanding under our credit facility agreement.
34
As of December 31, 2017, we intend to indefinitely reinvest the undistributed earnings of our subsidiaries located outside of the United States and, therefore, no deferred income taxes have been recognized for the tax effects of repatriation. After enactment of the Tax Cuts and Jobs Act of 2017, the tax effects would generally be limited to foreign withholding taxes on any distributions. As of December 31, 2017, the amount of cash and cash equivalents held by our foreign subsidiaries was $40.0 million, primarily in Canada. If we were to repatriate all of our foreign cash and cash equivalents into the United States at one time, we would incur a tax liability of approximately $2.0 million, based on current tax laws.
We believe that cash generated by operating activities, along with availability under our revolving credit facility, will be sufficient to support our operations in 2018, including dividend payments, capital expenditures, required debt principal and interest payments, and periodic share repurchases, as well as likely acquisitions. We also believe we have access to capital markets should additional cash be necessary to fund acquisitions that exceed amounts available under our credit facility. As of December 31, 2017, $707.9 million was outstanding under our credit facility agreement that matures in February 2019. We plan to obtain a new multi-year credit facility to refinance amounts outstanding under the current credit facility and to satisfy those obligations. We have been successful in obtaining long-term financing with terms and in amounts adequate to meet our objectives in the past, and we expect to execute the new credit facility in the first half of 2018.
CAPITAL RESOURCES
Our total debt was $709.3 million as of December 31, 2017, a decrease of $49.3 million from December 31, 2016. Further information concerning our outstanding debt can be found under the caption "Note 13: Debt and lease obligations” of the Notes to Consolidated Financial Statements appearing in Item 8 of this report. Information regarding our debt service obligations can be found under Off-Balance Sheet Arrangements, Guarantees and Contractual Obligations.
Our capital structure for each period was as follows:
December 31, 2017 |
December 31, 2016 |
|||||||||||||||||
(in thousands) |
Amount |
Weighted-
average interest rate
|
Amount |
Weighted-
average interest rate
|
Change |
|||||||||||||
Fixed interest rate |
$ |
1,914 |
2.0 |
% |
$ |
1,685 |
2.0 |
% |
$ |
229 |
||||||||
Floating interest rate |
707,386 |
3.0 |
% |
756,963 |
2.2 |
% |
(49,577 |
) |
||||||||||
Total debt |
709,300 |
3.0 |
% |
758,648 |
2.2 |
% |
(49,348 |
) |
||||||||||
Shareholders’ equity |
1,015,013 |
880,970 |
134,043 |
|||||||||||||||
Total capital |
$ |
1,724,313 |
$ |
1,639,618 |
$ |
84,695 |
||||||||||||
During 2017, we repurchased a total of 0.9 million shares of our common stock for $65.0 million. We had an outstanding authorization from our board of directors to purchase up to 10 million shares of our common stock. We completed the purchase of all of the remaining shares under this authorization during the first quarter of 2017. In May 2016, our board of directors approved an additional authorization for the repurchase of up to $300.0 million of our common stock, effective at the conclusion of our previous authorization. This additional authorization has no expiration date and $239.7 million remained available for purchase under this authorization as of December 31, 2017. Information regarding changes in shareholders' equity can be found in the consolidated statements of shareholders' equity appearing in Item 8 of this report.
As of December 31, 2017, we had a $525.0 million revolving credit facility that matures in February 2019. Our quarterly commitment fee ranges from 0.20% to 0.40% based on our leverage ratio. During 2016, we amended the credit agreement governing our credit facility to include a variable rate term loan facility in the aggregate amount of $330.0 million. We borrowed the full amount during the fourth quarter of 2016, using the proceeds to retire our senior notes due in 2020 and to partially fund the acquisition of FMCG in December 2016. The term loan facility matures in February 2019 and requires periodic principal payments throughout the term of the loan. Interest is paid weekly and we may prepay the term loan facility in full or in part at our discretion. Amounts repaid may not be reborrowed.
Borrowings under the credit facility agreement are collateralized by substantially all of our personal and intangible property. The credit agreement governing the credit facility contains customary covenants regarding limits on levels of subsidiary indebtedness and capital expenditures, liens, investments, acquisitions, certain mergers, certain asset sales outside the ordinary course of business, and change in control as defined in the agreement. The agreement also contains financial covenants regarding our leverage ratio, interest coverage and liquidity. We were in compliance with all debt covenants as of December 31, 2017, and we expect to remain in compliance with these debt covenants throughout 2018. Our credit facility matures in February 2019. We plan to obtain a new multi-year credit facility to refinance amounts outstanding under the current credit facility and to satisfy those obligations. We have been successful in obtaining long-term financing with terms and in amounts adequate to meet our objectives in the past, and we expect to execute the new credit facility in the first half of 2018.
35
As of December 31, 2017, amounts were available for borrowing under our revolving credit facility as follows:
(in thousands) |
Total available |
||
Revolving credit facility commitment |
$ |
525,000 |
|
Amount drawn on revolving credit facility |
(413,000 |
) |
|
Outstanding letters of credit(1)
|
(10,361 |
) |
|
Net available for borrowing as of December 31, 2017 |
$ |
101,639 |
|
(1) We use standby letters of credit primarily to collateralize certain obligations related to our self-insured workers' compensation claims, as well as claims for environmental matters, as required by certain states. These letters of credit reduce the amount available for borrowing under our revolving credit facility.
OTHER FINANCIAL POSITION INFORMATION
Information concerning items comprising selected captions on our consolidated balance sheets can be found under the caption "Note 2: Supplemental balance sheet and cash flow information" of the Notes to Consolidated Financial Statements appearing in Item 8 of this report.
Acquisitions – The impact of acquisitions on our consolidated balance sheets can be found under the caption "Note 5: Acquisitions" of the Notes to Consolidated Financial Statements appearing in Item 8 of this report.
Contract acquisition costs – Other non-current assets include contract acquisition costs of our Financial Services segment. These costs, which are essentially pre-paid product discounts, are recorded as non-current assets upon contract execution and are amortized, generally on the straight-line basis, as reductions of revenue over the related contract term. Changes in contract acquisition costs during the past 3 years can be found under the caption "Note 2: Supplemental balance sheet and cash flow information" of the Notes to Consolidated Financial Statements appearing in Item 8 of this report. Cash payments made for contract acquisition costs were $27.1 million for 2017, $23.1 million for 2016 and $12.8 million for 2015. We anticipate cash payments of approximately $27.0 million in 2018.
The number of checks being written has been declining, which has contributed to increased competitive pressure when attempting to retain or acquire clients. Both the number of financial institution clients requesting contract acquisition payments and the amount of the payments has fluctuated from year to year. Although we anticipate that we will selectively continue to make contract acquisition payments, we cannot quantify future amounts with certainty. The amount paid depends on numerous factors, including the number and timing of contract executions and renewals, competitors’ actions, overall product discount levels and the structure of up-front product discount payments versus providing higher discount levels throughout the term of the contract.
Liabilities for contract acquisition payments are recorded upon contract execution. These obligations are monitored for each contract and are adjusted as payments are made. Contract acquisition payments due within the next year are included in accrued liabilities in our consolidated balance sheets. These accruals were $11.7 million as of December 31, 2017 and $12.4 million as of December 31, 2016. Accruals for contract acquisition payments included in other non-current liabilities in our consolidated balance sheets were $21.7 million as of December 31, 2017 and $29.9 million as of December 31, 2016.
Deferred income taxes – Net deferred tax liabilities of $49.1 million as of December 31, 2017, decreased $34.5 million from December 31, 2016. In addition to the changes attributable to the calculation of temporary differences between the financial reporting basis of assets and liabilities and their respective tax reporting bases, the carrying amount of deferred income taxes was affected by the Tax Cuts and Jobs Act, which was enacted in December 2017. This legislation permanently lowered the federal statutory tax rate from 35% to 21%. As such, we were required to remeasure our deferred income taxes at the new tax rate. This remeasurement resulted in a decrease in our net deferred tax liabilities of approximately $26.0 million.
OFF-BALANCE SHEET ARRANGEMENTS, GUARANTEES AND CONTRACTUAL OBLIGATIONS
It is not our general business practice to enter into off-balance sheet arrangements or to guarantee the performance of third parties. In the normal course of business we periodically enter into agreements that incorporate general indemnification language. These indemnifications encompass third-party claims arising from our products and services, including, without limitation, service failures, breach of security, intellectual property rights, governmental regulations and/or employment-related matters. Performance under these indemnities would generally be triggered by our breach of the terms of the contract. In disposing of assets or businesses, we often provide representations, warranties and/or indemnities to cover various risks, including, for example, unknown damage to the assets, environmental risks involved in the sale of real estate, liability to investigate and remediate environmental contamination at waste disposal sites and manufacturing facilities, and unidentified tax liabilities and legal fees related to periods prior to disposition. We do not have the ability to estimate the potential liability from such indemnities because they relate to unknown conditions. However, we do not believe that any liability under these indemnities would have a material adverse effect on our financial position, annual results of operations or annual cash flows. We
36
have recorded liabilities for known indemnifications related to environmental matters. Further information regarding our environmental liabilities, as well as liabilities related to self-insurance and litigation, can be found under the caption “Note 14: Other commitments and contingencies” of the Notes to Consolidated Financial Statements appearing in the Item 8 of this report.
We are not engaged in any transactions, arrangements or other relationships with unconsolidated entities or other third parties that are reasonably likely to have a material effect on our liquidity or on our access to, or requirements for, capital resources. We have not established any special purpose entities nor have we entered into any material related party transactions during the past 3 years.
As of December 31, 2017, our contractual obligations were as follows:
(in thousands) |
Total |
2018 |
2019 and 2020 |
2021 and 2022 |
2023 and thereafter |
|||||||||||||||
Long-term debt |
$ |
707,938 |
$ |
43,313 |
$ |
664,625 |
$ |
— |
$ |
— |
||||||||||
Lease obligations |
32,956 |
11,620 |
16,093 |
3,504 |
1,739 |
|||||||||||||||
Purchase obligations |
53,911 |
30,247 |
20,712 |
2,952 |
— |
|||||||||||||||
Other non-current liabilities(1)
|
73,856 |
40,343 |
24,160 |
6,711 |
2,642 |
|||||||||||||||
Total contractual obligations |
$ |
868,661 |
$ |
125,523 |
$ |
725,590 |
$ |
13,167 |
$ |
4,381 |
||||||||||
(1) Includes interest of $1.4 million related primarily to accrued contingent consideration which is recorded in the consolidated balance sheets at estimated fair value. This interest will be accrued in future periods as accretion expense.
Purchase obligations include amounts due under contracts with third-party service providers. These contracts are primarily for information technology services and Direct Checks direct mail advertising agreements. We routinely issue purchase orders to numerous vendors for the purchase of inventory and other supplies. These purchase orders are not included in the purchase obligations presented here, as our business partners typically allow us to cancel these purchase orders as necessary to accommodate business needs. Of the purchase obligations included in the table above, $13.5 million allow for early termination upon the payment of early termination fees. If we were to terminate these agreements, we would have incurred early termination fees of $13.6 million as of December 31, 2017.
Of the $52.2 million reported as other non-current liabilities in our consolidated balance sheet as of December 31, 2017, $20.1 million is excluded from the obligations shown in the table above. The excluded amounts, including the current portion of each liability, are comprised primarily of the following:
• |
Payments for uncertain tax positions – Due to the nature of the underlying liabilities and the extended time frame often needed to resolve income tax uncertainties, we cannot make reliable estimates of the amount or timing of cash payments that may be required to settle these liabilities. Our liability for uncertain tax positions, including accrued interest and penalties, was $4.8 million as of December 31, 2017, excluding tax benefits of deductible interest and the federal benefit of deductible state income tax.
|
• |
A portion of the amount due under our deferred compensation plan – Under this plan, some employees may begin receiving payments upon the termination of employment or disability, and we cannot predict when these events will occur. As such, $3.4 million of our deferred compensation liability as of December 31, 2017 is excluded from the obligations shown in the table above.
|
• |
Other non-current liabilities which are not settled in cash, such as deferred revenue and incentive compensation that will be settled by issuing shares of our common stock. |
The table of contractual obligations does not include the following:
• |
Benefit payments for our postretirement benefit plan – We have the option of paying benefits from the accumulated assets of the plan or from the general funds of the company. Additionally, we expect the plan assets to earn income over time. As such, we cannot predict when or if payments from our general funds will be required. We anticipate that we will utilize plan assets to pay a majority of our benefits during 2018. Our postretirement benefit plan was overfunded $39.8 million as of December 31, 2017.
|
• |
Income tax payments, which are dependent upon our taxable income. |
CRITICAL ACCOUNTING POLICIES
Our critical accounting policies are those that are most important to the portrayal of our financial condition and results of operations, or which place the most significant demands on management's judgment about the effect of matters that are inherently uncertain, and the impact of different estimates or assumptions could be material to our financial condition or results of operations.
37
Management's discussion and analysis of our financial condition and results of operations is based upon our consolidated financial statements, which have been prepared in accordance with generally accepted accounting principles (GAAP) in the United States. Our accounting policies are discussed under the caption “Note 1: Significant accounting policies” of the Notes to Consolidated Financial Statements appearing in Item 8 of this report. We review the accounting policies used in reporting our financial results on a regular basis. The preparation of our financial statements requires us to make estimates and judgments that affect the reported amounts of assets, liabilities, revenues and expenses and the related disclosure of contingent assets and liabilities. We base our estimates on historical experience and on various other factors and assumptions that we believe are reasonable under the circumstances, the result of which forms the basis for making judgments about the carrying values of assets and liabilities. In some instances, we reasonably could have used different accounting estimates and, in other instances, changes in the accounting estimates are reasonably likely to occur from period to period. Accordingly, actual results may differ from our estimates. Significant estimates and judgments utilized are reviewed by management on an ongoing basis and by the audit committee of our board of directors at the end of each quarter prior to the public release of our financial results.
Income Taxes
When preparing our consolidated financial statements, we are required to estimate our income taxes in each of the jurisdictions in which we operate. This process involves estimating our actual current tax expense based on expected taxable income, statutory tax rates, tax credits allowed in the various jurisdictions in which we operate, and risks associated with uncertain tax positions, together with assessing temporary and permanent differences resulting from the differing treatment of certain items between income tax return and financial reporting requirements. In interim reporting periods, we use an estimate of our annual effective tax rate based on the facts available at the time. Changes in the jurisdictional mix or the estimated amount of annual pre-tax income could impact our estimated effective tax rate in interim periods. The actual effective income tax rate is calculated at the end of the year.
We recognize deferred tax assets and liabilities for temporary differences using the enacted tax rates and laws that will be in effect when we expect the temporary differences to reverse. We must assess the likelihood that our deferred tax assets will be realized through future taxable income, and to the extent we believe that realization is not likely, we must establish a valuation allowance against those deferred tax assets. Significant judgment is required in evaluating our tax positions, and in determining our provision for income taxes, our deferred tax assets and liabilities and any valuation allowance recorded against our net deferred tax assets. We had net deferred tax liabilities of $49.1 million as of December 31, 2017, including valuation allowances of $1.5 million. The valuation allowances related primarily to capital loss carryforwards in Canada and net operating loss carryforwards in various state jurisdictions that we do not currently expect to fully realize.
We are subject to tax audits in numerous domestic and foreign tax jurisdictions. Tax audits are often complex and can require several years to complete. In the normal course of business, we are subject to challenges from the Internal Revenue Service (IRS) and other tax authorities regarding the amount of taxes due. These challenges may alter the timing or amount of taxable income or deductions, or the allocation of income among tax jurisdictions. We recognize the benefits of tax return positions in the financial statements when they are more-likely-than-not to be sustained by the taxing authorities based solely on the technical merits of the position. If the recognition threshold is met, the tax benefit is measured and recognized as the largest amount of tax benefit that, in our judgment, is greater than 50% likely to be realized. As of December 31, 2017, our liability for uncertain tax positions, including accrued interest and penalties, was $4.8 million, excluding tax benefits of deductible interest and the federal benefit of deductible state income tax. Further information regarding our unrecognized tax benefits can be found under the caption “Note 9: Income tax provision” of the Notes to Consolidated Financial Statements appearing in Item 8 of this report. The ultimate outcome of tax matters may differ from our estimates and assumptions. Unfavorable settlement of any particular issue would require the use of cash and could result in increased income tax expense. Favorable resolution would result in reduced income tax expense.
On December 22, 2017, United States tax reform was signed into law as the Tax Cuts and Jobs Act (the 2017 Act). This legislation included a broad range of tax reforms, including changes to corporate tax rates, business deductions and international tax provisions. The tax effects of changes in tax laws or rates must be recognized in the period in which the law is enacted. As such, this legislation resulted in a net benefit of approximately $20.5 million to our 2017 income tax provision. This amount included the net tax benefit from the remeasurement of deferred income taxes to the new federal statutory tax rate of 21%, which is effective for us on January 1, 2018, and revised state income tax rates for those states we expect to follow the provisions of the 2017 Act, partially offset by the establishment of a liability for toll charges related to undistributed foreign earnings and profits.
Reasonable estimates were used in determining many components of the impact of the 2017 Act, including our 2017 deferred activity and the amount of post-1986 foreign deferred earnings subject to the toll charge. We are still analyzing certain aspects of the 2017 Act and refining our calculations, which could potentially affect the measurement of our deferred tax balances and the amount of the toll charge liability, and ultimately cause us to revise our initial estimates in future periods. In addition, changes in interpretations, assumptions and guidance regarding the new tax legislation, as well as the potential for technical corrections to the 2017 Act, could have a material impact on our effective tax rate in future periods.
38
In order to complete our accounting for the 2017 Act, which we expect to finalize by the fourth quarter of 2018, the following specific items need to be completed or addressed:
• |
Issuance of state-by-state guidance regarding conformity with or decoupling from the 2017 Act. |
• |
Finalize the calculation of post-1986 foreign deferred earnings, which are subject to the toll charge, and determine our ability to beneficially claim a foreign tax credit resulting from the income inclusion. |
• |
Where pertinent, adjust to clarifications and guidance regarding other aspects of the 2017 Act, including those related to executive compensation. |
As of December 31, 2017, we intend to indefinitely reinvest the undistributed earnings of our subsidiaries located outside of the United States and, therefore, no deferred income taxes have been recognized for the tax effects of repatriation. After enactment of the 2017 Act, the tax effects would generally be limited to foreign withholding taxes on any distributions. As of December 31, 2017, the amount of cash and cash equivalents held by our foreign subsidiaries was $40.0 million, primarily in Canada. If we were to repatriate all of our foreign cash and cash equivalents into the United States at one time, we would incur a tax liability of approximately $2.0 million, based on current tax laws.
A one-percentage-point change in our effective income tax rate would have resulted in a $3.1 million change in income tax expense for 2017. The determination of our provision for income taxes, deferred income taxes and unrecognized tax positions requires significant judgment, the use of estimates, and the interpretation and application of complex tax laws. As such, the amounts reflected in our consolidated financial statements may require adjustment in the future as additional facts become known or circumstances change. If actual results differ from estimated amounts, our effective income tax rate and related tax balances would be affected.
Business Combinations
We allocate the purchase price of acquired businesses to the estimated fair values of the assets acquired and liabilities assumed as of the date of the acquisition. The calculations used to determine the fair value of the long-lived assets acquired, primarily intangible assets, can be complex and require significant judgment. We weigh many factors when completing these estimates including, but not limited to, the nature of the acquired company’s business; its competitive position, strengths, and challenges; its historical financial position and performance; estimated customer retention rates; discount rates; and future plans for the combined entity. We may also engage independent valuation specialists, when necessary, to assist in the fair value calculations for significant acquired long-lived assets.
We generally estimate the fair value of acquired customer lists using the multi-period excess earnings method. This valuation model estimates revenues and cash flows derived from the asset and then deducts portions of the cash flow that can be attributed to supporting assets, such as a brand name or fixed assets, that contributed to the generation of the cash flows. The resulting cash flow, which is attributable solely to the customer list asset, is then discounted at a rate of return commensurate with the risk of the asset to calculate a present value. The fair value of acquired customer lists may also be estimated by discounting the estimated cash flows expected to be generated by the assets. Assumptions used in these calculations include same-customer revenue growth rates and estimated customer retention rates based on the acquirees' historical information. The fair value of acquired technology is estimated, at times, using the relief from royalty method, which calculates the cost savings associated with owning rather than licensing the technology. Assumed royalty rates are applied to the projected revenues for the remaining useful life of the technology to estimate the royalty savings. The fair value of acquired technology may also be estimated using the cost of reproduction method under which the primary components of the technology are identified and the estimated cost to reproduce the technology is calculated based on historical data provided by the acquirees. We estimate the fair value of liabilities for contingent consideration by discounting to present value the probability-weighted contingent payments expected to be made. Assumptions used in these calculations include discount rates, projected financial results of the acquired businesses based on our most recent internal forecasts, and factors indicating the probability of achieving the forecasted results. The excess of the purchase price over the estimated fair value of the net assets acquired is recorded as goodwill. Goodwill is not amortized, but is subject to impairment testing on at least an annual basis.
We are also required to estimate the useful lives of the acquired intangible assets, which determines the amount of acquisition-related amortization expense we will record in future periods. Each reporting period, we evaluate the remaining useful lives of our amortizable intangibles to determine whether events or circumstances warrant a revision to the remaining period of amortization.
While we use our best estimates and assumptions, our fair value estimates are inherently uncertain and subject to refinement. As a result, during the measurement period, which may be up to one year from the acquisition date, we may record adjustments to the assets acquired and liabilities assumed, with the corresponding offset to goodwill. Any adjustments required after the measurement period are recorded in the consolidated statements of income.
The judgments required in determining the estimated fair values and expected useful lives assigned to each class of assets and liabilities acquired can significantly affect net income. For example, different classes of assets will have useful lives that differ. Consequently, to the extent a longer-lived asset is ascribed greater value than a shorter-lived asset, net income in a given period may be higher. Additionally, assigning a lower value to amortizable intangibles would result in a higher amount
39
assigned to goodwill. As goodwill is not amortized, this would benefit net income in a given period, although goodwill is subject to annual impairment analysis.
Impairment of Goodwill and Indefinite-Lived Trade Name
Goodwill and our indefinite-lived trade name totaled $1,150.0 million as of December 31, 2017, which represented 52.1% of total assets. These assets are tested for impairment on an annual basis as of July 31, or more frequently if events occur or circumstances change that could indicate a possible impairment. In addition to the required impairment analyses, we regularly evaluate the remaining useful life of our indefinite-lived trade name to determine whether events and circumstances continue to support an indefinite useful life. If we would determine that this asset has a finite useful life, we would test the asset for impairment and then amortize the asset's remaining carrying value over its estimated remaining useful life.
To analyze goodwill for impairment, we must assign our goodwill to individual reporting units. Identification of reporting units includes an analysis of the components that comprise each of our operating segments, which considers, among other things, the manner in which we operate our business and the availability of discrete financial information. Components of an operating segment are aggregated to form one reporting unit if the components have similar economic characteristics. We periodically review our reporting units to ensure that they continue to reflect the manner in which we operate our business.
2017 goodwill impairment analysis – In conjunction with our annual strategic planning process during the third quarter of 2017, we made various changes to our internal reporting structure. As a result, we reassessed our operating segments and determined that no changes were required in our reportable operating segments. We also reassessed our previously determined reporting units and concluded that a realignment of a portion of our reporting units was required. As such, we reallocated the carrying value of goodwill to our revised reporting units based on their relative fair values. We analyzed goodwill for impairment immediately prior to this realignment by performing qualitative analyses for our Small Business Services reporting units and quantitative analyses for our Financial Services and Direct Checks reporting units. The qualitative analyses evaluated factors including, but not limited to, economic, market and industry conditions, cost factors and the overall financial performance of the reporting units. We also considered the last quantitative analysis we completed. In completing these assessments, we noted no changes in events or circumstances that indicated that it was more likely than not that the fair value of any reporting unit was less than its carrying amount, with the exception of our Small Business Services Safeguard reporting unit. The analysis of this reporting unit, which incorporated the results of the annual strategic planning process, indicated lowered projected long-term revenue growth and profitability levels resulting from changes in market trends and the mix of products and services sold, including the continuing decline in check and forms usage. As a result, we completed impairment analyses of the long-term assets of this reporting unit, excluding goodwill, and concluded that these assets were not impaired. We then completed the quantitative analysis of the reporting unit. This quantitative analysis indicated that this reporting unit's goodwill was fully impaired and resulted in a non-cash pre-tax goodwill impairment charge of $28.4 million during the third quarter of 2017. The impairment charge was measured as the amount by which the reporting unit's carrying value exceeded its estimated fair value. Immediately subsequent to the realignment of our reporting unit structure, we completed a quantitative analysis for all of our reporting units to which goodwill is assigned. This quantitative analysis as of July 31, 2017 indicated that the estimated fair values of our reporting units exceeded their carrying values by approximate amounts between $64.0 million and $1.41 billion, or by amounts between 36% and 314% above the carrying values of their net assets. The reporting unit with the smallest difference between carrying value and fair value is our Web Services reporting unit. A large portion of this reporting unit consists of businesses that were acquired during 2017, and growing our web services offerings is a focus of our growth strategy. However, if our recent acquisitions were to fail to achieve expected operating results or if we were to change our business strategies, this could result in a decline in the fair value of this reporting unit. Total goodwill for this reporting unit was $159.4 million as of the date of the 2017 assessment.
In completing the quantitative analyses of goodwill, we first compared the carrying value of the reporting unit, including goodwill, to its estimated fair value. Carrying value is based on the assets and liabilities associated with the operations of the reporting unit, which often requires the allocation of shared or corporate items among reporting units. In calculating the estimated fair value, we used the income approach. The income approach is a valuation technique under which we estimated future cash flows using the reporting unit's financial forecast from the perspective of an unrelated market participant. Using historical trending and internal forecasting techniques, we projected revenue and applied our fixed and variable cost experience rates to the projected revenue to arrive at the future cash flows. A terminal value was then applied to the projected cash flow stream. Future estimated cash flows were discounted to their present value to calculate the estimated fair value. The discount rate used was the market-value-weighted average of our estimated cost of capital derived using both known and estimated customary market metrics. In determining the estimated fair value of a reporting unit, we are required to estimate a number of factors, including projected operating results, terminal growth rates, economic conditions, anticipated future cash flows, the discount rate and the allocation of shared or corporate items. When completing a quantitative analysis for all of our reporting units, the summation of our reporting units' fair values is compared to our consolidated fair value, as indicated by our market capitalization, to evaluate the reasonableness of our calculations.
2016 and 2015 goodwill impairment analyses – In completing the 2016 and 2015 annual goodwill impairment analyses, we elected to perform a qualitative assessment for all of our reporting units to which goodwill was assigned, with one exception. We elected to perform a quantitative analysis for our Financial Services Commercial reporting unit. This reporting unit was acquired subsequent to our 2014 annual impairment analysis and the quantitative analysis completed as of July 31, 2015
40
indicated that the estimated fair value of this reporting unit exceeded its carrying value by approximately 13%. The quantitative assessment completed for this reporting unit as of July 31, 2016 indicated that its estimated fair value exceeded its carrying value by approximately 49%. Total goodwill for this reporting unit was approximately $45.0 million as of the date of our 2016 assessment.
The qualitative analyses for our other reporting units completed during 2016 and 2015 evaluated factors including, but not limited to, economic, market and industry conditions, cost factors and the overall financial performance of the reporting units. We also considered the quantitative analysis we completed as of July 31, 2014 in which the estimated fair values of our reporting units' net assets exceeded their carrying values by approximate amounts between $74.0 million and $1.13 billion, or by amounts between 47% and 482% above the carrying values of their net assets. In completing these assessments, we noted no changes in events or circumstances which indicated that is was more likely than not that the fair value of any reporting unit was less than its carrying amount.
Indefinite-lived trade name – The estimate of fair value for our indefinite-lived trade name is based on the relief from royalty method, which calculates the cost savings associated with owning rather than licensing the trade name. An assumed royalty rate is applied to forecasted revenue and the resulting cash flows are discounted. If the estimated fair value is less than the carrying value of the asset, an impairment loss would be recognized for the difference. The annual impairment analysis completed during 2017 indicated that the estimated fair value of our indefinite-lived trade name exceeded its carrying value of $19.1 million by approximately $16.0 million. In this analysis, we assumed a discount rate of 10.0% and a royalty rate of 1.0%. A one-half percentage point increase in the discount rate would reduce the indicated fair value of the asset by approximately $2.0 million and a one-half percentage point decrease in the royalty rate would reduce the indicated fair value of the asset by approximately $17.0 million.
Evaluations of asset impairment require us to make assumptions about future events, market conditions, and financial performance over the life of the asset being evaluated. These assumptions require significant judgment and actual results may differ from our assumptions. For example, if our stock price were to decline for a sustained period, if a downturn in economic conditions were to negatively affect our actual and forecasted operating results, if order volume declines for our Direct Checks segment were to materially accelerate, if recent acquisitions were to fail to achieve expected operating results, or if we were to change our business strategies, these situations could indicate a decline in the fair value of one or more of our reporting units. This may require us to record an impairment charge for a portion of goodwill and/or our indefinite-lived trade name or other assets.
Revenue Recognition
In general, revenue is recognized when (1) persuasive evidence of an arrangement exists, (2) delivery has occurred or services have been rendered, (3) the sales price is fixed or determinable, and (4) collectibility is reasonably assured. Revenue is presented in our consolidated statements of income net of rebates, discounts, amortization of contract acquisition costs and sales tax.
Product revenue – The majority of our revenues are generated from the sale of products for which revenue is recognized upon shipment or customer receipt, based upon the transfer of title. Product revenue includes amounts billed to customers for shipping and handling and pass-through costs, such as marketing materials for which our financial institution clients reimburse us. Costs incurred for shipping and handling and pass-through costs are reflected in cost of products. For sales with a right of return, we record a reserve for estimated sales returns based on historical experience.
We enter into contractual agreements with financial institution clients for rebates on certain products we sell. We record these amounts as reductions of revenue in the consolidated statements of income and as accrued liabilities in the consolidated balance sheets when the related revenue is recorded. At times we may also sell products at discounted prices or provide free products to customers when they purchase a specified product. Discounts are recorded as reductions of revenue when the related revenue is recorded. The cost of free products is recorded as cost of products when the revenue for the related order is recorded.
Service revenue – Our services consist primarily of web design, hosting and other web services; fraud prevention; marketing services, including email, mobile, social media and other self-service marketing solutions, as well as data-driven marketing solutions; treasury management solutions; financial institution customer acquisition and loyalty programs; payroll services; and logo design. We recognize the majority of these service revenues as the services are provided. In some situations, our web hosting and applications services are billed on a quarterly, semi-annual or annual basis. When a customer pays in advance for services, we defer the revenue and recognize it as the services are performed. Up-front set-up fees related to our treasury management solutions are deferred and recognized as revenue on the straight-line basis over the term of the customer relationship. Deferred revenue is included in accrued liabilities and other non-current liabilities in the consolidated balance sheets.
Service revenue, percentage-of-completion method – A portion of our revenue from treasury management solutions results from the sale of bundled arrangements that may include hardware, software and professional services. As these arrangements involve customization and modification of the software, we recognize revenues from these contracts using the
41
percentage-of-completion method of accounting, which involves calculating the percentage of services provided during the reporting period compared with the total estimated services to be provided over the duration of the contract. Estimates of total contract revenues and costs are continuously monitored during the term of the contract, and recorded revenues and estimated costs are subject to revision as the contract progresses. Such revisions may result in increases or decreases in revenues and expenses and are reflected in the consolidated statements of income in the periods in which they are first identified. Revisions to these estimates during 2017 were not significant to our consolidated results of operations. If our estimates indicate that a contract loss will occur, a loss provision is recorded in the period in which the loss first becomes probable and reasonably estimable. Contract losses are determined to be the amount by which the estimated total direct and indirect costs of the contract exceed the estimated total revenues that will be generated by the contract.
Contract termination payments – At times, a financial institution client may terminate its contract with us prior to the end of the contract term. In substantially all of these cases, the financial institution is contractually required to remit a contract termination payment. Such payments are recorded as revenue when the termination agreement is executed, provided that we have no further service or contractual obligations, and collection of the funds is assured. If we have a continuing service obligation following the execution of a contract termination agreement, we record the related revenue over the remaining service period.
Gross vs. net revenue recognition – Certain revenue streams require judgment to determine if revenue should be recorded on a gross basis or net of related costs. Reported revenue for our Financial Services segment does not reflect the full retail price paid by end-consumers to their financial institutions. Instead, revenue reflects the amounts paid to us by our financial institution clients. Revenue generated by our Safeguard distributors within the Small Business Services segment is generally recorded on a gross basis, with commissions paid to our distributors included in SG&A expense. As part of our rewards, incentive and loyalty programs, we receive payments from consumers or our clients for the products and services we provide, including hotel stays, gift cards and merchandise such as apparel, electronics, and clothing. This revenue is recorded net of the related fulfillment costs.
Postretirement Benefit Plan
Detailed information regarding our postretirement benefit plan, including a description of the plan, its related future cash flows, plan assets and the actuarial assumptions used in accounting for the plan, can be found under the caption “Note 12: Postretirement benefits” of the Notes to Consolidated Financial Statements appearing in Item 8 of this report.
We recorded net postretirement benefit income of $2.0 million for 2017, $1.8 million for 2016 and $2.7 million for 2015. Our business segments recorded postretirement benefit income in cost of revenue and in SG&A expense, based on the composition of their workforces. Effective January 1, 2018, we will adopt Accounting Standards Update No. 2017-07, Improving the Presentation of Net Periodic Pension Cost and Net Periodic Postretirement Benefit Cost. This standard requires that the entire amount of our net postretirement benefit income be recorded in the non-operating section of the statements of income, as there is no service cost associated with our plans.
Our postretirement benefit income and obligation are calculated utilizing various actuarial assumptions and methodologies. These assumptions include, but are not limited to, the discount rate, the expected long-term rate of return on plan assets, the expected health care cost trend rate and the average remaining life expectancy of plan participants. We analyze the assumptions used each year when we complete our actuarial valuation of the plan. The effects of changes to our assumptions are recognized immediately on the consolidated balance sheets, but are generally amortized into earnings over future periods, with the deferred amount recorded in accumulated other comprehensive loss. If the assumptions utilized in determining our postretirement benefit income and obligation differ from actual events, our results of operations for future periods are impacted.
Discount rate – The discount rate is used to reflect the time value of money. It is the assumed rate at which future postretirement benefits could be effectively settled. The discount rate assumption is based on the rates of return on high-quality, fixed-income instruments currently available whose cash flows approximate the timing and amount of expected benefit payments. Effective December 31, 2015, we changed the method we use to determine the discount rate used in calculating the interest component of net periodic benefit income. Instead of using a single weighted-average discount rate, we elected to utilize a full yield curve approach by applying separate discount rates to each future projected benefit payment based on time until payment. We made this change to provide a more precise measurement of interest costs by improving the correlation between projected cash flows and the corresponding yield curve rates. This change did not affect the measurement of our total benefit obligation, but reduced the interest component of net periodic benefit income $0.9 million for 2016. This is a change in accounting estimate, and accordingly, we accounted for it on a prospective basis.
Our accumulated postretirement benefit obligation as of December 31, 2017, was $87.6 million. In measuring this obligation, we assumed a discount rate of 3.46%. A 0.25 point change in the discount rate would increase or decrease our postretirement benefit obligation by approximately $1.7 million.
Expected long-term rate of return on plan assets – The long-term rate of return on plan assets reflects the average rate of earnings expected on the funds invested or to be invested to provide for expected benefit payments. In determining this rate, we
42
utilize our historical returns and then adjust these returns for estimated inflation and projected market returns. Our inflation assumption is primarily based on analysis of historical inflation data. As of December 31, 2017, the fair value of our plan assets was $127.4 million. In measuring net postretirement benefit income for 2017, we assumed an expected long-term rate of return on plan assets of 6.25%. A 0.25 point change in this assumption would increase or decrease our annual postretirement benefit income by approximately $0.3 million.
Expected health care cost trend rate – The health care cost trend rate represents the expected annual rate of change in the cost of health care benefits currently provided due to factors other than changes in the demographics of plan participants. In measuring the accumulated postretirement benefit obligation as of December 31, 2017, our initial health care inflation rate was assumed to be 7.90% for participants under the age of 65 and 9.10% for participants age 65 and older. Our ultimate health care inflation rate was assumed to be 4.5% in 2025 and beyond for all participants. A one-percentage-point change in the health care cost trend rates would have the following effects:
(in thousands) |
One-percentage-point increase |
One-percentage-point decrease |
||||||
Effect on total of service and interest cost |
$ |
48 |
$ |
(45 |
) |
|||
Effect on benefit obligation |
1,402 |
(1,314 |
) |
|||||
Average remaining life expectancy of plan participants – In determining the average remaining life expectancy of plan participants, our actuaries use a mortality table that includes estimated death rates for each age. We are currently using the RP-2014 mortality table with fully generational projection scale MP-2017.
When actual events differ from our assumptions or when we change the assumptions used, an unrecognized actuarial gain or loss results. The gain or loss is recognized immediately in the consolidated balance sheets within accumulated comprehensive loss and is amortized into postretirement benefit income over the average remaining life expectancy of inactive plan participants, as a large percentage of our plan participants are classified as inactive. This amortization period was 14.7 years as of December 31, 2017.
The fair value of our postretirement benefit plan assets is subject to various risks, including credit, interest and overall market volatility risks. If the equity markets were to experience a significant decline in value, the fair value of our plan assets would decrease. This would affect the funded status of our plan and result in higher postretirement benefit expense in the future. Although our obligation is limited to funding benefits as they become payable, future declines in the fair value of our plan assets could also result in the need to contribute increased amounts of cash to fund benefits payable under the plan. We utilized plan assets to pay a significant portion of benefits during 2017, and we anticipate that we will utilize plan assets to pay a significant portion of benefits during 2018.
New Accounting Pronouncements
Information regarding the accounting pronouncements adopted during 2017 and those not yet adopted can be found under the caption “Note 1: Significant accounting policies” of the Notes to Consolidated Financial Statements appearing in Item 8 of this report.
Item 7A. Quantitative and Qualitative Disclosures About Market Risk.
We are exposed to changes in interest rates primarily as a result of the borrowing activities used to support our capital structure, maintain liquidity and fund business operations. We do not enter into financial instruments for speculative or trading purposes. The nature and amount of debt outstanding can be expected to vary as a result of future business requirements, market conditions and other factors. As of December 31, 2017, our total debt was comprised of the following:
(in thousands) |
Carrying amount |
Fair value(1)
|
Weighted-average interest rate |
||||||||
Amount drawn on revolving credit facility |
$ |
413,000 |
$ |
413,000 |
3.0 |
% |
|||||
Amount outstanding under term loan facility |
294,386 |
294,938 |
3.0 |
% |
|||||||
Capital lease obligations |
1,914 |
1,914 |
2.0 |
% |
|||||||
Total debt |
$ |
709,300 |
$ |
709,852 |
3.0 |
% |
|||||
(1) The carrying amounts reported in the consolidated balance sheets for amounts drawn under our revolving credit facility and our term loan facility, excluding unamortized debt issuance costs, approximate fair value because our interest rates are variable and reflect current market rates. Capital lease obligations are presented at their carrying amount.
43
Amounts drawn on our revolving credit facility and our term loan facility mature in February 2019. Our capital lease obligations are due through September 2021. As our credit facility matures in February 2019, we expect that we will enter into a new credit facility agreement in the first half of 2018.
Based on the daily average amount of outstanding variable rate debt in our portfolio, a one-percentage-point change in our weighted-average interest rates would have resulted in a $7.5 million change in interest expense for 2017.
We are exposed to changes in foreign currency exchange rates. Investments in, loans and advances to foreign subsidiaries and branches, as well as the operations of these businesses, are denominated in foreign currencies, primarily Canadian and Australian dollars. The effect of exchange rate changes is expected to have a minimal impact on our earnings and cash flows, as our foreign operations represent a relatively small portion of our business. We have not entered into hedges against changes in foreign currency exchange rates.
44
Item 8. Financial Statements and Supplementary Data.
Report of Independent Registered Public Accounting Firm
To the Board of Directors and Shareholders of Deluxe Corporation:
Opinions on the Financial Statements and Internal Control over Financial Reporting
We have audited the accompanying consolidated balance sheets of Deluxe Corporation and its subsidiaries as of December 31, 2017 and 2016, and the related consolidated statements of income, comprehensive income, shareholders’ equity and cash flows for each of the three years in the period ended December 31, 2017, including the related notes (collectively referred to as the “consolidated financial statements”). We also have audited the Company's internal control over financial reporting as of December 31, 2017, based on criteria established in Internal Control - Integrated Framework (2013) issued by the Committee of Sponsoring Organizations of the Treadway Commission (COSO).
In our opinion, the consolidated financial statements referred to above present fairly, in all material respects, the financial position of the Company as of December 31, 2017 and 2016, and the results of their operations and their cash flows for each of the three years in the period ended December 31, 2017 in conformity with accounting principles generally accepted in the United States of America. Also in our opinion, the Company maintained, in all material respects, effective internal control over financial reporting as of December 31, 2017, based on criteria established in Internal Control - Integrated Framework (2013) issued by the COSO.
Basis for Opinions
The Company's management is responsible for these consolidated financial statements, for maintaining effective internal control over financial reporting, and for its assessment of the effectiveness of internal control over financial reporting, included in Management's Report on Internal Control over Financial Reporting appearing under Item 9A. Our responsibility is to express opinions on the Company’s consolidated financial statements and on the Company's internal control over financial reporting based on our audits. We are a public accounting firm registered with the Public Company Accounting Oversight Board (United States) ("PCAOB") and are required to be independent with respect to the Company in accordance with the U.S. federal securities laws and the applicable rules and regulations of the Securities and Exchange Commission and the PCAOB.
We conducted our audits in accordance with the standards of the PCAOB. Those standards require that we plan and perform the audits to obtain reasonable assurance about whether the consolidated financial statements are free of material misstatement, whether due to error or fraud, and whether effective internal control over financial reporting was maintained in all material respects.
Our audits of the consolidated financial statements included performing procedures to assess the risks of material misstatement of the consolidated financial statements, whether due to error or fraud, and performing procedures that respond to those risks. Such procedures included examining, on a test basis, evidence regarding the amounts and disclosures in the consolidated financial statements. Our audits also included evaluating the accounting principles used and significant estimates made by management, as well as evaluating the overall presentation of the consolidated financial statements. Our audit of internal control over financial reporting included obtaining an understanding of internal control over financial reporting, assessing the risk that a material weakness exists, and testing and evaluating the design and operating effectiveness of internal control based on the assessed risk. Our audits also included performing such other procedures as we considered necessary in the circumstances. We believe that our audits provide a reasonable basis for our opinions.
Definition and Limitations of Internal Control over Financial Reporting
A company’s internal control over financial reporting is a process designed to provide reasonable assurance regarding the reliability of financial reporting and the preparation of financial statements for external purposes in accordance with generally accepted accounting principles. A company’s internal control over financial reporting includes those policies and procedures that (i) pertain to the maintenance of records that, in reasonable detail, accurately and fairly reflect the transactions and dispositions of the assets of the company; (ii) provide reasonable assurance that transactions are recorded as necessary to permit preparation of financial statements in accordance with generally accepted accounting principles, and that receipts and expenditures of the company are being made only in accordance with authorizations of management and directors of the company; and (iii) provide reasonable assurance regarding prevention or timely detection of unauthorized acquisition, use, or disposition of the company’s assets that could have a material effect on the financial statements.
Because of its inherent limitations, internal control over financial reporting may not prevent or detect misstatements. Also, projections of any evaluation of effectiveness to future periods are subject to the risk that controls may become inadequate because of changes in conditions, or that the degree of compliance with the policies or procedures may deteriorate.
/s/ PricewaterhouseCoopers LLP
Minneapolis, Minnesota
February 23, 2018
We have served as the Company’s auditor since 2001.
45
DELUXE CORPORATION
CONSOLIDATED BALANCE SHEETS
(in thousands, except share par value)
December 31, 2017 |
December 31, 2016 |
|||||||
ASSETS |
||||||||
Current assets: |
||||||||
Cash and cash equivalents |
$ |
$ |
||||||
Trade accounts receivable, net of allowances for uncollectible accounts |
||||||||
Inventories and supplies |
||||||||
Funds held for customers |
||||||||
Other current assets |
||||||||
Total current assets |
||||||||
Deferred income taxes |
||||||||
Long-term investments |
||||||||
Property, plant and equipment, net of accumulated depreciation |
||||||||
Assets held for sale |
||||||||
Intangibles, net of accumulated amortization |
||||||||
Goodwill |
||||||||
Other non-current assets |
||||||||
Total assets |
$ |
$ |
||||||
LIABILITIES AND SHAREHOLDERS’ EQUITY |
||||||||
Current liabilities: |
||||||||
Accounts payable |
$ |
$ |
||||||
Accrued liabilities |
||||||||
Long-term debt due within one year |
||||||||
Total current liabilities |
||||||||
Long-term debt |
||||||||
Deferred income taxes |
||||||||
Other non-current liabilities |
||||||||
Commitments and contingencies (Notes 9, 13 and 14) |
||||||||
Shareholders’ equity: |
||||||||
Common shares $1 par value (authorized: 500,000 shares; outstanding: December 31, 2017 – 47,953; December 31, 2016 – 48,546) |
||||||||
Retained earnings |
||||||||
Accumulated other comprehensive loss |
( |
) |
( |
) |
||||
Total shareholders’ equity |
||||||||
Total liabilities and shareholders’ equity |
$ |
$ |
||||||
See Notes to Consolidated Financial Statements
46
DELUXE CORPORATION
CONSOLIDATED STATEMENTS OF INCOME
(in thousands, except per share amounts)
Year Ended December 31, |
||||||||||||
2017 |
2016 |
2015 |
||||||||||
Product revenue |
$ |
$ |
$ |
|||||||||
Service revenue |
||||||||||||
Total revenue |
||||||||||||
Cost of products |
( |
) |
( |
) |
( |
) |
||||||
Cost of services |
( |
) |
( |
) |
( |
) |
||||||
Total cost of revenue |
( |
) |
( |
) |
( |
) |
||||||
Gross profit |
||||||||||||
Selling, general and administrative expense |
( |
) |
( |
) |
( |
) |
||||||
Net restructuring charges |
( |
) |
( |
) |
( |
) |
||||||
Asset impairment charges |
( |
) |
||||||||||
Operating income |
||||||||||||
Loss on early debt extinguishment |
( |
) |
( |
) |
||||||||
Interest expense |
( |
) |
( |
) |
( |
) |
||||||
Other income |
||||||||||||
Income before income taxes |
||||||||||||
Income tax provision |
( |
) |
( |
) |
( |
) |
||||||
Net income |
$ |
$ |
$ |
|||||||||
Basic earnings per share |
$ |
$ |
$ |
|||||||||
Diluted earnings per share |
||||||||||||
Cash dividends per share |
||||||||||||
See Notes to Consolidated Financial Statements
47
DELUXE CORPORATION
CONSOLIDATED STATEMENTS OF COMPREHENSIVE INCOME
(in thousands)
Year Ended December 31, |
||||||||||||
2017 |
2016 |
2015 |
||||||||||
Net income |
$ |
$ |
$ |
|||||||||
Other comprehensive income (loss), net of tax: |
||||||||||||
Postretirement benefit plans: |
||||||||||||
Net actuarial gain (loss) arising during the year |
( |
) |
||||||||||
Less reclassification of amounts from other comprehensive loss to net income: |
||||||||||||
Amortization of prior service credit |
( |
) |
( |
) |
( |
) |
||||||
Amortization of net actuarial loss |
||||||||||||
Postretirement benefit plans |
( |
) |
||||||||||
Unrealized holding (losses) gains on securities arising during the year |
( |
) |
( |
) |
||||||||
Unrealized foreign currency translation adjustment |
( |
) |
||||||||||
Other comprehensive income (loss) |
( |
) |
||||||||||
Comprehensive income |
$ |
$ |
$ |
|||||||||
Income tax (expense) benefit of other comprehensive income (loss) included in above amounts: |
||||||||||||
Postretirement benefit plans: |
||||||||||||
Net actuarial gain (loss) arising during the year |
$ |
( |
) |
$ |
( |
) |
$ |
|||||
Less reclassification of amounts from other comprehensive loss to net income: |
||||||||||||
Amortization of prior service credit |
||||||||||||
Amortization of net actuarial loss |
( |
) |
( |
) |
( |
) |
||||||
Postretirement benefit plans |
( |
) |
( |
) |
||||||||
Unrealized holding (losses) gains on securities arising during the year |
( |
) |
||||||||||
Total net tax (expense) benefit included in other comprehensive income (loss) |
$ |
( |
) |
$ |
( |
) |
$ |
|||||
See Notes to Consolidated Financial Statements
48
DELUXE CORPORATION
CONSOLIDATED STATEMENTS OF SHAREHOLDERS' EQUITY
(in thousands)
Common shares |
Common shares par value
|
Additional paid-in capital |
Retained earnings |
Accumulated other comprehensive loss |
Total |
||||||||||||||||||
Balance, December 31, 2014 |
$ |
$ |
$ |
$ |
( |
) |
$ |
||||||||||||||||
Net income |
— |
— |
— |
— |
|||||||||||||||||||
Cash dividends |
— |
— |
— |
( |
) |
— |
( |
) |
|||||||||||||||
Common shares issued |
— |
||||||||||||||||||||||
Tax impact of share-based awards |
— |
— |
— |
||||||||||||||||||||
Common shares repurchased |
( |
) |
( |
) |
( |
) |
( |
) |
( |
) |
|||||||||||||
Other common shares retired |
( |
) |
( |
) |
( |
) |
— |
( |
) |
||||||||||||||
Fair value of share-based compensation |
— |
— |
— |
||||||||||||||||||||
Other comprehensive loss |
— |
( |
) |
( |
) |
||||||||||||||||||
Balance, December 31, 2015 |
( |
) |
|||||||||||||||||||||
Net income |
— |
— |
— |
— |
|||||||||||||||||||
Cash dividends |
— |
— |
— |
( |
) |
— |
( |
) |
|||||||||||||||
Common shares issued |
— |
— |
|||||||||||||||||||||
Common shares repurchased |
( |
) |
( |
) |
( |
) |
( |
) |
— |
( |
) |
||||||||||||
Other common shares retired |
( |
) |
( |
) |
( |
) |
— |
— |
( |
) |
|||||||||||||
Fair value of share-based compensation |
— |
— |
— |
— |
|||||||||||||||||||
Other comprehensive income |
— |
— |
— |
— |
|||||||||||||||||||
Balance, December 31, 2016 |
( |
) |
|||||||||||||||||||||
Net income |
— |
— |
— |
— |
|||||||||||||||||||
Cash dividends |
— |
— |
— |
( |
) |
— |
( |
) |
|||||||||||||||
Common shares issued |
— |
— |
|||||||||||||||||||||
Common shares repurchased |
( |
) |
( |
) |
( |
) |
( |
) |
— |
( |
) |
||||||||||||
Other common shares retired |
( |
) |
( |
) |
( |
) |
— |
— |
( |
) |
|||||||||||||
Fair value of share-based compensation |
— |
— |
— |
— |
|||||||||||||||||||
Other comprehensive income |
— |
— |
— |
— |
|||||||||||||||||||
Balance, December 31, 2017 |
$ |
$ |
$ |
$ |
( |
) |
$ |
||||||||||||||||
See Notes to Consolidated Financial Statements
49
DELUXE CORPORATION
CONSOLIDATED STATEMENTS OF CASH FLOWS
(in thousands)
Year Ended December 31, |
||||||||||||
2017 |
2016 |
2015 |
||||||||||
Cash flows from operating activities: |
||||||||||||
Net income |
$ |
$ |
$ |
|||||||||
Adjustments to reconcile net income to net cash provided by operating activities: |
||||||||||||
Depreciation |
||||||||||||
Amortization of intangibles |
||||||||||||
Asset impairment charges |
||||||||||||
Amortization of contract acquisition costs |
||||||||||||
Deferred income taxes |
( |
) |
( |
) |
||||||||
Employee share-based compensation expense |
||||||||||||
Loss on early debt extinguishment |
||||||||||||
Other non-cash items, net |
( |
) |
||||||||||
Changes in assets and liabilities, net of effect of acquisitions: |
||||||||||||
Trade accounts receivable |
( |
) |
( |
) |
||||||||
Inventories and supplies |
( |
) |
( |
) |
||||||||
Other current assets |
( |
) |
||||||||||
Non-current assets |
( |
) |
( |
) |
( |
) |
||||||
Accounts payable |
( |
) |
( |
) |
||||||||
Contract acquisition payments |
( |
) |
( |
) |
( |
) |
||||||
Other accrued and non-current liabilities |
( |
) |
( |
) |
( |
) |
||||||
Net cash provided by operating activities |
||||||||||||
Cash flows from investing activities: |
||||||||||||
Purchases of capital assets |
( |
) |
( |
) |
( |
) |
||||||
Payments for acquisitions, net of cash acquired |
( |
) |
( |
) |
( |
) |
||||||
Proceeds from company-owned life insurance policies |
||||||||||||
Proceeds from sales of marketable securities |
||||||||||||
Other |
||||||||||||
Net cash used by investing activities |
( |
) |
( |
) |
( |
) |
||||||
Cash flows from financing activities: |
||||||||||||
Proceeds from issuing long-term debt |
||||||||||||
Payments on long-term debt, including costs of debt reacquisition |
( |
) |
( |
) |
( |
) |
||||||
Proceeds from issuing shares under employee plans |
||||||||||||
Excess tax benefit from share-based employee awards |
||||||||||||
Employee taxes paid for shares withheld |
( |
) |
( |
) |
( |
) |
||||||
Payments for common shares repurchased |
( |
) |
( |
) |
( |
) |
||||||
Cash dividends paid to shareholders |
( |
) |
( |
) |
( |
) |
||||||
Other |
( |
) |
( |
) |
( |
) |
||||||
Net cash (used) provided by financing activities |
( |
) |
( |
) |
||||||||
Effect of exchange rate change on cash |
( |
) |
||||||||||
Net change in cash and cash equivalents |
( |
) |
||||||||||
Cash and cash equivalents, beginning of year |
||||||||||||
Cash and cash equivalents, end of year |
$ |
$ |
$ |
|||||||||
See Notes to Consolidated Financial Statements
50
DELUXE CORPORATION
NOTES TO CONSOLIDATED FINANCIAL STATEMENTS
(dollars in thousands, except per share amounts)
Note 1: Significant accounting policies
51
DELUXE CORPORATION
NOTES TO CONSOLIDATED FINANCIAL STATEMENTS
(dollars in thousands, except per share amounts)
We capitalize costs of software developed or obtained for internal use, including website development costs, once the preliminary project stage has been completed, management commits to funding the project and it is probable that the project will be completed and the software will be used to perform the function intended. Capitalized costs include only (1) external direct costs of materials and services consumed in developing or obtaining internal-use software, (2) payroll and payroll-related costs for employees who are directly associated with and who devote time to the internal-use software project, and (3) interest costs incurred, when significant, while developing internal-use software. Costs incurred in populating websites with information about the company or products are expensed as incurred. Capitalization of costs ceases when the project is substantially complete and ready for its intended use. The carrying value of internal-use software is reviewed in accordance with our policy on impairment of long-lived assets and amortizable intangibles.
52
DELUXE CORPORATION
NOTES TO CONSOLIDATED FINANCIAL STATEMENTS
(dollars in thousands, except per share amounts)
We evaluate the recoverability of property, plant, equipment and intangibles held for sale by comparing the asset's carrying amount with its estimated fair value less costs to sell. Should the estimated fair value less costs to sell be less than the carrying value of the long-lived asset, an impairment loss would be recognized. The impairment loss would be calculated as the amount by which the carrying value of the asset exceeds the estimated fair value of the asset less costs to sell. During 2017, we recorded asset impairment charges related to Small Business Services assets held for sale. Further information regarding the impairment charges can be found in Note 2.
In completing the annual impairment analysis of our indefinite-lived trade name in each of the past 3 years, we elected to perform a quantitative assessment. This assessment compares the carrying amount of the asset to its estimated fair value. The estimate of fair value is based on the relief from royalty method, which calculates the cost savings associated with owning rather than licensing the trade name. An assumed royalty rate is applied to forecasted revenue and the resulting cash flows are discounted. If the estimated fair value is less than the carrying value of the asset, an impairment loss would be recognized for the difference. In addition to the required impairment analysis, we regularly evaluate the remaining useful life of this asset to determine whether events and circumstances continue to support an indefinite useful life. If we were to determine that the asset has a finite useful life, we would test it for impairment and then amortize its remaining carrying value over its estimated remaining useful life.
To analyze goodwill for impairment, we must assign our goodwill to individual reporting units. Identification of reporting units includes an analysis of the components that comprise each of our operating segments, which considers, among other things, the manner in which we operate our business and the availability of discrete financial information. Components of an operating segment are aggregated to form one reporting unit if the components have similar economic characteristics. We periodically review our reporting units to ensure that they continue to reflect the manner in which we operate our business.
When completing our annual goodwill impairment analysis, we have the option to first assess qualitative factors to determine whether the existence of events or circumstances leads to a determination that it is more likely than not that the fair value of a reporting unit is less than its carrying amount. If, after this qualitative assessment, we determine it is not more likely than not that the fair value of a reporting unit is less than its carrying amount, then performing the quantitative impairment test is unnecessary.
When performing a quantitative analysis of goodwill, we calculate the estimated fair value of each reporting unit to which goodwill is assigned and compare this estimated fair value to the carrying amount of the reporting unit's net assets. In calculating the estimated fair value, we use the income approach. The income approach is a valuation technique under which we estimate future cash flows using the reporting unit's financial forecast from the perspective of an unrelated market participant. Using historical trending and internal forecasting techniques, we project revenue and apply our fixed and variable cost experience rates to the projected revenue to arrive at the future cash flows. A terminal value is then applied to the projected cash flow stream. Future estimated cash flows are discounted to their present value to calculate the estimated fair value. The discount rate used is the market-value-weighted average of our estimated cost of capital derived using both known and estimated customary market metrics. In determining the estimated fair values of our reporting units, we are required to estimate a number of factors, including projected operating results, terminal growth rates, economic conditions, anticipated future cash flows, the discount rate and the allocation of shared or corporate items. When completing a quantitative analysis for all of our reporting units, the summation of our reporting units' fair values is compared to our consolidated fair value, as indicated by our market capitalization, to evaluate the reasonableness of our calculations. If the carrying amount of a reporting unit's net assets exceeds its estimated fair value, an impairment loss is recorded for the amount by which the reporting unit's carrying value exceeds its fair value, not to exceed the carrying amount of goodwill.
53
DELUXE CORPORATION
NOTES TO CONSOLIDATED FINANCIAL STATEMENTS
(dollars in thousands, except per share amounts)
We are subject to tax audits in numerous domestic and foreign tax jurisdictions. Tax audits are often complex and can require several years to complete. In the normal course of business, we are subject to challenges from the Internal Revenue Service and other tax authorities regarding the amount of taxes due. These challenges may alter the timing or amount of taxable income or deductions, or the allocation of income among tax jurisdictions. We recognize the benefits of tax return positions in the financial statements when they are more-likely-than-not to be sustained by the taxing authorities based solely on the technical merits of the position. If the recognition threshold is met, the tax benefit is measured and recognized as the largest amount of tax benefit that, in our judgment, is greater than 50 % likely to be realized. Accrued interest and penalties related to unrecognized tax positions are included in our provision for income taxes in the consolidated statements of income.
54
DELUXE CORPORATION
NOTES TO CONSOLIDATED FINANCIAL STATEMENTS
(dollars in thousands, except per share amounts)
We do not use derivative financial instruments for speculative or trading purposes. Our policy is that all derivative transactions must be linked to an existing balance sheet item or firm commitment, and the notional amount cannot exceed the value of the exposure being hedged.
The majority of our revenues are generated from the sale of products for which revenue is recognized upon shipment or customer receipt, based upon the transfer of title. Product revenue includes amounts billed to customers for shipping and handling and pass-through costs, such as marketing materials for which our financial institution clients reimburse us. Costs incurred for shipping and handling and pass-through costs are reflected in cost of products. For sales with a right of return, we record a reserve for estimated sales returns based on our significant historical experience.
We enter into contractual agreements with financial institution clients for rebates on certain products we sell. We record these amounts as reductions of revenue in the consolidated statements of income and as accrued liabilities in the consolidated balance sheets when the related revenue is recorded. At times, we may also sell products at discounted prices or provide free products to customers when they purchase a specified product. Discounts are recorded as reductions of revenue when the related revenue is recorded. The cost of free products is recorded as cost of products when the revenue for the related order is recorded. Reported revenue for our Financial Services segment does not reflect the full retail price paid by end-consumers to their financial institutions. Instead, revenue reflects the amounts paid to us by our financial institution clients.
Our services consist primarily of web design, hosting and other web services; fraud prevention; marketing services, including email, mobile, social media and other self-service marketing solutions, as well as data-driven marketing solutions; treasury management solutions; financial institution customer acquisition and loyalty programs; payroll services; and logo design. We recognize the majority of these service revenues as the services are provided. In some situations, our web hosting and applications services are billed on a quarterly, semi-annual or annual basis. When a customer pays in advance for services, we defer the revenue and recognize it as the services are performed. Up-front set-up fees related to our treasury management solutions are deferred and recognized as revenue on the straight-line basis over the term of the customer relationship. Deferred revenue is included in accrued liabilities and other non-current liabilities in the consolidated balance sheets.
A portion of our revenue from treasury management solutions results from the sale of bundled arrangements that may include hardware, software and professional services. As these arrangements involve customization and modification of the software, we recognize revenues from these contracts using the percentage-of-completion method of accounting, which involves calculating the percentage of services provided during the reporting period compared with the total estimated services to be provided over the duration of the contract. We record costs and earnings in excess of billings on uncompleted contracts within other current assets and billings in excess of costs and earnings on uncompleted contracts within other current liabilities in the consolidated balance sheets. The amount included in other current assets related to these contracts was $16,379 as of December 31, 2017 and $6,729 as of December 31, 2016. The amount included in other current liabilities related to these contracts was $2,233 as of December 31, 2017 and $1,266 as of December 31, 2016.
At times, a financial institution client may terminate its contract with us prior to the end of the contract term. In substantially all of these cases, the financial institution is contractually required to remit a contract termination payment. Such payments are recorded as revenue when the termination agreement is executed, provided that we have no further service or contractual obligations, and collection of the funds is assured. If we have a continuing service obligation following the execution of a contract termination agreement, we record the related revenue over the remaining service period.
55
DELUXE CORPORATION
NOTES TO CONSOLIDATED FINANCIAL STATEMENTS
(dollars in thousands, except per share amounts)
• |
The fair value of stock options is measured on the grant date using the Black-Scholes option pricing model. The related compensation expense is recognized on the straight-line basis, net of estimated forfeitures, over the options' vesting periods. |
• |
The fair value of restricted stock and a portion of our restricted stock unit awards is measured on the grant date based on the market value of our common stock. The related compensation expense, net of estimated forfeitures, is recognized over the applicable service period. |
• |
Certain of our restricted stock unit awards may be settled in cash if an employee voluntarily chooses to leave the company. These awards are included in accrued liabilities and other non-current liabilities in the consolidated balance sheets and are re-measured at fair value as of each balance sheet date. |
• |
Compensation expense resulting from the |
• |
The performance share awards specify certain performance/market-based conditions that must be achieved in order for the awards to vest. For the portion of the awards based on a performance condition, the performance target is not considered in determining the fair value of the awards and thus, fair value is measured on the grant date based on the market value of our common stock. The related compensation expense for this type of award is recognized, net of estimated forfeitures, over the related service period. The amount of compensation expense is dependent on our periodic assessment of the probability of the targets being achieved and our estimate, which may vary over time, of the number of shares that ultimately will be issued. For the portion of the awards based on a market condition, fair value is calculated on the grant date using the Monte Carlo simulation model. All compensation cost for these awards is recognized, net of estimated forfeitures, over the related service period, even if the market condition is never satisfied. |
Accounting pronouncements not yet adopted – In May 2014, the FASB issued ASU No. 2014-09, Revenue from Contracts with Customers. The standard provides revenue recognition guidance for any entity that enters into contracts with customers to transfer goods or services or enters into contracts for the transfer of non-financial assets, unless those contracts are within the scope of other accounting standards. The standard also expands the required financial statement disclosures regarding revenue recognition. In addition, in March 2016, the FASB issued ASU No. 2016-08, Principal versus Agent Considerations (Reporting Revenue Gross versus Net), in April 2016, the FASB issued ASU No. 2016-10, Identifying Performance Obligations and Licensing, and in May 2016, the FASB issued ASU No. 2016-12, Narrow-Scope Improvements and Practical Expedients. These standards are intended to clarify aspects of ASU No. 2014-09 and are effective for us upon adoption of ASU No. 2014-09. The new guidance is effective for us on January 1, 2018. We are currently finalizing our analysis of each of our revenue streams in accordance with the new guidance. We believe the most significant change is that we will begin deferring commission costs related to obtaining our check supply and treasury management solution contracts within the Financial Services segment. These amounts will be amortized as SG&A expense over the related contract term, generally on the straight-line basis over periods of 3 to 6 years. We will elect the practical expedient under which we will recognize these commissions as incurred if the contract or terms of sale is less than 1 year. In addition, we will accelerate the recognition of revenue related to certain contracts within our
56
DELUXE CORPORATION
NOTES TO CONSOLIDATED FINANCIAL STATEMENTS
(dollars in thousands, except per share amounts)
Financial Services segment that have variable consideration. The impact of this change on our consolidated financial statements will not be significant. In adopting the standards, we will use the modified retrospective method, applying the guidance to uncompleted contracts as of January 1, 2018. As such, we will record the cumulative effect of the change in the first quarter of 2018 by recording a non-current asset for the incremental commission costs with an offset to opening retained earnings. We currently estimate this amount will be approximately $6,000 . Prior periods will not be retrospectively adjusted. In our 2018 financial statements, we will disclose the amount by which each financial statement line item is affected by the application of the new guidance as compared with the guidance that was in effect before the change. Our 2018 financial statements will also reflect the disclosures required by the new standards.
In January 2016, the FASB issued ASU No. 2016-01, Recognition and Measurement of Financial Assets and Financial Liabilities. The standard is intended to improve the recognition, measurement, presentation and disclosure of financial instruments. The guidance is effective for us on January 1, 2018. We do not expect the application of this standard to have a significant impact on our results of operations or financial position.
In February 2016, the FASB issued ASU No. 2016-02, Leasing. The standard is intended to increase transparency and comparability among organizations by requiring the recognition of lease assets and lease liabilities for virtually all leases and by requiring the disclosure of key information about leasing arrangements. The guidance is effective for us on January 1, 2019 and requires adoption using a modified retrospective approach. We are currently assessing the impact of this standard on our consolidated financial statements.
In June 2016, the FASB issued ASU No. 2016-13, Measurement of Credit Losses on Financial Instruments. The standard introduces new guidance for the accounting for credit losses on instruments within its scope, including trade and loans receivable and available-for-sale debt securities. The guidance is effective for us on January 1, 2020 and requires adoption using a modified retrospective approach. We do not expect the application of this standard to have a significant impact on our results of operations or financial position.
In October 2016, the FASB issued ASU No. 2016-16, Intra-Entity Transfers of Assets Other Than Inventory. The standard requires recognition of the tax effects resulting from the intercompany sale of an asset when the transfer occurs. Previously, the tax effects were deferred until the transferred asset was sold to a third party. The guidance is effective for us on January 1, 2018 and requires adoption using a modified retrospective approach. We do not expect the application of this standard to have a significant impact on our results of operations or financial position.
In January 2017, the FASB issued ASU No. 2017-01, Clarifying the Definition of a Business. The standard revises the definition of a business, which affects many areas of accounting such as business combinations and disposals and goodwill impairment. The revised definition of a business will likely result in more acquisitions being accounted for as asset acquisitions, as opposed to business combinations. The guidance is effective for us on January 1, 2018 and is required to be applied prospectively to transactions occurring on or after the effective date.
In March 2017, the FASB issued ASU No. 2017-07, Improving the Presentation of Net Periodic Pension Cost and Net Periodic Postretirement Benefit Cost. The standard requires that the service cost component of net periodic benefit expense be recognized in the same statement of income caption(s) as other compensation costs, and requires that the other components of net periodic benefit expense be recognized in the non-operating section of the statement of income. In addition, only the service cost component of net periodic benefit expense is eligible for capitalization when applicable. The guidance is effective for us on January 1, 2018. The reclassification of the other components of net periodic benefit expense will be applied on a retrospective basis. As we will use the practical expedient for adoption outlined in the standard, annual net periodic benefit income of $2,016 for 2017, $1,841 for 2016 and $2,697 for 2015 will be reclassified from total cost of revenue and SG&A expense to other income in our consolidated statements of income. This represents the entire amount of our net periodic benefit income as there is no service cost associated with our plans. The guidance allowing only the service cost component of net periodic benefit expense to be capitalized will be adopted on a prospective basis, and we do not expect this change to have a significant impact on our results of operations or financial position.
In May 2017, the FASB issued ASU No. 2017-09, Scope of Modification Accounting. The standard provides guidance about which changes to the terms or conditions of a share-based payment award require modification accounting, which may result in a different fair value for the award. The guidance is effective for us on January 1, 2018 and is required to be applied prospectively to awards modified on or after the effective date. Historically, modifications to our share-based payment awards have been rare. As such, we do not expect the application of this standard to have a significant impact on our results of operations or financial position.
In February 2018, the FASB issued ASU No. 2018-02, Reclassification of Certain Tax Effects from Accumulated Other Comprehensive Income. The standard allows companies to make an election to reclassify from accumulated other comprehensive income to retained earnings the stranded tax effects resulting from the Tax Cuts and Jobs Act of 2017. The guidance is effective for us on January 1, 2019. We intend to early adopt this guidance on January 1, 2018 and will elect to reclassify the stranded tax effects, which we estimate are approximately $7,000 . The standard allows application of the new
57
DELUXE CORPORATION
NOTES TO CONSOLIDATED FINANCIAL STATEMENTS
(dollars in thousands, except per share amounts)
Note 2: Supplemental balance sheet and cash flow information
Trade accounts receivable – Net trade accounts receivable was comprised of the following at December 31:
(in thousands) |
2017 |
2016 |
||||||
Trade accounts receivable – gross |
$ |
$ |
||||||
Allowances for uncollectible accounts |
( |
) |
( |
) |
||||
Trade accounts receivable – net |
$ |
$ |
||||||
Changes in the allowances for uncollectible accounts for the years ended December 31 were as follows:
(in thousands) |
2017 |
2016 |
2015 |
|||||||||
Balance, beginning of year |
$ |
2,828 |
$ |
4,816 |
$ |
|||||||
Bad debt expense |
||||||||||||
Write-offs, net of recoveries |
( |
) |
( |
) |
( |
) |
||||||
Balance, end of year |
$ |
$ |
$ |
|||||||||
Inventories and supplies – Inventories and supplies were comprised of the following at December 31:
(in thousands) |
2017 |
2016 |
||||||
Raw materials |
$ |
$ |
||||||
Semi-finished goods |
||||||||
Finished goods |
||||||||
Supplies |
||||||||
Inventories and supplies |
$ |
$ |
||||||
Available-for-sale securities – Available-for-sale marketable securities included within funds held for customers were comprised of the following:
December 31, 2017 |
||||||||||||||||
(in thousands) |
Cost |
Gross unrealized gains |
Gross unrealized losses |
Fair value |
||||||||||||
Funds held for customers:(1)
|
||||||||||||||||
Domestic money market fund |
$ |
$ |
$ |
$ |
||||||||||||
Canadian and provincial government securities |
( |
) |
||||||||||||||
Canadian guaranteed investment certificates |
||||||||||||||||
Available-for-sale securities |
$ |
$ |
$ |
( |
) |
$ |
||||||||||
(1) Funds held for customers, as reported on the consolidated balance sheet as of December 31, 2017, also included cash of $52,279 .
58
DELUXE CORPORATION
NOTES TO CONSOLIDATED FINANCIAL STATEMENTS
(dollars in thousands, except per share amounts)
December 31, 2016 |
||||||||||||||||
(in thousands) |
Cost |
Gross unrealized gains |
Gross unrealized losses |
Fair value |
||||||||||||
Funds held for customers:(1)
|
||||||||||||||||
Domestic money market fund |
$ |
$ |
$ |
$ |
||||||||||||
Canadian and provincial government securities |
( |
) |
||||||||||||||
Canadian guaranteed investment certificates |
||||||||||||||||
Available-for-sale securities |
$ |
$ |
$ |
( |
) |
$ |
||||||||||
(in thousands) |
Fair value |
|||
Due in one year or less |
$ |
|||
Due in two to five years |
||||
Due in six to ten years |
||||
Available-for-sale securities |
$ |
|||
Further information regarding the fair value of available-for-sale marketable securities can be found in Note 7.
Property, plant and equipment – Property, plant and equipment was comprised of the following at December 31:
2017 |
2016 |
|||||||||||||||||||||||
(in thousands) |
Gross carrying amount |
Accumulated depreciation |
Net carrying amount |
Gross carrying amount |
Accumulated depreciation |
Net carrying amount |
||||||||||||||||||
Land and improvements |
$ |
$ |
( |
) |
$ |
$ |
$ |
( |
) |
$ |
||||||||||||||
Buildings and improvements |
( |
) |
( |
) |
||||||||||||||||||||
Machinery and equipment |
( |
) |
( |
) |
||||||||||||||||||||
Property, plant and equipment |
$ |
$ |
( |
) |
$ |
$ |
$ |
( |
) |
$ |
||||||||||||||
Assets held for sale – Assets held for sale as of December 31, 2017 included 2 providers of printed and promotional products that were classified as held for sale during the third quarter of 2017, as well as 2 small business distributors that were classified as held for sale during the fourth quarter of 2017. Assets held for sale as of December 31, 2016 included the operations of a small business distributor and a provider of printed and promotional products, both of which were sold during 2017. Also during 2017, we sold the operations of an additional small business distributor that previously did not meet the requirements to be classified as held for sale in the consolidated balance sheets, as well as a small business distributor and assets associated with certain custom printing activities that were classified as held for sale during the second quarter of 2017. We determined that these businesses would be better positioned for long-term growth if they were managed independently. Subsequent to the sales, the businesses are owned by independent distributors that are part of our Safeguard distributor network. As such, our revenue is not impacted by these sales and the impact to our costs is not significant. We entered into aggregate notes receivable of $24,497 in conjunction with the sales and we recognized aggregate net gains of $8,703 within SG&A expense in the 2017 consolidated statement of income.
The businesses sold during 2017, as well as those held for sale as of December 31, 2017, were included in our Small Business Services segment and their net assets consisted primarily of intangible assets. During 2017, we recorded aggregate pre-tax asset impairment charges of $8,250 related to the small business distributor sold during the second quarter of 2017. The impairment charges reduced the carrying value of the business to its fair value less costs to sell, as we finalized the sale of this business.
59
DELUXE CORPORATION
NOTES TO CONSOLIDATED FINANCIAL STATEMENTS
(dollars in thousands, except per share amounts)
We are actively marketing the remaining assets held for sale and we expect the selling prices will equal or exceed their current carrying values. Net assets held for sale consisted of the following at December 31:
(in thousands) |
2017 |
2016 |
Balance sheet caption |
|||||||
Current assets |
$ |
$ |
Other current assets |
|||||||
Intangibles |
Assets held for sale |
|||||||||
Goodwill |
Assets held for sale |
|||||||||
Other non-current assets |
Assets held for sale |
|||||||||
Accrued liabilities |
( |
) |
Accrued liabilities |
|||||||
Non-current deferred income tax liabilities |
( |
) |
Other non-current liabilities |
|||||||
Net assets held for sale |
$ |
$ |
||||||||
Intangibles – Intangibles were comprised of the following at December 31:
2017 |
2016 |
|||||||||||||||||||||||
(in thousands) |
Gross carrying amount |
Accumulated amortization |
Net carrying amount |
Gross carrying amount |
Accumulated amortization |
Net carrying amount |
||||||||||||||||||
Indefinite-lived: |
||||||||||||||||||||||||
Trade name |
$ |
$ |
— |
$ |
$ |
$ |
— |
$ |
||||||||||||||||
Amortizable intangibles: |
||||||||||||||||||||||||
Internal-use software |
( |
) |
( |
) |
||||||||||||||||||||
Customer lists/relationships |
( |
) |
( |
) |
||||||||||||||||||||
Trade names(1)
|
( |
) |
( |
) |
||||||||||||||||||||
Software to be sold |
( |
) |
( |
) |
||||||||||||||||||||
Technology-based intangibles |
( |
) |
||||||||||||||||||||||
Other |
( |
) |
( |
) |
||||||||||||||||||||
Amortizable intangibles |
( |
) |
( |
) |
||||||||||||||||||||
Intangibles |
$ |
$ |
( |
) |
$ |
$ |
$ |
( |
) |
$ |
||||||||||||||
(1) During the third quarter of 2017, we recorded a pre-tax asset impairment charge of $14,752 for one of our trade names. Further information can be found in Note 7 .
(in thousands) |
2017 |
2016 |
2015 |
|||||||||
Customer lists/relationships |
$ |
$ |
$ |
|||||||||
Internal-use software |
||||||||||||
Trade names |
||||||||||||
Other amortizable intangibles |
||||||||||||
Amortization of intangibles |
$ |
$ |
$ |
|||||||||
60
DELUXE CORPORATION
NOTES TO CONSOLIDATED FINANCIAL STATEMENTS
(dollars in thousands, except per share amounts)
(in thousands) |
Estimated
amortization
expense
|
|||
2018 |
$ |
|||
2019 |
||||
2020 |
||||
2021 |
||||
2022 |
||||
2017 |
2016 |
2015 |
||||||||||||||||
(in thousands) |
Amount |
Weighted-average amortization period
(in years)
|
Amount |
Weighted-average amortization period
(in years)
|
Amount |
Weighted-average amortization period
(in years)
|
||||||||||||
Customer lists/relationships |
$ |
$ |
$ |
|||||||||||||||
Internal-use software |
||||||||||||||||||
Trade names |
||||||||||||||||||
Software to be sold |
— |
|||||||||||||||||
Technology-based intangible |
— |
|||||||||||||||||
Acquired intangibles |
$ |
$ |
$ |
|||||||||||||||
Information regarding acquired intangibles does not include measurement-period adjustments recorded for changes in the estimated fair values of intangibles acquired through acquisitions. Information regarding these adjustments can be found in Note 5.
61
DELUXE CORPORATION
NOTES TO CONSOLIDATED FINANCIAL STATEMENTS
(dollars in thousands, except per share amounts)
Goodwill – Changes in goodwill by reportable segment and in total were as follows:
(in thousands) |
Small
Business
Services
|
Financial
Services
|
Direct
Checks
|
Total |
||||||||||||
Balance, December 31, 2015: |
||||||||||||||||
Goodwill, gross |
$ |
$ |
$ |
$ |
||||||||||||
Accumulated impairment charges |
( |
) |
( |
) |
||||||||||||
Goodwill, net of accumulated impairment charges |
||||||||||||||||
Measurement-period adjustment for acquisition of Datamyx LLC (Note 5) |
— |
— |
||||||||||||||
Goodwill resulting from acquisitions (Note 5) |
— |
|||||||||||||||
Currency translation adjustment |
— |
— |
||||||||||||||
Balance, December 31, 2016: |
||||||||||||||||
Goodwill, gross |
||||||||||||||||
Accumulated impairment charges |
( |
) |
( |
) |
||||||||||||
Goodwill, net of accumulated impairment charges |
||||||||||||||||
Impairment charge (Note 7) |
( |
) |
— |
— |
( |
) |
||||||||||
Goodwill resulting from acquisitions (Note 5) |
— |
|||||||||||||||
Measurement-period adjustments for previous acquisitions (Note 5) |
( |
) |
— |
( |
) |
|||||||||||
Sale of small business distributor |
( |
) |
— |
— |
( |
) |
||||||||||
Reclassification to assets held for sale |
( |
) |
— |
— |
( |
) |
||||||||||
Currency translation adjustment |
— |
— |
||||||||||||||
Balance, December 31, 2017: |
||||||||||||||||
Goodwill, gross |
||||||||||||||||
Accumulated impairment charges |
( |
) |
( |
) |
||||||||||||
Goodwill, net of accumulated impairment charges |
$ |
$ |
$ |
$ |
||||||||||||
Other non-current assets – Other non-current assets were comprised of the following at December 31:
(in thousands) |
2017 |
2016 |
||||||
Contract acquisition costs |
$ |
$ |
||||||
Loans and notes receivable from Safeguard distributors |
||||||||
Postretirement benefit plan asset (Note 12) |
||||||||
Deferred advertising costs |
||||||||
Other |
||||||||
Other non-current assets |
$ |
$ |
||||||
(in thousands) |
2017 |
2016 |
2015 |
|||||||||
Balance, beginning of year |
$ |
$ |
$ |
|||||||||
Additions(1)
|
||||||||||||
Amortization |
( |
) |
( |
) |
( |
) |
||||||
Other |
( |
) |
( |
) |
( |
) |
||||||
Balance, end of year |
$ |
$ |
$ |
|||||||||
62
DELUXE CORPORATION
NOTES TO CONSOLIDATED FINANCIAL STATEMENTS
(dollars in thousands, except per share amounts)
Accrued liabilities – Accrued liabilities were comprised of the following at December 31:
(in thousands) |
2017 |
2016 |
||||||
Funds held for customers |
$ |
$ |
||||||
Deferred revenue |
||||||||
Employee profit sharing/cash bonus |
||||||||
Acquisition-related liabilities(1)
|
||||||||
Income tax |
||||||||
Contract acquisition costs due within one year |
||||||||
Customer rebates |
||||||||
Restructuring due within one year (Note 8) |
||||||||
Other |
||||||||
Accrued liabilities |
$ |
$ |
||||||
Other non-current liabilities – Other non-current liabilities were comprised of the following at December 31:
(in thousands) |
2017 |
2016 |
||||||
Contract acquisition costs |
$ |
$ |
||||||
Acquisition-related liabilities(1)
|
||||||||
Other |
||||||||
Other non-current liabilities |
$ |
$ |
||||||
Supplemental cash flow information – Supplemental cash flow information was as follows for the years ended December 31:
(in thousands) |
2017 |
2016 |
2015 |
|||||||||
Income taxes paid |
$ |
$ |
$ |
|||||||||
Interest paid |
||||||||||||
Non-cash investing activities: |
||||||||||||
Proceeds from sales of businesses – notes receivable |
||||||||||||
Acquisition-related liabilities(1)
|
||||||||||||
63
DELUXE CORPORATION
NOTES TO CONSOLIDATED FINANCIAL STATEMENTS
(dollars in thousands, except per share amounts)
Note 3: Earnings per share
(dollars, shares and options in thousands, except per share amounts) |
2017 |
2016 |
2015 |
|||||||||
Earnings per share – basic: |
||||||||||||
Net income |
$ |
$ |
$ |
|||||||||
Income allocated to participating securities |
( |
) |
( |
) |
( |
) |
||||||
Income available to common shareholders |
$ |
$ |
$ |
|||||||||
Weighted-average shares outstanding |
||||||||||||
Earnings per share – basic |
$ |
$ |
$ |
|||||||||
Earnings per share – diluted: |
||||||||||||
Net income |
$ |
$ |
$ |
|||||||||
Income allocated to participating securities |
( |
) |
( |
) |
( |
) |
||||||
Re-measurement of share-based awards classified as liabilities |
( |
) |
||||||||||
Income available to common shareholders |
$ |
$ |
$ |
|||||||||
Weighted-average shares outstanding |
||||||||||||
Dilutive impact of potential common shares |
||||||||||||
Weighted-average shares and potential common shares outstanding |
||||||||||||
Earnings per share – diluted |
$ |
$ |
$ |
|||||||||
Antidilutive options excluded from calculation |
||||||||||||
Note 4: Other comprehensive income
Reclassification adjustments – Information regarding amounts reclassified from accumulated other comprehensive loss to net income was as follows:
Accumulated other comprehensive loss component |
Amounts reclassified from accumulated other comprehensive loss |
Affected line item in consolidated statements of income |
||||||||||||
(in thousands) |
2017 |
2016 |
2015 |
|||||||||||
Amortization of postretirement benefit plan items: |
||||||||||||||
Prior service credit |
$ |
$ |
$ |
(1) |
||||||||||
Net actuarial loss |
( |
) |
( |
) |
( |
) |
(1) |
|||||||
Total amortization |
( |
) |
( |
) |
( |
) |
(1) |
|||||||
Tax benefit |
(1) |
|||||||||||||
Total reclassifications, net of tax |
$ |
( |
) |
$ |
( |
) |
$ |
( |
) |
(1) |
||||
64
DELUXE CORPORATION
NOTES TO CONSOLIDATED FINANCIAL STATEMENTS
(dollars in thousands, except per share amounts)
(in thousands) |
Postretirement benefit plans, net of tax |
Net unrealized (loss) gain on marketable securities, net of tax |
Currency translation adjustment |
Accumulated other comprehensive loss |
||||||||||||
Balance, December 31, 2014 |
$ |
( |
) |
$ |
( |
) |
$ |
( |
) |
$ |
( |
) |
||||
Other comprehensive (loss) income before reclassifications |
( |
) |
( |
) |
( |
) |
||||||||||
Amounts reclassified from accumulated other comprehensive loss |
||||||||||||||||
Net current-period other comprehensive (loss) income |
( |
) |
( |
) |
( |
) |
||||||||||
Balance, December 31, 2015 |
( |
) |
( |
) |
( |
) |
( |
) |
||||||||
Other comprehensive income (loss) before reclassifications |
( |
) |
||||||||||||||
Amounts reclassified from accumulated other comprehensive loss |
||||||||||||||||
Net current-period other comprehensive income (loss) |
( |
) |
||||||||||||||
Balance, December 31, 2016 |
( |
) |
( |
) |
( |
) |
( |
) |
||||||||
Other comprehensive income (loss) before reclassifications |
( |
) |
||||||||||||||
Amounts reclassified from accumulated other comprehensive loss |
||||||||||||||||
Net current-period other comprehensive income (loss) |
( |
) |
||||||||||||||
Balance, December 31, 2017 |
$ |
( |
) |
$ |
( |
) |
$ |
( |
) |
$ |
( |
) |
||||
Note 5: Acquisitions
We periodically complete business combinations that align with our business strategy. The assets and liabilities acquired are recorded at their estimated fair values and the results of operations of each acquired business are included in our consolidated statements of income from their acquisition dates. Transaction costs related to acquisitions are expensed as incurred and are included in SG&A expense in the consolidated statements of income. Transaction costs totaled $2,342 in 2017, $4,944 in 2016 and $2,210 in 2015. All of the acquisitions completed during the past 3 years were cash transactions, funded by cash on hand and/or use of our credit facility. We completed these acquisitions to increase our mix of marketing solutions and other services revenue, to improve our product and service offerings and to reach new customers.
2017 acquisitions – During 2017, we completed the following acquisitions that were included within our Small Business Services segment:
• |
In February 2017, we acquired selected assets of Panthur Pty Ltd (Panthur), an Australian web hosting and domain registration service provider. The allocation of the purchase price based upon the estimated fair values of the assets acquired and liabilities assumed resulted in goodwill of $ |
• |
In July 2017, we acquired all of the equity of Digital Pacific Group Pty Ltd (Digital Pacific), an Australian web hosting and domain registration service provider. The preliminary allocation of the purchase price based upon the estimated fair values of the assets acquired and liabilities assumed resulted in goodwill of $ |
• |
In September 2017, we acquired all of the equity of j2 Global Australia Pty Ltd, doing business as Web24, an Australian web hosting and domain registration service provider. The preliminary allocation of the purchase price based upon the estimated fair values of the assets acquired and liabilities assumed resulted in goodwill of $ |
65
DELUXE CORPORATION
NOTES TO CONSOLIDATED FINANCIAL STATEMENTS
(dollars in thousands, except per share amounts)
for tax purposes. The acquisition resulted in goodwill as we expect to utilize Web24's platform as we selectively expand into foreign markets.
• |
In November 2017, we acquired selected assets of Impact Marketing Specialists, Inc., which provides marketing solutions to real estate agents. |
• |
In December 2017, we acquired selected assets of SY Holdings, LLC, doing business as managed.com, a web hosting services provider. |
• |
During 2017, we acquired the operations of several small business distributors. The assets acquired consisted primarily of customer list intangible assets. All but |
The allocations of the purchase price are preliminary as of December 31, 2017 for the acquisitions of Digital Pacific, Web24, Impact Marketing Specialists, managed.com and several of the small business distributors. We expect to finalize these allocations in 2018 when our valuation of several of the acquired assets and liabilities is completed, including deferred income taxes; property, plant and equipment; and accrued liabilities. In addition, we will finalize our determination of the estimated useful lives of the acquired intangibles.
Within our Financial Services segment, we acquired all of the equity of RDM Corporation (RDM) of Canada in April 2017. RDM is a provider of remote deposit capture software, hardware and digital imaging solutions for financial institutions and corporate clients. The preliminary allocation of the purchase price based upon the estimated fair values of the assets acquired and liabilities assumed resulted in goodwill of $33,210 that is not deductible for tax purposes. The acquisition resulted in goodwill as it enhances our selection of treasury management solutions, strengthening our value proposition and improving our market position. We expect to finalize the allocation of the purchase price in the first quarter of 2018 when our valuation of acquired deferred income taxes is complete.
2016 acquisitions – During 2016, we completed the following acquisitions that were included within our Small Business Services segment:
• |
In February 2016, we acquired selected assets of Category 99, Inc., doing business as MacHighway®, a web hosting and domain registration service provider.
|
• |
In March 2016, we acquired selected assets of New England Art Publishers, Inc., doing business as Birchcraft Studios, a supplier of personalized invitations, holiday cards, all-occasion cards and social announcements. |
• |
In April 2016, we acquired selected assets of 180 Fusion LLC, a digital marketing services provider. The allocation of the purchase price based upon the estimated fair values of the assets acquired and liabilities assumed resulted in tax-deductible goodwill of $ |
• |
In June 2016, we acquired selected assets of L.A.M. Enterprises, Inc., a provider of printed and promotional products. |
• |
In June 2016, we acquired selected assets of National Document Solutions, LLC, a provider of printing, promotional products, office products, scanning and document management solutions. |
• |
In June 2016, we acquired selected assets of Liquid Web, LLC, a web hosting services provider. |
• |
In July 2016, we acquired selected assets of Inkhead, Inc., a provider of customized promotional products. The allocation of the purchase price based upon the estimated fair values of the assets acquired and liabilities assumed resulted in tax-deductible goodwill of $ |
• |
In August 2016, we acquired selected assets of BNBS, Inc., doing business as B&B Solutions, a provider of printing, promotional and office products and services. The allocation of the purchase price based upon the estimated fair values of the assets acquired and liabilities assumed resulted in tax-deductible goodwill of $ |
• |
In September 2016, we acquired all of the outstanding capital stock of Payce, Inc., a provider of payroll processing, payroll tax filing and related payroll services. The allocation of the purchase price based upon the estimated fair values of the assets acquired and liabilities assumed resulted in tax-deductible goodwill of $ |
• |
In October 2016, we acquired selected assets of Excel Graphic Services, Inc., a provider of printing, promotional products and document management services. |
• |
In October 2016, we acquired selected assets of PTM Document Systems, Inc., the exclusive source of the Print to Mail™ systems used in schools, hospitals and businesses. |
• |
In December 2016, we acquired selected assets of Digihost Ltd., a web services provider located in Ireland. |
• |
During 2016, we acquired the operations of several small business distributors. The assets acquired consisted primarily of customer list intangible assets. As these distributors were previously part of our Safeguard distributor network, our revenue was not impacted by these acquisitions and the impact to our costs was not significant. |
66
DELUXE CORPORATION
NOTES TO CONSOLIDATED FINANCIAL STATEMENTS
(dollars in thousands, except per share amounts)
During 2016, we completed the following acquisitions that were included within our Financial Services segment:
• |
In October 2016, we acquired selected assets of Data Support Systems, Inc., a provider of image-based software for payment-related back-office case management. The allocation of the purchase price based upon the estimated fair values of the assets acquired and liabilities assumed resulted in tax-deductible goodwill of $ |
• |
In December 2016, we acquired all of the equity of First Manhattan Consulting Group, LLC (FMCG), a provider of data-driven marketing solutions for financial institutions. The allocation of the purchase price based upon the estimated fair values of the assets acquired and liabilities assumed resulted in tax-deductible goodwill of $ |
(in thousands) |
FMCG |
|||
Net tangible assets acquired and liabilities assumed(1)
|
$ |
|||
Identifiable intangible assets: |
||||
Customer list/relationships |
||||
Technology-based intangible |
||||
Trade name |
||||
Total intangible assets(2)
|
||||
Goodwill |
||||
Total aggregate purchase price |
||||
Liability for holdback payments |
( |
) |
||
Payment for acquisition, net of cash acquired |
$ |
|||
(1) Net tangible assets acquired consisted primarily of accounts receivable, costs and earnings in excess of billings and accounts payable outstanding as of the date of acquisition.
2015 acquisitions – During 2015, we completed the following acquisitions that were included within our Small Business Services segment:
• |
In January 2015, we acquired selected assets of Range, Inc., a marketing services provider. |
• |
In February 2015, we acquired selected assets of Verify Valid LLC, a provider of electronic check payment services. The allocation of the purchase price based upon the estimated fair values of the assets acquired and liabilities assumed resulted in tax-deductible goodwill of $ |
• |
In August 2015, we acquired selected assets of Tech Assets, Inc., a provider of shared hosting websites to small businesses using cPanel web hosting technology. The allocation of the purchase price based upon the estimated fair values of the assets acquired and liabilities assumed resulted in tax-deductible goodwill of $ |
• |
In September 2015, we acquired selected assets of FMC Resource Management Corporation, a marketing services provider. |
During 2015, we completed the following acquisitions that were included within our Financial Services segment:
• |
In October 2015, we acquired all of the equity of Datamyx LLC, a provider of risk-based, data-driven marketing solutions. The allocation of the purchase price based upon the estimated fair values of the assets acquired and liabilities assumed resulted in tax-deductible goodwill of $ |
• |
In December 2015, we acquired substantially all of the assets of FISC Solutions, a provider of back-office treasury management and outsourcing solutions. |
67
DELUXE CORPORATION
NOTES TO CONSOLIDATED FINANCIAL STATEMENTS
(dollars in thousands, except per share amounts)
(in thousands) |
Datamyx LLC |
|||
Net tangible assets acquired and liabilities assumed(1)
|
$ |
|||
Identifiable intangible assets: |
||||
Customer list/relationships |
||||
Internal-use software |
||||
Trade name |
||||
Total intangible assets(2)
|
||||
Goodwill |
||||
Payment for acquisition, net of cash acquired |
$ |
|||
(1) Net tangible assets acquired consisted primarily of accounts receivable outstanding as of the date of acquisition.
During 2015, we also acquired the operations of 8 small business distributors, 6 of which were included within our Small Business Services segment and 2 of which were included in our Financial Services segment, as their customers were mainly financial institutions. The assets acquired consisted primarily of customer list intangible assets. The acquired Financial Services distributors and all but 2 of the acquired Small Business Services distributors were previously part of our Safeguard distributor network. The allocation of the purchase price based upon the estimated fair values of the assets acquired and liabilities assumed resulted in tax-deductible goodwill of $9,285 related to one of the Small Business Services distributors. This acquisition resulted in goodwill as we expected to accelerate revenue growth in business and marketing communications solutions by adding an established customer base that gave us a larger presence in the western United States.
68
DELUXE CORPORATION
NOTES TO CONSOLIDATED FINANCIAL STATEMENTS
(dollars in thousands, except per share amounts)
Aggregate information – Information regarding the useful lives of acquired intangibles and goodwill by reportable business segment can be found in Note 2. Information regarding the calculation of the estimated fair values of the acquired intangibles can be found in Note 7. As our acquisitions were immaterial to our reported operating results both individually and in the aggregate, pro forma results of operations are not provided. The following illustrates the allocation of the aggregate purchase price for the above acquisitions to the assets acquired and liabilities assumed, reduced for any cash or cash equivalents acquired with the acquisitions.
(in thousands) |
2017 acquisitions(1)
|
2016 acquisitions(2)
|
2015 acquisitions(3)
|
|||||||||
Net tangible assets acquired and liabilities assumed |
$ |
$ |
$ |
|||||||||
Identifiable intangible assets: |
||||||||||||
Customer lists/relationships |
||||||||||||
Trade names |
||||||||||||
Software to be sold |
||||||||||||
Technology-based intangibles |
||||||||||||
Internal-use software |
||||||||||||
Total intangible assets |
||||||||||||
Goodwill |
||||||||||||
Total aggregate purchase price |
||||||||||||
Liabilities for holdback payments and contingent consideration(4)
|
( |
) |
( |
) |
( |
) |
||||||
Non-cash consideration(5)
|
( |
) |
( |
) |
||||||||
Net cash paid for current year acquisitions |
||||||||||||
Holdback payments for prior year acquisitions |
||||||||||||
Payments for acquisitions, net of cash acquired(6)
|
$ |
$ |
$ |
|||||||||
(1) Net tangible assets acquired and liabilities assumed for 2017 consisted primarily of accounts receivable, marketable securities, inventory and accrued liabilities of RDM and Digital Pacific.
(2) Net tangible assets acquired and liabilities assumed for 2016 included funds held for customers of $12,532 and the corresponding liability for the same amount related to the acquisition of Payce, Inc., as well as accounts receivable, costs and earnings in excess of billings and accounts payable of FMCG. Amounts include measurement-period adjustments recorded in 2017 for the finalization of purchase accounting for several of the 2016 acquisitions. These adjustments decreased goodwill $2,130 , with the offset to various assets and liabilities, including other current assets, accounts payable and intangibles, including an increase of $3,000 in acquired technology-based intangibles and a decrease of $1,924 in customer list intangibles.
(3) Includes measurement-period adjustments recorded in 2016 for the finalization of purchase accounting for the Datamyx and FISC Solutions acquisitions. These adjustments increased Datamyx goodwill $172 from the preliminary amount recorded as of December 31, 2015, with the offset to to various assets and liabilities, primarily property, plant and equipment and other current assets. Acquisition measurement-period adjustments recorded in 2016 for the acquisition of FISC Solutions consisted of recording an asset for funds held for customers of $18,743 and the corresponding liability for the same amount, as well as an increase of $79 in the value of the acquired customer list.
(4) Consists of holdback payments due at future dates and liabilities for contingent consideration. Further information regarding liabilities for contingent consideration can be found in Note 7.
(5) Consists of pre-acquisition amounts owed to us by certain of the acquired businesses.
Note 6: Derivative financial instruments
69
DELUXE CORPORATION
NOTES TO CONSOLIDATED FINANCIAL STATEMENTS
(dollars in thousands, except per share amounts)
Note 7: Fair value measurements
Annual asset impairment analyses – We evaluate the carrying value of goodwill and our indefinite-lived trade name as of July 31 of each year and between annual evaluations if events occur or circumstances change that would indicate a possible impairment. Our policy on impairment of indefinite-lived intangibles and goodwill, which is included in Note 1, explains our methodology for assessing impairment of these assets.
In conjunction with our annual strategic planning process during the third quarter of 2017, we made various changes to our internal reporting structure. As a result, we reassessed our operating segments and determined that no changes were required in our reportable operating segments. We also reassessed our previously determined reporting units and concluded that a realignment of a portion of our reporting units was required. As such, we reallocated the carrying value of goodwill to our revised reporting units based on their relative fair values. We analyzed goodwill for impairment immediately prior to this realignment by performing qualitative analyses for our Small Business Services reporting units and quantitative analyses for our Financial Services and Direct Checks reporting units. The qualitative analyses evaluated factors including, but not limited to, economic, market and industry conditions, cost factors and the overall financial performance of the reporting units. We also considered the last quantitative analysis we completed. In completing these assessments, we noted no changes in events or circumstances that indicated that it was more likely than not that the fair value of any reporting unit was less than its carrying amount, with the exception of our Small Business Services Safeguard reporting unit. The analysis of this reporting unit, which incorporated the results of the annual strategic planning process, indicated lowered projected long-term revenue growth and profitability levels resulting from changes in market trends and the mix of products and services sold, including the continuing decline in check and forms usage. As a result, we completed impairment analyses of the long-term assets of this reporting unit, excluding goodwill, and concluded that these assets were not impaired. We then completed the quantitative analysis of the reporting unit, utilizing the income approach outlined in Note 1. This quantitative analysis indicated that this reporting unit's goodwill was fully impaired and resulted in a non-cash pre-tax goodwill impairment charge of $28,379 during the quarter ended September 30, 2017. In accordance with ASU No. 2017-04, which we adopted on January 1, 2017, the impairment charge was measured as the amount by which the reporting unit's carrying value exceeded its estimated fair value. Further information regarding this accounting pronouncement can be found in Note 1. Immediately subsequent to the realignment of our reporting unit structure, we completed a quantitative analysis for all of our reporting units to which goodwill is assigned. This quantitative analysis as of July 31, 2017 indicated that the estimated fair values of our reporting units exceeded their carrying values by approximate amounts between $64,000 and $1,405,000 , or by amounts between 36 % and 314 % above the carrying values of their net assets.
In completing the 2017 annual impairment analysis of our indefinite-lived trade name, we elected to perform a quantitative assessment which indicated that the calculated fair value of the asset exceeded its carrying value of $19,100 by approximately $16,000 as of July 31, 2017.
In completing the 2016 and 2015 annual goodwill impairment analyses, we elected to perform qualitative assessments for all of our reporting units to which goodwill is assigned, with one exception. We elected to perform quantitative analyses for our Financial Services Commercial reporting unit. This reporting unit was acquired subsequent to our 2014 annual impairment analysis and the quantitative analysis completed as of July 31, 2015 indicated that the estimated fair value of this reporting unit exceeded its carrying value by approximately 13 %. The quantitative assessment completed for this reporting unit as of July 31, 2016 indicated that its estimated fair value exceeded its carrying value by approximately 49 %. Total goodwill for this reporting unit was approximately $45,000 as of the date of the 2016 assessment.
Our qualitative analyses completed during 2016 and 2015 evaluated factors including, but not limited to, economic, market and industry conditions, cost factors and the overall financial performance of the reporting units. We also considered the quantitative analysis we completed as of July 31, 2014. In completing these assessments, we noted no changes in events or circumstances which indicated that it was more likely than not that the fair value of any reporting unit was less than its carrying amount. Based on the results of our annual impairment analyses, we recorded no impairment charges during 2016 or 2015.
Non-recurring asset impairment analyses – During 2017, we recorded aggregate pre-tax asset impairment charges of $8,250 related to a small business distributor that was classified as held for sale in the consolidated balance sheets prior to its sale during the second quarter of 2017. The impairment charges were calculated based on on-going negotiations for the sale of the business and reduced its carrying value to its fair value less costs to sell by reducing the carrying value of the related customer list intangible asset. Further information regarding assets held for sale can be found in Note 2.
During the quarter ended September 30, 2017, we decided that we would no longer utilize our Small Business Services NEBS® trade name in the marketplace, and we recorded a non-cash pre-tax asset impairment charge of $14,752 to write down the remaining book value of this trade name to a fair value of $0 . Also during the quarter ended September 30, 2017, we recorded pre-tax asset impairment charges of $3,499 related to other long-lived assets within Small Business Services, primarily internal-use software related to an order capture system. During the third quarter of 2017, we signed a contract for customer relationship management services that resulted in our decision to no longer utilize a portion of this software. As such, the remaining net book value of the assets was written down to a fair value of $0 .
70
DELUXE CORPORATION
NOTES TO CONSOLIDATED FINANCIAL STATEMENTS
(dollars in thousands, except per share amounts)
Fair value measurements using |
||||||||||||||||||||
|
Fair value as of
measurement date
|
Quoted prices in active markets for identical assets |
Significant other observable inputs |
Significant unobservable inputs |
Asset impairment charge |
||||||||||||||||
(in thousands) |
(Level 1) |
(Level 2) |
(Level 3) |
|||||||||||||||||
Trade name |
$ |
$ |
— |
$ |
— |
$ |
$ |
|||||||||||||
Assets held for sale |
— |
— |
||||||||||||||||||
Other |
— |
— |
||||||||||||||||||
Total |
$ |
|||||||||||||||||||
The estimated fair value of the acquired technology-based intangibles and a portion of the acquired software was estimated using the relief from royalty method, which calculates the cost savings associated with owning rather than licensing the technology. Assumed royalty rates were applied to projected revenue for the remaining useful life of the technology to estimate the royalty savings. The fair value of the remainder of the acquired software was estimated using the cost of reproduction method. The primary components of the software were identified and the estimated cost to reproduce the software was calculated based on historical data provided by the acquirees.
For liabilities for contingent consideration recorded in conjunction with our acquisitions, we determined the fair value as of the acquisition dates by discounting to present value the probability-weighted contingent payments expected to be made. Key assumptions used in these calculations included the discount rate; projected revenue, gross profit or operating income, as appropriate, based on our most recent internal forecast; and factors indicating the probability of achieving the forecasted revenue, gross profit or operating income. The liabilities for contingent consideration related primarily to the acquisitions of Verify Valid and a small business distributor during 2015 and the acquisition of Data Support Systems during 2016. Under the Verify Valid and Data Support Systems agreements, there are no maximum amounts of contingent payments specified , although payments are based on a percentage of the revenue or operating income generated by the business.
Recurring fair value measurements – Funds held for customers included cash equivalents and available-for-sale marketable securities (Note 2). The cash equivalents consisted of a money market fund investment that is traded in an active market. Because of the short-term nature of the underlying investments, the cost of this investment approximates its fair value. Available-for-sale securities consisted of a mutual fund investment that invests in Canadian and provincial government securities and investments in Canadian guaranteed investment certificates (GIC's) with maturities of 1 year or less. The mutual fund is not traded in an active market and its fair value is determined by obtaining quoted prices in active markets for the underlying securities held by the fund. The fair value of the GIC's approximated cost due to their relatively short duration. Unrealized gains and losses, net of tax, are included in accumulated other comprehensive loss in the consolidated balance sheets. The cost of securities sold is determined using the average cost method. Realized gains and losses are included in revenue in the consolidated statements of income and were not significant during the past 3 years.
The fair value of accrued contingent consideration is remeasured each reporting period. Increases or decreases in projected revenue, gross profit or operating income, as appropriate, and the related probabilities of achieving the forecasted results, may result in a higher or lower fair value measurement. Changes in fair value resulting from changes in the timing, amount of, or likelihood of contingent payments are included in SG&A expense in the consolidated statements of income. Changes in fair value resulting from accretion for the passage of time are included in interest expense in the consolidated statements of income.
71
DELUXE CORPORATION
NOTES TO CONSOLIDATED FINANCIAL STATEMENTS
(dollars in thousands, except per share amounts)
(in thousands) |
2017 |
2016 |
2015 |
|||||||||
Balance, beginning of year |
$ |
$ |
$ |
|||||||||
Acquisition date fair value |
||||||||||||
Change in fair value |
( |
) |
||||||||||
Payments |
( |
) |
( |
) |
( |
) |
||||||
Balance, end of year |
$ |
$ |
$ |
|||||||||
The fair value of interest rate swaps outstanding during 2016 and 2015 (Note 6) was determined at each reporting date by means of a pricing model utilizing readily observable market interest rates. The change in fair value was determined as the change in the present value of estimated future cash flows discounted using the LIBOR rate. The interest rate swaps related to our long-term debt due in 2020 that we settled during the fourth quarter of 2016. The swaps met the criteria for using the short-cut method for a fair value hedge based on the structure of the hedging relationship. As such, the changes in the fair value of the derivative and the related long-term debt were equal and were as follows:
(in thousands) |
2016 |
2015 |
||||||
Gain from derivatives |
$ |
$ |
||||||
Loss from change in fair value of hedged debt |
( |
) |
( |
) |
||||
Net effect on interest expense |
$ |
$ |
||||||
Fair value measurements using |
||||||||||||||||
|
Fair value as of
December 31, 2017
|
Quoted prices in active markets for identical assets |
Significant other observable inputs |
Significant unobservable inputs |
|||||||||||||
(in thousands) |
(Level 1) |
(Level 2) |
(Level 3) |
|||||||||||||
Cash equivalents (funds held for customers) |
$ |
$ |
$ |
— |
$ |
— |
||||||||||
Available-for-sale marketable securities (funds held for customers) |
— |
— |
||||||||||||||
Accrued contingent consideration |
( |
) |
— |
— |
( |
) |
||||||||||
Fair value measurements using |
||||||||||||||||
|
Fair value as of
December 31, 2016
|
Quoted prices in active markets for identical assets |
Significant other
observable inputs
|
Significant unobservable inputs |
|||||||||||||
(in thousands) |
(Level 1) |
(Level 2) |
(Level 3) |
|||||||||||||
Cash equivalents (funds held for customers) |
$ |
$ |
$ |
— |
$ |
— |
||||||||||
Available-for-sale marketable securities (funds held for customers) |
— |
— |
||||||||||||||
Accrued contingent consideration |
( |
) |
— |
— |
( |
) |
||||||||||
Fair value measurements of other financial instruments – The following methods and assumptions were used to estimate the fair value of each class of financial instrument for which it is practicable to estimate fair value.
Cash and cash included within funds held for customers – The carrying amounts reported in the consolidated balance sheets approximate fair value because of the short-term nature of these items.
Loans and notes receivable from Safeguard distributors – We have receivables for loans made to certain of our Safeguard distributors. In addition, we have acquired the operations of several small business distributors which we then sold to our Safeguard distributors. In most cases, we entered into notes receivable upon the sale of these assets. The fair value of these
72
DELUXE CORPORATION
NOTES TO CONSOLIDATED FINANCIAL STATEMENTS
(dollars in thousands, except per share amounts)
loans and notes receivables is calculated as the present value of expected future cash flows, discounted using an estimated interest rate based on published bond yields for companies of similar risk.
Long-term debt – Information regarding the composition of our long-term debt can be found in Note 13. The carrying amounts reported in the consolidated balance sheets for amounts drawn under our revolving credit facility and our term loan facility, excluding unamortized debt issuance costs, approximate fair value because our interest rates are variable and reflect current market rates.
Fair value measurements using |
||||||||||||||||||||
December 31, 2017 |
Quoted prices in active markets for identical assets |
Significant other observable inputs |
Significant unobservable inputs |
|||||||||||||||||
(in thousands) |
Carrying value |
Fair value |
(Level 1) |
(Level 2) |
(Level 3) |
|||||||||||||||
Cash |
$ |
$ |
$ |
$ |
— |
$ |
— |
|||||||||||||
Cash (funds held for customers) |
— |
— |
||||||||||||||||||
Loans and notes receivable from Safeguard distributors |
— |
— |
||||||||||||||||||
Long-term debt(1)
|
— |
— |
||||||||||||||||||
(1) Amounts exclude capital lease obligations.
Fair value measurements using |
||||||||||||||||||||
December 31, 2016 |
Quoted prices in active markets for identical assets |
Significant other observable inputs |
Significant unobservable inputs |
|||||||||||||||||
(in thousands) |
Carrying value |
Fair value |
(Level 1) |
(Level 2) |
(Level 3) |
|||||||||||||||
Cash |
$ |
$ |
$ |
$ |
— |
$ |
— |
|||||||||||||
Cash (funds held for customers) |
— |
— |
||||||||||||||||||
Loans and notes receivable from Safeguard distributors |
— |
— |
||||||||||||||||||
Long-term debt(1)
|
— |
— |
||||||||||||||||||
Note 8: Restructuring charges
(dollars in thousands) |
2017 |
2016 |
2015 |
|||||||||
Severance accruals |
$ |
$ |
$ |
|||||||||
Severance reversals |
( |
) |
( |
) |
( |
) |
||||||
Operating lease obligations |
||||||||||||
Net restructuring accruals |
||||||||||||
Other costs |
||||||||||||
Net restructuring charges |
$ |
$ |
$ |
|||||||||
Number of employees included in severance accruals |
||||||||||||
73
DELUXE CORPORATION
NOTES TO CONSOLIDATED FINANCIAL STATEMENTS
(dollars in thousands, except per share amounts)
The net restructuring charges for the years ended December 31 are reflected in the consolidated statements of income as follows:
(in thousands) |
2017 |
2016 |
2015 |
|||||||||
Total cost of revenue |
$ |
$ |
$ |
|||||||||
Operating expenses |
||||||||||||
Net restructuring charges |
$ |
$ |
$ |
|||||||||
In each of the past 3 years, the net restructuring accruals included severance charges related to employee reductions across functional areas as we continued to reduce costs, primarily within our sales and marketing, information technology and fulfillment functions. These charges were reduced by the reversal of restructuring accruals, as fewer employees received severance benefits than originally estimated. Other restructuring costs, which were expensed as incurred, included items such as information technology costs, employee and equipment moves, training and travel related to our restructuring and integration activities.
Restructuring accruals of $4,380 as of December 31, 2017 and $4,181 as of December 31, 2016 are reflected in the consolidated balance sheets as accrued liabilities. The majority of the employee reductions are expected to be completed by mid-2018, and we expect most of the related severance payments to be paid by the third quarter of 2018, utilizing cash from operations. As of December 31, 2017, approximately 15 employees had not yet started to receive severance benefits.
(in thousands) |
2017
initiatives
|
2016
initiatives
|
2015
initiatives
|
2012 - 2014
initiatives
|
Total |
|||||||||||||||
Balance, December 31, 2014 |
$ |
$ |
$ |
$ |
$ |
|||||||||||||||
Restructuring charges |
||||||||||||||||||||
Restructuring reversals |
( |
) |
( |
) |
( |
) |
||||||||||||||
Payments |
( |
) |
( |
) |
( |
) |
||||||||||||||
Balance, December 31, 2015 |
||||||||||||||||||||
Restructuring charges |
||||||||||||||||||||
Restructuring reversals |
( |
) |
( |
) |
( |
) |
( |
) |
||||||||||||
Payments |
( |
) |
( |
) |
( |
) |
( |
) |
||||||||||||
Balance, December 31, 2016 |
||||||||||||||||||||
Restructuring charges |
||||||||||||||||||||
Restructuring reversals |
( |
) |
( |
) |
( |
) |
( |
) |
||||||||||||
Payments |
( |
) |
( |
) |
( |
) |
( |
) |
||||||||||||
Balance, December 31, 2017 |
$ |
$ |
$ |
$ |
$ |
|||||||||||||||
Cumulative amounts: |
||||||||||||||||||||
Restructuring charges |
$ |
$ |
$ |
$ |
$ |
|||||||||||||||
Restructuring reversals |
( |
) |
( |
) |
( |
) |
( |
) |
( |
) |
||||||||||
Payments |
( |
) |
( |
) |
( |
) |
( |
) |
( |
) |
||||||||||
Balance, December 31, 2017 |
$ |
$ |
$ |
$ |
$ |
|||||||||||||||
74
DELUXE CORPORATION
NOTES TO CONSOLIDATED FINANCIAL STATEMENTS
(dollars in thousands, except per share amounts)
Employee severance benefits |
Operating lease obligations |
|||||||||||||||||||||||||||||||
(in thousands) |
Small Business Services |
Financial Services |
Direct Checks |
Corporate(1)
|
Small Business Services |
Financial Services |
Direct Checks |
Total |
||||||||||||||||||||||||
Balance, December 31, 2014 |
$ |
$ |
$ |
$ |
$ |
$ |
$ |
$ |
||||||||||||||||||||||||
Restructuring charges |
||||||||||||||||||||||||||||||||
Restructuring reversals |
( |
) |
( |
) |
( |
) |
( |
) |
||||||||||||||||||||||||
Inter-segment transfer |
( |
) |
( |
) |
||||||||||||||||||||||||||||
Payments |
( |
) |
( |
) |
( |
) |
( |
) |
( |
) |
( |
) |
||||||||||||||||||||
Balance, December 31, 2015 |
||||||||||||||||||||||||||||||||
Restructuring charges |
||||||||||||||||||||||||||||||||
Restructuring reversals |
( |
) |
( |
) |
( |
) |
( |
) |
( |
) |
||||||||||||||||||||||
Payments |
( |
) |
( |
) |
( |
) |
( |
) |
( |
) |
( |
) |
( |
) |
||||||||||||||||||
Balance, December 31, 2016 |
||||||||||||||||||||||||||||||||
Restructuring charges |
||||||||||||||||||||||||||||||||
Restructuring reversals |
( |
) |
( |
) |
( |
) |
( |
) |
( |
) |
||||||||||||||||||||||
Payments |
( |
) |
( |
) |
( |
) |
( |
) |
( |
) |
( |
) |
||||||||||||||||||||
Balance, December 31, 2017 |
$ |
$ |
$ |
$ |
$ |
$ |
$ |
$ |
||||||||||||||||||||||||
Cumulative amounts(2):
|
||||||||||||||||||||||||||||||||
Restructuring charges |
$ |
$ |
$ |
$ |
$ |
$ |
$ |
$ |
||||||||||||||||||||||||
Restructuring reversals |
( |
) |
( |
) |
( |
) |
( |
) |
( |
) |
( |
) |
||||||||||||||||||||
Inter-segment transfer |
( |
) |
( |
) |
( |
) |
||||||||||||||||||||||||||
Payments |
( |
) |
( |
) |
( |
) |
( |
) |
( |
) |
( |
) |
( |
) |
( |
) |
||||||||||||||||
Balance, December 31, 2017 |
$ |
$ |
$ |
$ |
$ |
$ |
$ |
$ |
||||||||||||||||||||||||
(1) As discussed in Note 16, corporate costs are allocated to our business segments. As such, the net corporate restructuring charges are reflected in the business segment operating income presented in Note 16 in accordance with our allocation methodology.
75
DELUXE CORPORATION
NOTES TO CONSOLIDATED FINANCIAL STATEMENTS
(dollars in thousands, except per share amounts)
Note 9: Income tax provision
(in thousands) |
2017 |
2016 |
2015 |
|||||||||
United States |
$ |
$ |
$ |
|||||||||
Foreign |
||||||||||||
Income before income taxes |
$ |
$ |
$ |
|||||||||
(in thousands) |
2017 |
2016 |
2015 |
|||||||||
Current tax provision: |
||||||||||||
Federal |
$ |
$ |
$ |
|||||||||
State |
||||||||||||
Foreign |
||||||||||||
Total current tax provision |
||||||||||||
Deferred tax provision: |
||||||||||||
Federal |
( |
) |
( |
) |
||||||||
State |
( |
) |
||||||||||
Foreign |
( |
) |
( |
) |
( |
) |
||||||
Total deferred tax provision |
( |
) |
( |
) |
||||||||
Income tax provision |
$ |
$ |
$ |
|||||||||
2017 |
2016 |
2015 |
|||||||
Income tax at federal statutory rate |
% |
% |
% |
||||||
State income tax expense, net of federal income tax benefit |
% |
% |
% |
||||||
Goodwill impairment charge |
% |
||||||||
Impact of Tax Cuts and Jobs Act |
( |
%) |
|||||||
Qualified production activities deduction |
( |
%) |
( |
%) |
( |
%) |
|||
Net tax benefit of share-based compensation |
( |
%) |
( |
%) |
|||||
Other |
( |
%) |
( |
%) |
( |
%) |
|||
Effective tax rate |
% |
% |
% |
||||||
Reasonable estimates were used in determining many components of the impact of the 2017 Act, including our 2017 deferred activity and the amount of post-1986 foreign deferred earnings subject to the toll charge. We are still analyzing certain aspects of the 2017 Act and refining our calculations, which could potentially affect the measurement of our deferred tax balances and the amount of the toll charge liability, and ultimately cause us to revise our initial estimates in future periods. In addition, changes in interpretations, assumptions and guidance regarding the new tax legislation, as well as the potential for technical corrections to the 2017 Act, could have a material impact on our effective tax rate in future periods.
76
DELUXE CORPORATION
NOTES TO CONSOLIDATED FINANCIAL STATEMENTS
(dollars in thousands, except per share amounts)
In order to complete our accounting for the 2017 Act, which we expect to finalize by the fourth quarter of 2018, the following specific items need to be completed or addressed:
• |
Issuance of state-by-state guidance regarding conformity with or decoupling from the 2017 Act. |
• |
Finalize the calculation of post-1986 foreign deferred earnings, which are subject to the toll charge, and determine our ability to beneficially claim a foreign tax credit resulting from the income inclusion. |
• |
Where pertinent, adjust to clarifications and guidance regarding other aspects of the 2017 Act, including those related to executive compensation. |
(in thousands) |
2017 |
2016 |
2015 |
|||||||||
Balance, beginning of year |
$ |
$ |
$ |
|||||||||
Additions for tax positions of current year |
||||||||||||
Additions for tax positions of prior years |
||||||||||||
Reductions for tax positions of prior years |
( |
) |
( |
) |
( |
) |
||||||
Settlements |
( |
) |
||||||||||
Lapse of statutes of limitations |
( |
) |
( |
) |
( |
) |
||||||
Balance, end of year |
$ |
$ |
$ |
|||||||||
The statute of limitations for federal tax assessments for 2013 and prior years has expired. Audits of our federal income tax returns for 2013 through 2015 have been completed by the Internal Revenue Service (IRS). Our 2016 return and our 2017 return, when filed, are subject to IRS examination. In general, income tax returns for the years 2013 through 2017 remain subject to examination by foreign, state and city tax jurisdictions. In the event that we have determined not to file income tax returns with a particular state or city, all years remain subject to examination by the tax jurisdiction.
The ultimate outcome of tax matters may differ from our estimates and assumptions. Unfavorable settlement of any particular issue would require the use of cash and could result in increased income tax expense. Favorable resolution would result in reduced income tax expense.
77
DELUXE CORPORATION
NOTES TO CONSOLIDATED FINANCIAL STATEMENTS
(dollars in thousands, except per share amounts)
2017 |
2016 |
|||||||||||||||
(in thousands) |
Deferred tax assets |
Deferred tax liabilities |
Deferred tax assets |
Deferred tax liabilities |
||||||||||||
Goodwill |
$ |
— |
$ |
$ |
— |
$ |
||||||||||
Property, plant and equipment |
||||||||||||||||
Intangible assets |
— |
— |
||||||||||||||
Prepaid assets |
— |
— |
||||||||||||||
Installment sales treatment of notes receivable |
— |
— |
||||||||||||||
Deferred advertising costs |
— |
— |
||||||||||||||
Early extinguishment of debt |
— |
— |
||||||||||||||
Employee benefit plans |
— |
— |
||||||||||||||
Reserves and accruals |
— |
— |
||||||||||||||
Net operating loss, capital loss and tax credit carryforwards |
— |
— |
||||||||||||||
Inventories |
— |
— |
||||||||||||||
Federal benefit of state uncertain tax positions |
— |
— |
||||||||||||||
All other |
||||||||||||||||
Total deferred taxes |
||||||||||||||||
Valuation allowances |
( |
) |
— |
( |
) |
— |
||||||||||
Net deferred taxes |
$ |
$ |
$ |
$ |
||||||||||||
The valuation allowances as of December 31, 2017 and December 31, 2016 related primarily to capital loss carryforwards in Canada and net operating loss carryforwards in various state jurisdictions that we do not currently expect to fully realize. The provision for income taxes included benefits of $1,015 for 2017 and $302 for 2016 and charges of $140 for 2015 related to changes in the valuation allowances. The remainder of the change in the valuation allowances was attributable to foreign currency translation.
As of December 31, 2017, we intend to indefinitely reinvest the undistributed earnings of our subsidiaries located outside of the United States and, therefore, no deferred income taxes have been recognized for the tax effects of repatriation. After enactment of the 2017 Act, the tax effects would generally be limited to foreign withholding taxes on any distributions. As of December 31, 2017, the amount of cash and cash equivalents held by our foreign subsidiaries was $40,022 , primarily in Canada.
As of December 31, 2017, we had the following net operating loss, capital loss and tax credit carryforwards:
• |
State net operating loss carryforwards of $ |
• |
Foreign capital loss and net operating loss carryforwards of $ |
• |
Foreign research tax credit and net operating loss carryforwards of $ |
• |
Note 10: Share-based compensation plans
Our employee share-based compensation plans consist of our employee stock purchase plan and our long-term incentive plan. Effective May 2, 2017, our shareholders approved the Deluxe Corporation 2017 Long-Term Incentive Plan, simultaneously terminating our previous plan. Under this plan, 5.0 million shares of common stock plus any shares released as a result of the forfeiture or termination of awards issued under our prior plan are reserved for issuance, with 6.4 million shares remaining available for issuance as of December 31, 2017. Full value awards such as restricted stock, restricted stock units and performance share awards reduce the number of shares available for issuance by a factor of 2.23 , or if such an award were forfeited or terminated without delivery of the shares, the number of shares that again become eligible for issuance would be multiplied by a factor of 2.23 . Under our current and previous plans, we have granted non-qualified stock options, restricted stock units, restricted shares and performance share awards. Our current plan also allows for the issuance of stock appreciation rights, which we have not granted as of December 31, 2017. Our policies regarding the recognition of compensation expense for employee share-based awards can be found in Note 1.
78
DELUXE CORPORATION
NOTES TO CONSOLIDATED FINANCIAL STATEMENTS
(dollars in thousands, except per share amounts)
(in thousands) |
2017 |
2016 |
2015 |
|||||||||
Restricted shares and restricted stock units |
$ |
$ |
$ |
|||||||||
Performance share awards |
||||||||||||
Stock options |
||||||||||||
Employee stock purchase plan |
||||||||||||
Total share-based compensation expense |
$ |
$ |
$ |
|||||||||
Income tax benefit |
$ |
( |
) |
$ |
( |
) |
$ |
( |
) |
|||
As of December 31, 2017, the total compensation expense for unvested awards not yet recognized in our consolidated statements of income was $14,090 , net of the effect of estimated forfeitures. This amount is expected to be recognized over a weighted-average period of 1.7 years.
Non-qualified stock options – All options allow for the purchase of shares of common stock at prices equal to the stock's market value at the date of grant. Options become exercisable beginning 1 year after the grant date, with one-third vesting each year over 3 years. Options may be exercised up to 7 years following the date of grant. Beginning 1 year after the grant date, in the case of qualified retirement, death or disability, options vest immediately and the period over which the options can be exercised is shortened. Beginning 1 year after the grant date, in the case of involuntary termination without cause, a pro-rata portion of the options vest immediately and the period over which the options can be exercised is shortened. For options granted prior to 2013, in the case of involuntary termination without cause, all options vest immediately and the period over which the options can be exercised is shortened. Employees forfeit unvested options when they voluntarily terminate their employment with the company, and they have up to 3 months to exercise vested options before they are canceled. In the case of involuntary termination with cause, the entire unexercised portion of the award is canceled. All options may vest immediately upon a change of control, as defined in the award agreement. The following weighted-average assumptions were used in the Black-Scholes option pricing model in determining the fair value of stock options granted:
2017 |
2016 |
2015 |
|||||||
Risk-free interest rate |
% |
% |
% |
||||||
Dividend yield |
% |
% |
% |
||||||
Expected volatility |
% |
% |
% |
||||||
Weighted-average option life (in years) |
|||||||||
The risk-free interest rate for periods within the expected option life is based on the United States Treasury yield curve in effect at the grant date. The dividend yield is estimated over the expected life of the option based on historical dividends paid. Expected volatility is based on the historical volatility of our stock over the most recent historical period equivalent to the expected life of the option. The expected life is the average length of time over which we expect the employee groups will exercise their options, based on historical experience with similar grants.
79
DELUXE CORPORATION
NOTES TO CONSOLIDATED FINANCIAL STATEMENTS
(dollars in thousands, except per share amounts)
Each option is convertible into 1 share of common stock upon exercise. Information regarding options issued under the current and all previous plans was as follows:
|
Number of options
(in thousands)
|
Weighted-average exercise price per option |
Aggregate intrinsic value
(in thousands)
|
Weighted-average remaining contractual term
(in years)
|
||||||||||
Outstanding, December 31, 2014 |
$ |
||||||||||||
Granted |
|||||||||||||
Exercised |
( |
) |
|||||||||||
Forfeited or expired |
( |
) |
|||||||||||
Outstanding, December 31, 2015 |
|||||||||||||
Granted |
|||||||||||||
Exercised |
( |
) |
|||||||||||
Forfeited or expired |
( |
) |
|||||||||||
Outstanding, December 31, 2016 |
|||||||||||||
Granted |
|||||||||||||
Exercised |
( |
) |
|||||||||||
Forfeited or expired |
( |
) |
|||||||||||
Outstanding, December 31, 2017 |
$ |
||||||||||||
Exercisable at December 31, 2015 |
$ |
||||||||||||
Exercisable at December 31, 2016 |
|||||||||||||
Exercisable at December 31, 2017 |
$ |
||||||||||||
The weighted-average grant-date fair value of options granted was $12.81 per option for 2017, $9.16 per option for 2016 and $14.97 per option for 2015. The intrinsic value of a stock award is the amount by which the fair value of the underlying stock exceeds the exercise price of the award. The total intrinsic value of options exercised was $11,699 for 2017, $16,043 for 2016 and $6,882 for 2015.
Restricted stock units – Certain management employees have the option to receive a portion of their bonus payment in the form of restricted stock units. When employees elect this payment method, we provide an additional matching amount of restricted stock units equal to 50 % of the restricted stock units earned under the bonus plan. These awards vest 2 years from the date of grant. In the case of qualified retirement, death, disability or change of control, the units vest immediately. In the case of involuntary termination without cause or voluntary termination, employees receive a cash payment for the units earned under the bonus plan, but forfeit the company-provided matching amount.
In addition to awards granted to employees, non-employee members of our board of directors can elect to receive all or a portion of their fees in the form of restricted stock units. Directors are issued shares in exchange for the units upon the earlier of the tenth anniversary of February 1st of the year following the year in which the non-employee director ceases to serve on the board or such other objectively determinable date pre-elected by the director.
80
DELUXE CORPORATION
NOTES TO CONSOLIDATED FINANCIAL STATEMENTS
(dollars in thousands, except per share amounts)
Each restricted stock unit is convertible into 1 share of common stock upon completion of the vesting period. Information regarding our restricted stock units was as follows:
|
Number of units
(in thousands)
|
Weighted-average grant date fair value per unit |
Weighted-average remaining contractual term
(in years)
|
|||||||
Outstanding at December 31, 2014 |
$ |
||||||||
Granted |
|||||||||
Vested |
( |
) |
|||||||
Forfeited |
( |
) |
|||||||
Outstanding at December 31, 2015 |
|||||||||
Granted |
|||||||||
Vested |
( |
) |
|||||||
Forfeited |
( |
) |
|||||||
Outstanding at December 31, 2016 |
|||||||||
Granted |
|||||||||
Vested |
( |
) |
|||||||
Forfeited |
( |
) |
|||||||
Outstanding at December 31, 2017 |
|||||||||
Of the awards outstanding as of December 31, 2017, 21 thousand restricted stock units with a value of $1,592 were included in accrued liabilities and other non-current liabilities in our consolidated balance sheet. As of December 31, 2017, these units had a fair value of $76.84 per unit and a weighted-average remaining contractual term of 5 months.
The total fair value of restricted stock units that vested was $3,161 for 2017, $2,805 for 2016 and $1,970 for 2015. We made cash payments of $421 during 2017, $140 during 2016 and $120 during 2015 to settle share-based liabilities.
Restricted shares – For awards granted to employees under our current long-term incentive plan, one-third of the shares vest each year over 3 years. Such awards granted under our previous plan vest in their entirety at the end of the 3 year vesting period. Restricted shares granted to directors typically have a 1 year vesting period. The restrictions lapse immediately in the case of qualified retirement, death or disability, or in the event of a change in control where replacement securities are not awarded. In the case of involuntary termination without cause, restrictions on a pro-rata portion of the shares lapse based on how much of the vesting period has passed. In the case of voluntary termination of employment or termination with cause, the unvested restricted shares are forfeited.
81
DELUXE CORPORATION
NOTES TO CONSOLIDATED FINANCIAL STATEMENTS
(dollars in thousands, except per share amounts)
|
Number of shares
(in thousands)
|
Weighted-average grant date fair value per share |
Weighted-average remaining contractual term
(in years)
|
|||||||
Unvested at December 31, 2014 |
$ |
||||||||
Granted |
|||||||||
Vested |
( |
) |
|||||||
Forfeited |
( |
) |
|||||||
Unvested at December 31, 2015 |
|||||||||
Granted |
|||||||||
Vested |
( |
) |
|||||||
Forfeited |
( |
) |
|||||||
Unvested at December 31, 2016 |
|||||||||
Granted |
|||||||||
Vested |
( |
) |
|||||||
Forfeited |
( |
) |
|||||||
Unvested at December 31, 2017 |
|||||||||
The total fair value of restricted shares that vested was $7,452 for 2017, $1,398 for 2016 and $925 for 2015.
Performance share awards – Our performance share awards have a 3 -year vesting period and shares will be issued at the end of the vesting period if performance targets relating to revenue and total shareholder return are achieved. If employment is terminated for any reason prior to the 1 -year anniversary of the commencement of the performance period, the award is forfeited. On or after the 1 -year anniversary of the commencement of the performance period, a pro-rata portion of the shares awarded at the end of the performance period would be issued in the case of qualified retirement, death, disability, involuntary termination without cause or resignation for good reason, as defined in the agreement. The following weighted-average assumptions were used in the Monte Carlo simulation model in determining the fair value of market-based performance shares granted:
2017 |
2016 |
2015 |
|||||||
Risk-free interest rate |
% |
% |
% |
||||||
Dividend yield |
% |
% |
% |
||||||
Expected volatility |
% |
% |
% |
||||||
The risk-free interest rate for periods within the expected award life is based on the United States Treasury yield curve in effect at the grant date. The dividend yield is estimated over the expected life of the award based on historical dividends paid. Expected volatility is based on the historical volatility of our stock.
82
DELUXE CORPORATION
NOTES TO CONSOLIDATED FINANCIAL STATEMENTS
(dollars in thousands, except per share amounts)
Information regarding unvested performance shares was as follows:
|
Performance shares
(in thousands)
|
Weighted-average grant date fair value per share |
Weighted-average remaining contractual term
(in years)
|
|||||||
Unvested at December 31, 2014 |
$ |
||||||||
Granted(1)
|
|||||||||
Forfeited |
( |
) |
|||||||
Unvested at December 31, 2015 |
|||||||||
Granted(1)
|
|||||||||
Forfeited |
( |
) |
|||||||
Unvested at December 31, 2016 |
|||||||||
Granted(1)
|
|||||||||
Forfeited |
( |
) |
|||||||
Vested |
( |
) |
|||||||
Adjustment for performance results achieved(2)
|
|||||||||
Unvested at December 31, 2017 |
|||||||||
(1) Reflects awards granted assuming achievement of performance goals at target.
Note 11: Employee compensation plans
Profit sharing/401(k) plan – We maintain a profit sharing/401(k) plan to provide retirement benefits for certain employees. The plan covers a majority of our full-time employees, as well as some part-time employees. Employees are eligible to participate in the plan on the first day of the quarter following their first full year of service.
Profit sharing contributions are made solely by Deluxe and are remitted to the plan's trustee. These contributions vary based on the company's performance. 401(k) contributions are made by both employees and Deluxe. Employees may contribute up to 50 % of eligible wages, subject to Internal Revenue Service limitations and the terms and conditions of the plan. For the majority of employees, we match 100 % of the first 1 % of wages contributed and 50 % of the next 5 % of wages contributed, beginning on the first day of the quarter following an employee's first full year of service. All employee and employer contributions are remitted to the plan's trustee. Benefits provided by the plan are paid from accumulated funds of the trust.
Employees are provided a broad range of investment options to choose from when investing their profit sharing/401(k) plan funds. Investing in our common stock is not one of these options, although funds selected by employees may at times hold our common stock.
Cash bonus programs – We provide short-term cash bonus programs under which employees may receive cash bonus payments based on our performance for a given fiscal year. Payments earned are paid directly to employees shortly after the end of the year. Previously, we also provided a long-term cash bonus program where employees received payments based on specified performance criteria over a 3 -year period. We stopped using the long-term cash bonus program in 2014 when it was replaced with the performance share awards discussed in Note 10. Payments earned under the long-term cash bonus program were paid directly to employees shortly after the end of each 3-year period, with the last payment occurring during 2016.
83
DELUXE CORPORATION
NOTES TO CONSOLIDATED FINANCIAL STATEMENTS
(dollars in thousands, except per share amounts)
(in thousands) |
2017 |
2016 |
2015 |
|||||||||
Performance-based compensation plans(1)
|
$ |
$ |
$ |
|||||||||
401(k) expense |
||||||||||||
Note 12: Postretirement benefits
We have historically provided certain health care benefits for a large number of retired United States employees. Employees hired prior to January 1, 2002 become eligible for benefits if they attain the appropriate years of service and age prior to retirement. Employees hired on January 1, 2002 or later are not eligible to participate in our retiree health care plan. In addition to our retiree health care plan, we also have a supplemental executive retirement plan (SERP) in the United States. The SERP is no longer an active plan. It is not adding new participants and all of the current participants are retired. The SERP has no plan assets, but our obligation is fully funded by investments in company-owned life insurance policies.
84
DELUXE CORPORATION
NOTES TO CONSOLIDATED FINANCIAL STATEMENTS
(dollars in thousands, except per share amounts)
Obligations and funded status – The following tables summarize the change in benefit obligation, plan assets and funded status during 2017 and 2016:
(in thousands) |
Postretirement benefit plan |
Pension plan |
||||||
Change in benefit obligation: |
||||||||
Benefit obligation, December 31, 2015 |
$ |
$ |
||||||
Interest cost |
||||||||
Net actuarial (gain) loss |
( |
) |
||||||
Benefits paid from plan assets and company funds |
( |
) |
( |
) |
||||
Benefit obligation, December 31, 2016 |
||||||||
Interest cost |
||||||||
Net actuarial (gain) loss |
( |
) |
||||||
Benefits paid from plan assets and company funds |
( |
) |
( |
) |
||||
Benefit obligation, December 31, 2017 |
$ |
$ |
||||||
Change in plan assets: |
||||||||
Fair value of plan assets, December 31, 2015 |
$ |
$ |
— |
|||||
Return on plan assets |
— |
|||||||
Benefits paid |
( |
) |
— |
|||||
Fair value of plan assets, December 31, 2016 |
— |
|||||||
Return on plan assets |
— |
|||||||
Benefits paid |
( |
) |
— |
|||||
Fair value of plan assets, December 31, 2017 |
$ |
$ |
— |
|||||
Funded status, December 31, 2016 |
$ |
$ |
( |
) |
||||
Funded status, December 31, 2017 |
$ |
$ |
( |
) |
||||
As of December 31, 2017 and 2016, the accumulated benefit obligation for the SERP equaled its projected benefit obligation.
Postretirement benefit plan |
Pension plan |
|||||||||||||||
(in thousands) |
2017 |
2016 |
2017 |
2016 |
||||||||||||
Other non-current assets |
$ |
$ |
$ |
$ |
||||||||||||
Accrued liabilities |
||||||||||||||||
Other non-current liabilities |
||||||||||||||||
(in thousands) |
2017 |
2016 |
||||||
Unrecognized prior service credit |
$ |
$ |
||||||
Unrecognized net actuarial loss |
( |
) |
( |
) |
||||
Tax effect |
||||||||
Amount recognized in accumulated other comprehensive loss, net of tax |
$ |
( |
) |
$ |
( |
) |
||
The unrecognized prior service credit relates to our postretirement benefit plan and is a result of previous plan amendments that reduced the accumulated postretirement benefit obligation. A reduction is first used to reduce any existing unrecognized prior service cost, then to reduce any remaining unrecognized transition obligation. The excess is the
85
DELUXE CORPORATION
NOTES TO CONSOLIDATED FINANCIAL STATEMENTS
(dollars in thousands, except per share amounts)
unrecognized prior service credit. The prior service credit is being amortized on the straight-line basis over a weighted-average period of 21 years. The amortization period for the prior service credit is the average remaining life expectancy of plan participants at the time of the plan amendment.
The unrecognized net actuarial loss resulted from experience different from that assumed and from changes in assumptions. Unrecognized actuarial gains and losses for our postretirement benefit plan are being amortized over the average remaining life expectancy of inactive plan participants, as a large percentage of the plan participants are classified as inactive. This amortization period is currently 14.7 years.
(in thousands) |
Amounts expected to be recognized |
|||
Prior service credit |
$ |
( |
) |
|
Net actuarial loss |
||||
Total |
$ |
|||
Postretirement benefit income – Postretirement benefit income for the years ended December 31 consisted of the following components:
(in thousands) |
2017 |
2016 |
2015 |
|||||||||
Interest cost |
$ |
$ |
$ |
|||||||||
Expected return on plan assets |
( |
) |
( |
) |
( |
) |
||||||
Amortization of prior service credit |
( |
) |
( |
) |
( |
) |
||||||
Amortization of net actuarial losses |
||||||||||||
Net periodic benefit income |
$ |
( |
) |
$ |
( |
) |
$ |
( |
) |
|||
Postretirement benefit plan |
Pension plan |
|||||||||||
2017 |
2016 |
2017 |
2016 |
|||||||||
Discount rate |
% |
% |
% |
% |
||||||||
In measuring net periodic benefit income for the years ended December 31, the following assumptions were used:
Postretirement benefit plan |
Pension plan |
|||||||||||||||||
2017 |
2016 |
2015 |
2017 |
2016 |
2015 |
|||||||||||||
Discount rate |
% |
% |
% |
% |
% |
% |
||||||||||||
Expected return on plan assets |
% |
% |
% |
— |
— |
— |
||||||||||||
86
DELUXE CORPORATION
NOTES TO CONSOLIDATED FINANCIAL STATEMENTS
(dollars in thousands, except per share amounts)
In determining the expected long-term rate of return on plan assets, we utilize our historical returns and then adjust these returns for estimated inflation and projected market returns. Our inflation assumption is primarily based on analysis of historical inflation data.
2017 |
2016 |
2015 |
||||||||||||||||
Participants under age 65 |
Participants age 65 and older |
Participants under age 65 |
Participants age 65 and older |
Participants under age 65 |
Participants age 65 and older |
|||||||||||||
Health care cost trend rate assumed for next year |
% |
% |
% |
% |
% |
% |
||||||||||||
Rate to which the cost trend rate is assumed to decline (the ultimate trend rate) |
% |
% |
% |
% |
% |
% |
||||||||||||
Year that the rate reaches the ultimate trend rate |
||||||||||||||||||
(in thousands) |
One percentage point increase |
One percentage point decrease |
||||||
Effect on total of service and interest cost |
$ |
$ |
( |
) |
||||
Effect on benefit obligation |
( |
) |
||||||
Plan assets – The allocation of plan assets by asset category as of December 31 was as follows:
Postretirement benefit plan |
||||||
2017 |
2016 |
|||||
U.S. large capitalization equity securities |
% |
% |
||||
Mortgage-backed securities |
% |
% |
||||
International equity securities |
% |
% |
||||
U.S. corporate debt securities |
% |
% |
||||
Government debt securities |
% |
% |
||||
U.S. small and mid-capitalization equity securities |
% |
% |
||||
Total |
% |
% |
||||
Our postretirement benefit plan has assets that are intended to meet long-term obligations. In order to meet these obligations, we employ a total return investment approach that considers cash flow needs and balances long-term projected returns against expected asset risk, as measured using projected standard deviations. Risk tolerance is established through consideration of projected plan liabilities, the plan's funded status, projected liquidity needs and current corporate financial condition.
The target asset allocation percentages for our postretirement benefit plan are based on our liability and asset projections. The targeted allocation of plan assets is 24 % large capitalization equity securities, 55 % fixed income securities, 18 % international equity securities and 3 % small and mid-capitalization equity securities.
87
DELUXE CORPORATION
NOTES TO CONSOLIDATED FINANCIAL STATEMENTS
(dollars in thousands, except per share amounts)
Information regarding fair value measurements of plan assets was as follows:
Fair value measurements using |
||||||||||||||||||||
Quoted prices in active markets for identical assets |
Significant other observable inputs |
Significant unobservable inputs |
Investments measured at net asset value |
Fair value as of
December 31,
2017
|
||||||||||||||||
(in thousands) |
(Level 1) |
(Level 2) |
(Level 3) |
|||||||||||||||||
U.S. large capitalization equity securities |
$ |
$ |
$ |
$ |
$ |
|||||||||||||||
Mortgage-backed securities |
||||||||||||||||||||
International equity securities |
||||||||||||||||||||
U.S. corporate debt securities |
||||||||||||||||||||
Government debt securities |
||||||||||||||||||||
U.S. small and mid-capitalization equity securities |
||||||||||||||||||||
Other debt securities |
||||||||||||||||||||
Plan assets |
$ |
$ |
$ |
$ |
$ |
|||||||||||||||
Fair value measurements using |
||||||||||||||||||||
Quoted prices in active markets for identical assets |
Significant other observable inputs |
Significant unobservable inputs |
Investments measured at net asset value |
Fair value as of
December 31,
2016
|
||||||||||||||||
(in thousands) |
(Level 1) |
(Level 2) |
(Level 3) |
|||||||||||||||||
U.S. large capitalization equity securities |
$ |
$ |
$ |
$ |
$ |
|||||||||||||||
Mortgage-backed securities |
||||||||||||||||||||
International equity securities |
||||||||||||||||||||
U.S. corporate debt securities |
||||||||||||||||||||
Government debt securities |
||||||||||||||||||||
U.S. small and mid-capitalization equity securities |
||||||||||||||||||||
Other debt securities |
||||||||||||||||||||
Plan assets |
$ |
$ |
$ |
$ |
$ |
|||||||||||||||
Cash flows – We made no contributions to plan assets during the past 3 years.
We have fully funded the United States SERP obligation with investments in company-owned life insurance policies. The cash surrender value of these policies is included in long-term investments in the consolidated balance sheets and totaled $6,615 as of December 31, 2017 and $6,362 as of December 31, 2016.
88
DELUXE CORPORATION
NOTES TO CONSOLIDATED FINANCIAL STATEMENTS
(dollars in thousands, except per share amounts)
(in thousands) |
Postretirement benefit plan |
Pension plan |
||||||
2018 |
$ |
$ |
||||||
2019 |
||||||||
2020 |
||||||||
2021 |
||||||||
2022 |
||||||||
2023 - 2027 |
||||||||
Note 13: Debt and lease obligations
(in thousands) |
2017 |
2016 |
||||||
Amount drawn on revolving credit facility |
$ |
$ |
||||||
Amount outstanding under term loan facility |
||||||||
Capital lease obligations |
||||||||
Long-term debt, principal amount |
||||||||
Less unamortized debt issuance costs |
( |
) |
( |
) |
||||
Less current portion of long-term debt |
( |
) |
( |
) |
||||
Long-term debt |
||||||||
Current portion of amount drawn under term loan facility |
||||||||
Current portion of capital lease obligations |
||||||||
Long-term debt due within one year, principal amount |
||||||||
Less unamortized debt issuance costs |
( |
) |
( |
) |
||||
Long-term debt due within one year |
||||||||
Total debt |
$ |
$ |
||||||
Senior notes – In November 2012, we issued $200,000 of 6.0 % senior notes that were scheduled to mature on November 15, 2020 . The notes were issued via a private placement under Rule 144A of the Securities Act of 1933. These notes were subsequently registered with the SEC via a registration statement that became effective on April 3, 2013. Proceeds from the offering, net of offering costs, were $196,340 . These proceeds were used to retire our senior notes that were due in June 2015. In November 2016, we retired all of these notes, realizing a loss on early debt extinguishment of $7,858 during 2016, consisting of a contractual call premium and the write-off of related debt issuance costs. This retirement was funded utilizing a new term loan facility established under our credit facility agreement. As discussed in Note 6, we previously entered into interest rate swaps to hedge these notes. The swaps were terminated in November 2016 at the time of the debt redemption. The cumulative decrease in the fair value of hedged debt as of the date of the termination of $2,842 was recorded as interest expense in the 2016 consolidated statement of income.
In March 2011, we issued $200,000 of 7.0 % senior notes that were scheduled to mature on March 15, 2019 . The notes were issued via a private placement under Rule 144A of the Securities Act of 1933. These notes were subsequently registered with the SEC via a registration statement that became effective on January 10, 2012. Proceeds from the offering, net of offering costs, were $196,195 . These proceeds were used to retire a portion of our senior, unsecured notes due in 2012. In March 2015, we retired all of these notes, realizing a loss on early debt extinguishment of $8,917 during 2015, consisting of a contractual call premium and the write-off of related debt issuance costs. This retirement was funded utilizing our credit facility and a short-term bank loan that we have since repaid.
89
DELUXE CORPORATION
NOTES TO CONSOLIDATED FINANCIAL STATEMENTS
(dollars in thousands, except per share amounts)
Credit facility – As of December 31, 2017, we had a $525,000 revolving credit facility that matures in February 2019. Our quarterly commitment fee ranges from 0.20 % to 0.40 % based on our leverage ratio. As of December 31, 2017, $413,000 was drawn on our revolving credit facility at a weighted-average interest rate of 2.98 %. As of December 31, 2016, $428,000 was drawn on our revolving credit facility at a weighted-average interest rate of 2.22 %.
During 2016, we amended the credit agreement governing our credit facility to include a new variable rate term loan facility in the aggregate amount of $330,000 . We borrowed the full amount during the fourth quarter of 2016, using the proceeds to retire our senior notes due in 2020 and to partially fund the acquisition of FMCG in December 2016 (Note 5). The term loan facility matures in February 2019 and requires periodic principal payments throughout the term of the loan. Interest is paid weekly and we may prepay the term loan facility in full or in part at our discretion. Amounts repaid may not be reborrowed. As of December 31, 2017, $294,938 was outstanding under the term loan facility at a weighted-average interest rate of 2.99 %. As of December 31, 2016, $330,000 was outstanding under the term loan facility at a weighted-average interest rate of 2.27 %.
Borrowings under the credit agreement are collateralized by substantially all of our personal and intangible property. The credit agreement governing our credit facility contains customary covenants regarding limits on levels of subsidiary indebtedness and capital expenditures, liens, investments, acquisitions, certain mergers, certain asset sales outside the ordinary course of business, and change in control as defined in the agreement. The agreement also contains financial covenants regarding our leverage ratio, interest coverage and liquidity.
(in thousands) |
2017 |
2016 |
2015 |
|||||||||
Revolving credit facility: |
||||||||||||
Daily average amount outstanding |
$ |
$ |
$ |
|||||||||
Weighted-average interest rate |
% |
% |
% |
|||||||||
Term loan facility: |
||||||||||||
Daily average amount outstanding |
$ |
$ |
$ |
|||||||||
Weighted-average interest rate |
% |
% |
||||||||||
As of December 31, 2017, amounts were available for borrowing under our revolving credit facility as follows:
(in thousands) |
Total available |
|||
Revolving credit facility commitment |
$ |
|||
Amount drawn on revolving credit facility |
( |
) |
||
Outstanding letters of credit(1)
|
( |
) |
||
Net available for borrowing as of December 31, 2017 |
$ |
|||
GAAP requires management to evaluate, for each annual and interim period, whether there are conditions and events, considered in the aggregate, that indicate that it is probable that we will be unable to meet our obligations as they become due within one year after the date the financial statements are issued. This evaluation must be based on relevant conditions and events that are known and reasonably knowable as of that date. The evaluation initially does not take into consideration the potential mitigating effect of our plans that have not been fully implemented as of the date the financial statements are issued.
Our credit facility, including amounts outstanding under our term loan facility, matures in February 2019 and if not renewed, extended or replaced with other financing, would raise substantial doubt about our ability to continue as a going concern. Our plan to mitigate this risk is to obtain a new multi-year credit facility to refinance amounts outstanding under the current credit facility and to satisfy those obligations. We have been successful in obtaining long-term financing with terms and in amounts adequate to meet our objectives in the past, and we expect to execute the new credit facility in the first half of 2018. We believe that our existing cash balances, together with executing our new credit facility, will be sufficient to meet our anticipated cash requirements through at least the next 12 months.
90
DELUXE CORPORATION
NOTES TO CONSOLIDATED FINANCIAL STATEMENTS
(dollars in thousands, except per share amounts)
Long-term debt maturities – The aggregate debt maturities for our revolving line of credit and our term loan facility as of December 31, 2017 were as follows:
(in thousands) |
Debt maturities |
|||
2018 |
$ |
|||
2019 |
||||
Total |
$ |
|||
Short-term borrowings – In March 2015, we entered into a $75,000 short-term variable rate bank loan. Proceeds from this loan, net of related costs, were $74,880 and were used, along with a draw on our revolving credit facility, to retire all $200,000 of our 7.0 % senior notes that were scheduled to mature on March 15, 2019 . During December 2015, we elected to repay this loan in full. The weighted-average interest rate on amounts outstanding under this loan during 2015 was 1.59 %.
Lease obligations – We had capital lease obligations of $1,914 as of December 31, 2017 and $1,685 as of December 31, 2016 related to information technology hardware. The lease obligations will be paid through September 2021. The related assets are included in property, plant and equipment in the consolidated balance sheets. Depreciation of the leased assets is included in depreciation expense in the consolidated statements of cash flows. A portion of the leased assets have not yet been placed in service. The balance of those leased assets placed in service as of December 31 was as follows:
(in thousands) |
2017 |
2016 |
||||||
Machinery and equipment |
$ |
$ |
||||||
Accumulated depreciation |
( |
) |
( |
) |
||||
Net assets under capital leases |
$ |
$ |
||||||
In addition to capital leases, we also have operating leases on certain facilities and equipment. Rental expense was $19,839 for 2017, $16,454 for 2016 and $15,372 for 2015. As of December 31, 2017, future minimum lease payments under our capital lease obligations and noncancelable operating leases with terms in excess of one year were as follows:
(in thousands) |
Capital lease obligations |
Operating lease obligations |
||||||
2018 |
$ |
$ |
||||||
2019 |
||||||||
2020 |
||||||||
2021 |
||||||||
2022 |
— |
|||||||
Thereafter |
— |
|||||||
Total minimum lease payments |
$ |
|||||||
Less portion representing interest |
( |
) |
||||||
Present value of minimum lease payments |
$ |
|||||||
Note 14: Other commitments and contingencies
Indemnifications – In the normal course of business, we periodically enter into agreements that incorporate general indemnification language. These indemnifications encompass third-party claims arising from our products and services, including, without limitation, service failures, breach of security, intellectual property rights, governmental regulations and/or employment-related matters. Performance under these indemnities would generally be triggered by our breach of the terms of the contract. In disposing of assets or businesses, we often provide representations, warranties and/or indemnities to cover various risks including, for example, unknown damage to the assets, environmental risks involved in the sale of real estate, liability to investigate and remediate environmental contamination at waste disposal sites and manufacturing facilities, and unidentified tax liabilities and legal fees related to periods prior to disposition. We do not have the ability to estimate the potential liability from such indemnities because they relate to unknown conditions. However, we do not believe that any liability under these indemnities would have a material adverse effect on our financial position, annual results of operations or annual cash flows. We have recorded liabilities for known indemnifications related to environmental matters.
91
DELUXE CORPORATION
NOTES TO CONSOLIDATED FINANCIAL STATEMENTS
(dollars in thousands, except per share amounts)
Environmental matters – We are currently involved in environmental compliance, investigation and remediation activities at some of our current and former sites, primarily printing facilities of our Financial Services and Small Business Services segments that have been sold. Remediation costs are accrued on an undiscounted basis when the obligations are either known or considered probable and can be reasonably estimated. Remediation or testing costs that result directly from the sale of an asset and which we would not have otherwise incurred are considered direct costs of the sale of the asset. As such, they are included in our measurement of the carrying value of the asset sold.
Accruals for environmental matters were $2,646 as of December 31, 2017 and $3,206 as of December 31, 2016, primarily related to facilities that have been sold. These accruals are included in accrued liabilities and other non-current liabilities in the consolidated balance sheets. Accrued costs consist of direct costs of the remediation activities, primarily fees that will be paid to outside engineering and consulting firms. Although recorded accruals include our best estimates, our total costs cannot be predicted with certainty due to various factors such as the extent of corrective action that may be required, evolving environmental laws and regulations and advances in environmental technology. Where the available information is sufficient to estimate the amount of the liability, that estimate is used. Where the information is only sufficient to establish a range of probable liability and no point within the range is more likely than any other, the lower end of the range is recorded. We do not believe that the range of possible outcomes could have a material effect on our financial condition, results of operations or liquidity. Expense reflected in our consolidated statements of income for environmental matters was $348 for 2017 and $1,142 for 2015. The 2016 consolidated statement of income includes a net benefit from environmental matters of $1,692 . During the second quarter of 2016, we reversed a portion of the liability for one of our sold facilities as we determined that it was no longer probable that a portion of the estimated environmental remediation costs for this location would be incurred.
We purchased an insurance policy during 2002 that covers up to $10,000 of third-party pollution claims through 2032 at certain owned, leased and divested sites. We also purchased an insurance policy during 2009 that covers up to $15,000 of third-party pollution claims through April 2019 at certain other sites. These policies cover liability for claims of bodily injury or property damage arising from pollution events at the covered facilities, as well as remediation coverage should we be required by a governing authority to perform remediation activities at the covered sites. No accruals have been recorded in our consolidated financial statements for any of the events contemplated in these insurance policies. We do not anticipate significant net cash outlays for environmental matters within the next 5 years.
Self-insurance – We are self-insured for certain costs, primarily workers' compensation claims and medical and dental benefits for active employees and those employees on long-term disability. The liabilities associated with these items represent our best estimate of the ultimate obligations for reported claims plus those incurred, but not reported, and totaled $7,679 as of December 31, 2017 and $6,999 as of December 31, 2016. These accruals are included in accrued liabilities and other non-current liabilities in the consolidated balance sheets. Our workers' compensation liability is accounted for on a present value basis. The difference between the discounted and undiscounted liability was not significant as of December 31, 2017 or December 31, 2016.
Our self-insurance liabilities are estimated, in part, by considering historical claims experience, demographic factors and other actuarial assumptions. The estimated accruals for these liabilities could be significantly affected if future events and claims differ from these assumptions and historical trends.
Litigation – Recorded liabilities for legal matters were not material to our financial position, results of operations or liquidity during the periods presented, and we do not believe that any of the currently identified claims or litigation will materially affect our financial position, results of operations or liquidity upon resolution. However, litigation is subject to inherent uncertainties, and unfavorable rulings could occur. If an unfavorable ruling were to occur, it may cause a material adverse impact on our financial position, results of operations or liquidity for the period in which the ruling occurs or in future periods.
Note 15: Shareholders’ equity
During 2017, we repurchased 924 thousand shares for $65,000 . A portion of these repurchases were completed under an outstanding authorization from our board of directors to purchase up to 10.0 million shares of our common stock. As of December 31, 2016, 65 thousand shares remained available for purchase under this authorization and we completed the purchase of all of these remaining shares during the quarter ended March 31, 2017. During 2016, we repurchased 901 shares for $55,224 and during 2015, we repurchased 996 shares for $59,952 under this authorization.
The remainder of our 2017 share repurchases were completed under an additional authorization from our board of directors for the repurchase of up to $300,000 of our common stock, effective at the conclusion of the previous authorization. This additional authorization has no expiration date and $239,726 remained available for purchase under this authorization as of December 31, 2017.
92
DELUXE CORPORATION
NOTES TO CONSOLIDATED FINANCIAL STATEMENTS
(dollars in thousands, except per share amounts)
Note 16: Business segment information
We operate 3 reportable business segments: Small Business Services, Financial Services and Direct Checks. Our business segments are generally organized by the type of customer served and reflect the way we manage the company. Small Business Services promotes and sells products and services to small businesses via direct response mail and internet advertising; referrals from financial institutions, telecommunications clients and other partners; networks of Safeguard distributors and independent dealers; a direct sales force that focuses on selling to and through major accounts; and an outbound telemarketing group. Financial Services' products and services are sold primarily through a direct sales force, which executes product and service supply contracts with our financial institution clients, including banks, credit unions and financial services companies. Direct Checks sells products and services directly to consumers using direct marketing, including print advertising and search engine marketing and optimization strategies. All 3 segments operate primarily in the United States. Small Business Services also has operations in Canada, Australia and portions of Europe. No single customer accounted for more than 10 % of consolidated revenue during the past 3 years.
Our product and service offerings are comprised of the following:
Checks – We remain one of the largest providers of checks in the United States. During 2017, checks represented 39 % of our Small Business Services segment's revenue, 43 % of our Financial Services segment's revenue and 84 % of our Direct Checks segment's revenue.
Marketing solutions and other services (MOS) – We offer products and services designed to meet our customers’ sales and marketing needs, as well as various other service offerings. Our marketing products include digital printing and web-to-print solutions such as business cards, print marketing, promotional goods and apparel. Our web services offerings include logo design; hosting, domain name and web design services; search engine optimization; and marketing programs, including email, mobile and social media. We also offer fraud protection and security services, online and offline payroll services, and electronic checks ("eChecks"). Our Financial Services segment also offers a selection of financial technology (“FinTech”) solutions. These solutions include data-driven marketing solutions, including outsourced marketing campaign targeting and execution; treasury management solutions, including accounts receivable processing and remote deposit capture; and digital engagement solutions, including loyalty and rewards programs. During 2017, MOS represented 34 % of our Small Business Services segment's revenue, 55 % of our Financial Services segment's revenue and 11 % of our Direct Checks segment's revenue.
Forms – Our Small Business Services segment provides printed forms to small businesses, including deposit tickets, billing forms, work orders, job proposals, purchase orders, invoices and personnel forms. This segment also offers computer forms compatible with accounting software packages commonly used by small businesses. Forms sold by our Financial Services and Direct Checks segments include deposit tickets and check registers.
Accessories and other products – Small Business Services offers products designed to provide small business owners with the customized documents necessary to efficiently manage their business, including envelopes, office supplies, ink stamps and labels. Our Financial Services and Direct Checks segments offer checkbook covers, labels and ink stamps.
The accounting policies of the segments are the same as those described in Note 1. We allocate corporate costs for our shared services functions to our business segments, including costs of our executive management, human resources, supply chain, finance, information technology and legal functions. Generally, where costs incurred were directly attributable to a business segment, primarily within the areas of information technology, supply chain and finance, those costs were charged directly to that segment. Because we use a shared services approach for many of our functions, certain costs were not directly attributable to a business segment. These costs were allocated to our business segments based on segment revenue, as revenue is a measure of the relative size and magnitude of each segment and indicates the level of corporate shared services consumed by each segment. Corporate assets are not allocated to the segments and consisted primarily of long-term investments and assets related to our corporate shared services functions of manufacturing, information technology and real estate, including property, plant and equipment; internal-use software; and inventories and supplies. Depreciation and amortization expense related to corporate assets, which was allocated to the segments, was $33,302 in 2017, $32,785 in 2016 and $32,505 in 2015.
We are an integrated enterprise, characterized by substantial intersegment cooperation, cost allocations and the sharing of assets. Therefore, we do not represent that these segments, if operated independently, would report the operating income and other financial information shown.
93
DELUXE CORPORATION
NOTES TO CONSOLIDATED FINANCIAL STATEMENTS
(dollars in thousands, except per share amounts)
Reportable Business Segments |
||||||||||||||||||||||
(in thousands) |
Small Business Services |
Financial Services |
Direct Checks |
Corporate |
Consolidated |
|||||||||||||||||
Total revenue from external |
2017 |
$ |
$ |
$ |
$ |
$ |
||||||||||||||||
customers: |
2016 |
|||||||||||||||||||||
2015 |
||||||||||||||||||||||
Operating income: |
2017 |
|||||||||||||||||||||
2016 |
||||||||||||||||||||||
2015 |
||||||||||||||||||||||
Depreciation and amortization |
2017 |
|||||||||||||||||||||
expense: |
2016 |
|||||||||||||||||||||
2015 |
||||||||||||||||||||||
Asset impairment charges: |
2017 |
|||||||||||||||||||||
2016 |
||||||||||||||||||||||
2015 |
||||||||||||||||||||||
Total assets: |
2017 |
|||||||||||||||||||||
2016 |
||||||||||||||||||||||
2015 |
||||||||||||||||||||||
Capital asset purchases: |
2017 |
|||||||||||||||||||||
2016 |
||||||||||||||||||||||
2015 |
||||||||||||||||||||||
(in thousands) |
2017 |
2016 |
2015 |
|||||||||
Checks |
$ |
$ |
$ |
|||||||||
Marketing solutions and other services |
||||||||||||
Forms |
||||||||||||
Accessories and other products |
||||||||||||
Total revenue |
$ |
$ |
$ |
|||||||||
(in thousands) |
2017 |
2016 |
2015 |
|||||||||
Total revenue from external customers: |
||||||||||||
United States |
$ |
$ |
$ |
|||||||||
Foreign, primarily Canada |
||||||||||||
Total revenue |
$ |
$ |
$ |
|||||||||
94
SUMMARIZED QUARTERLY FINANCIAL DATA (Unaudited)
(in thousands, except per share amounts)
2017 Quarter Ended |
||||||||||||||||
March 31 |
June 30 |
September 30 |
December 31 |
|||||||||||||
Total revenue |
$ |
$ |
$ |
$ |
||||||||||||
Gross profit |
||||||||||||||||
Net income |
||||||||||||||||
Earnings per share: |
||||||||||||||||
Basic |
||||||||||||||||
Diluted |
||||||||||||||||
Cash dividends per share |
||||||||||||||||
2016 Quarter Ended |
||||||||||||||||
March 31 |
June 30 |
September 30 |
December 31 |
|||||||||||||
Total revenue |
$ |
$ |
$ |
$ |
||||||||||||
Gross profit |
||||||||||||||||
Net income |
||||||||||||||||
Earnings per share: |
||||||||||||||||
Basic |
||||||||||||||||
Diluted |
||||||||||||||||
Cash dividends per share |
||||||||||||||||
Significant items affecting the comparability of quarterly results were as follows:
• |
First quarter 2017 – net pre-tax gains of $ |
• |
Second quarter 2017 – a pre-tax asset impairment charge of $ |
• |
Third quarter 2017 – asset impairment charges of $ |
• |
Fourth quarter 2017 – net pre-tax restructuring charges of $ |
• |
Second quarter 2016 – net pre-tax restructuring charges of $ |
• |
Third quarter 2016 – net pre-tax restructuring charges of $ |
• |
95
Item 9. Changes in and Disagreements With Accountants on Accounting and Financial Disclosure.
None.
Item 9A. Controls and Procedures.
Disclosure Controls and Procedures – As of the end of the period covered by this report, December 31, 2017 (the Evaluation Date), we carried out an evaluation, under the supervision and with the participation of management, including the Chief Executive Officer and the Chief Financial Officer, of the effectiveness of the design and operation of our disclosure controls and procedures (as defined in Rule 13a-15(e) of the Securities Exchange Act of 1934, as amended (the Exchange Act)). Based upon that evaluation, the Chief Executive Officer and the Chief Financial Officer concluded that, as of the Evaluation Date, our disclosure controls and procedures were effective to ensure that information required to be disclosed in the reports that we file or submit under the Exchange Act is (i) recorded, processed, summarized and reported within the time periods specified in applicable rules and forms, and (ii) accumulated and communicated to our management, including our Chief Executive Officer and Chief Financial Officer, to allow timely decisions regarding required disclosure.
Internal Control Over Financial Reporting – There were no changes in our internal control over financial reporting identified in connection with our evaluation during the quarter ended December 31, 2017 that have materially affected, or are reasonably likely to materially affect, our internal control over financial reporting.
Management's Report on Internal Control over Financial Reporting – Management of Deluxe Corporation is responsible for establishing and maintaining adequate internal control over financial reporting. Internal control over financial reporting is a process designed to provide reasonable assurance regarding the reliability of financial reporting and the preparation of financial statements for external purposes in accordance with generally accepted accounting principles in the United States.
Because of its inherent limitations, internal control over financial reporting may not prevent or detect misstatements. Also, projections of any evaluation of effectiveness to future periods are subject to the risk that controls may become inadequate because of changes in conditions, or that the degree of compliance with the policies or procedures may deteriorate.
Management assessed the effectiveness of our internal control over financial reporting as of December 31, 2017. In making this assessment, it used the criteria set forth by the Committee of Sponsoring Organizations of the Treadway Commission (COSO) in Internal Control - Integrated Framework (2013). Based on this assessment, we have concluded that, as of December 31, 2017, our internal control over financial reporting was effective based on those criteria. The attestation report on our internal control over financial reporting issued by PricewaterhouseCoopers LLP appears in Item 8 of this report.
Item 9B. Other Information.
None.
PART III
Except where otherwise noted, the information required by Items 10 through 14 is incorporated by reference from our definitive proxy statement, to be filed with the Securities and Exchange Commission within 120 days of our fiscal year-end, with the exception of the executive officers section of Item 10, which is included in Part I, Item 1 of this report.
Item 10. Directors, Executive Officers and Corporate Governance.
See Part I, Item 1 of this report “Executive Officers of the Registrant.” The sections of the proxy statement entitled “Item 1: Election of Directors,” “Board Structure and Governance-Audit Committee Expertise; Complaint-Handling Procedures,” “Board Structure and Governance-Meetings of the Board of Directors-Audit Committee,” “Stock Ownership and Reporting-Section 16(a) Beneficial Ownership Reporting Compliance” and “Board Structure and Governance-Code of Ethics and Business Conduct” are incorporated by reference into this report.
The full text of our Code of Business Ethics is posted on our investor relations website, Deluxe.com/investor, under the “Investor Relations-Corporate Governance” caption. We intend to satisfy the disclosure requirement under Item 5.05 of Form 8-K regarding an amendment to, or waiver from, a provision of the Code of Business Ethics that applies to our principal executive officer, principal financial officer, principal accounting officer or controller or persons performing similar functions by posting such information on our website at the address and location specified above.
96
Item 11. Executive Compensation.
The sections of the proxy statement entitled “Executive Compensation-Compensation Committee Report,” “Executive Compensation,” “Board Structure and Governance-Non-Employee Director Compensation” and “Board Structure and Governance-Compensation Committee Interlocks and Insider Participation” are incorporated by reference into this report.
Item 12. Security Ownership of Certain Beneficial Owners and Management and Related Stockholder Matters.
The section of the proxy statement entitled “Stock Ownership and Reporting-Security Ownership of Certain Beneficial Owners and Management” is incorporated by reference into this report.
The following table provides information concerning all of our equity compensation plans as of December 31, 2017:
Equity Compensation Plan Information
Plan category |
Number of securities to be issued upon exercise of outstanding options, warrants and rights |
Weighted-average exercise price of outstanding options, warrants and rights |
Number of securities remaining available for future issuance under equity compensation plans (excluding securities reflected in the first column) |
||||||||
Equity compensation plans approved by shareholders |
1,501,902 |
(1) |
$ |
56.51 |
(1) |
9,929,159 |
(2) |
||||
Equity compensation plans not approved by shareholders |
— |
— |
— |
||||||||
Total |
1,501,902 |
$ |
56.51 |
9,929,159 |
|||||||
(1) Includes awards granted under our 2017 Long-Term Incentive Plan and our previous stock incentive plans. The number of securities to be issued upon exercise of outstanding options, warrants and rights includes outstanding stock options of 1,138,739, restricted stock unit awards of 108,523 and 254,640 shares subject to outstanding performance share awards. The number of performance shares reflects the target amount for awards outstanding as of December 31, 2017. The actual number of shares issued under our performance share awards will range between 0% and 200% of the target amount based on our performance relative to the applicable performance goals as determined by our Compensation Committee following the end of the performance period. The performance share and restricted stock unit awards are not included in the weighted-average exercise price of outstanding options, warrants and rights because they require no consideration upon vesting.
(2) Includes 3,529,260 shares reserved for issuance under our Amended and Restated 2000 Employee Stock Purchase Plan and 6,399,899 shares available for issuance under our 2017 Long-Term Incentive Plan. Under the 2017 Long-Term Incentive Plan, full value awards such as restricted stock, restricted stock units and share-based performance awards reduce the number of shares available for issuance by a factor of 2.23, or if such an award were forfeited or terminated without delivery of the shares, the number of shares that again become eligible for issuance would be multiplied by a factor of 2.23.
Item 13. Certain Relationships and Related Transactions, and Director Independence.
The sections of the proxy entitled “Board Structure and Governance-Board Oversight and Director Independence” and “Board Structure and Governance-Related Party Transaction Policy and Procedures” are incorporated by reference into this report.
Item 14. Principal Accountant Fees and Services.
The sections of the proxy statement entitled “Fiscal Year 2017 Audit and Independent Registered Public Accounting Firm-Fees Paid to Independent Registered Public Accounting Firm” and “Fiscal Year 2017 Audit and Independent Registered Public Accounting Firm-Policy on Audit Committee Pre-Approval of Accounting Firm Fees and Services” are incorporated by reference into this report.
97
PART IV
Item 15. Exhibits and Financial Statement Schedules.
(a) Financial Statements and Schedules
The financial statements are set forth under Item 8 of the Annual Report on Form 10-K. Financial statement schedules have been omitted since they are either not required or are not applicable, or the required information is shown in the consolidated financial statements or notes.
(b) Exhibit Listing
The following exhibits are filed as part of or are incorporated into this report by reference:
Exhibit Number |
Description |
Method of Filing |
||
3.1 |
|
* |
||
3.2 |
|
* |
||
4.1 |
|
* |
||
10.1 |
* |
|||
10.2 |
* |
|||
10.3 |
* |
|||
10.4 |
* |
|||
10.5 |
* |
|||
10.6 |
* |
|||
10.7 |
* |
|||
10.8 |
* |
|||
10.9 |
* |
|||
98
Exhibit Number |
Description |
Method of Filing |
||
10.10 |
* |
|||
10.11 |
* |
|||
10.12 |
* |
|||
10.13 |
* |
|||
10.14 |
Filed
herewith
|
|||
10.15 |
* |
|||
10.16 |
Filed
herewith
|
|||
10.17 |
* |
|||
10.18 |
* |
|||
10.19 |
Filed
herewith
|
|||
10.20 |
* |
|||
10.21 |
Filed
herewith
|
|||
10.22 |
Filed
herewith
|
|||
10.23 |
Filed
herewith
|
|||
10.24 |
* |
|||
10.25 |
* |
|||
10.26 |
Filed
herewith
|
|||
99
Exhibit Number |
Description |
Method of Filing |
||
10.27 |
* |
|||
10.28 |
* |
|||
21.1 |
Filed
herewith
|
|||
23.1 |
Filed
herewith
|
|||
24.1 |
Filed
herewith
|
|||
31.1 |
|
Filed
herewith
|
||
31.2 |
|
Filed
herewith
|
||
32.1 |
Furnished
herewith
|
|||
101 |
Interactive data files pursuant to Rule 405 of Regulation S-T: (i) Consolidated Balance Sheets as of December 31, 2017 and December 31, 2016, (ii) Consolidated Statements of Income for the years ended December 31, 2017, 2016 and 2015, (iii) Consolidated Statements of Comprehensive Income for the years ended December 31, 2017, 2016 and 2015, (iv) Consolidated Statements of Shareholders' Equity for the years ended December 31, 2017, 2016 and 2015 (v) Consolidated Statements of Cash Flows for the years ended December 31, 2017, 2016 and 2015, and (vi) Notes to Consolidated Financial Statements |
Filed
herewith
|
||
___________________
* Incorporated by reference
** Denotes compensatory plan or management contract
Note to recipients of Form 10-K: Copies of exhibits will be furnished upon written request and payment of reasonable expenses in furnishing such copies.
Item 16. Form 10-K Summary.
We have elected not to include an optional Form 10-K Summary.
100
SIGNATURES
Pursuant to the requirements of Section 13 or 15(d) of the Securities Exchange Act of 1934, the registrant has duly caused this report to be signed on its behalf by the undersigned thereunto duly authorized.
DELUXE CORPORATION |
|
Date: February 23, 2018 |
By: /s/ Lee Schram |
Lee Schram, Chief Executive Officer |
|
Pursuant to the requirements of the Securities Exchange Act of 1934, this report has been signed below by the following persons on behalf of the registrant and in the capacities indicated on February 23, 2018.
Signature |
Title |
By: /s/ Lee Schram |
Chief Executive Officer |
Lee Schram |
(Principal Executive Officer) |
By: /s/ Keith A. Bush |
Chief Financial Officer |
Keith A. Bush |
(Principal Financial Officer and Principal Accounting Officer) |
* |
|
Ronald C. Baldwin |
Director |
* |
|
Don J. McGrath |
Director |
* |
|
Cheryl Mayberry McKissack |
Director |
* |
|
Neil J. Metviner |
Director |
* |
|
Stephen P. Nachtsheim |
Director |
* |
|
Thomas J. Reddin |
Director |
* |
|
Martyn R. Redgrave |
Director |
* |
|
John L. Stauch |
Director |
* |
|
Victoria A. Treyger |
Director |
* By: /s/ Lee Schram |
|
Lee Schram, Attorney-in-Fact |
|
101