EXHIBIT 99.1
Published on September 16, 2020

InvestorOperations Presentation September 2020 © 2020 Deluxe Enterprise Operations, Inc. Proprietary and Confidential.
Cautionary Statement » This presentation highlights management’s intentions, projections, financial estimates or expectations about the company's future strategy or performance and are forward-looking in nature as defined in the Private Securities Litigation Reform Act of 1995. These comments are subject to risks and uncertainties, including risks related to potential continuing negative impacts from pandemic health issues, such as the coronavirus / COVID-19, along with the impact of government stay-at-home orders or other similar directives on our future financial results of operations, our future financial condition, and our ability to continue business activities in affected regions, which could cause our actual results to differ materially from our projections. Additional information about factors that might cause our actual results to differ from projections is contained in the company's Form 10-K for the year ended December 31st, 2019, the Form 10-Q issued on July 31, 2020 and other SEC filings. Any references to non- GAAP financial measures are reconciled to the comparable GAAP financial measures in second quarter 2020 earnings release or other SEC filings. 2
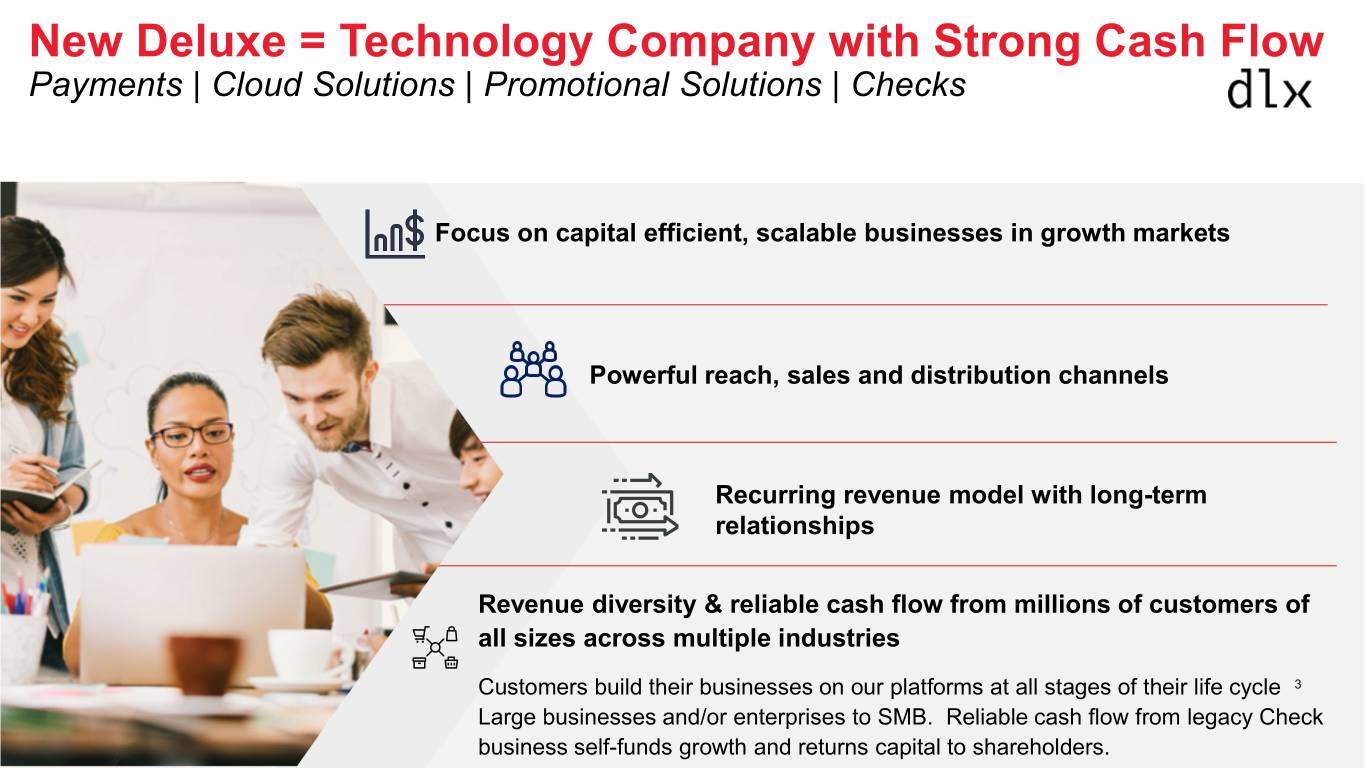
New Deluxe = Technology Company with Strong Cash Flow Payments | Cloud Solutions | Promotional Solutions | Checks Focus on capital efficient, scalable businesses in growth markets Powerful reach, sales and distribution channels Recurring revenue model with long-term relationships Revenue diversity & reliable cash flow from millions of customers of all sizes across multiple industries Customers build their businesses on our platforms at all stages of their life cycle 3 Large businesses and/or enterprises to SMB. Reliable cash flow from legacy Check business self-funds growth and returns capital to shareholders.
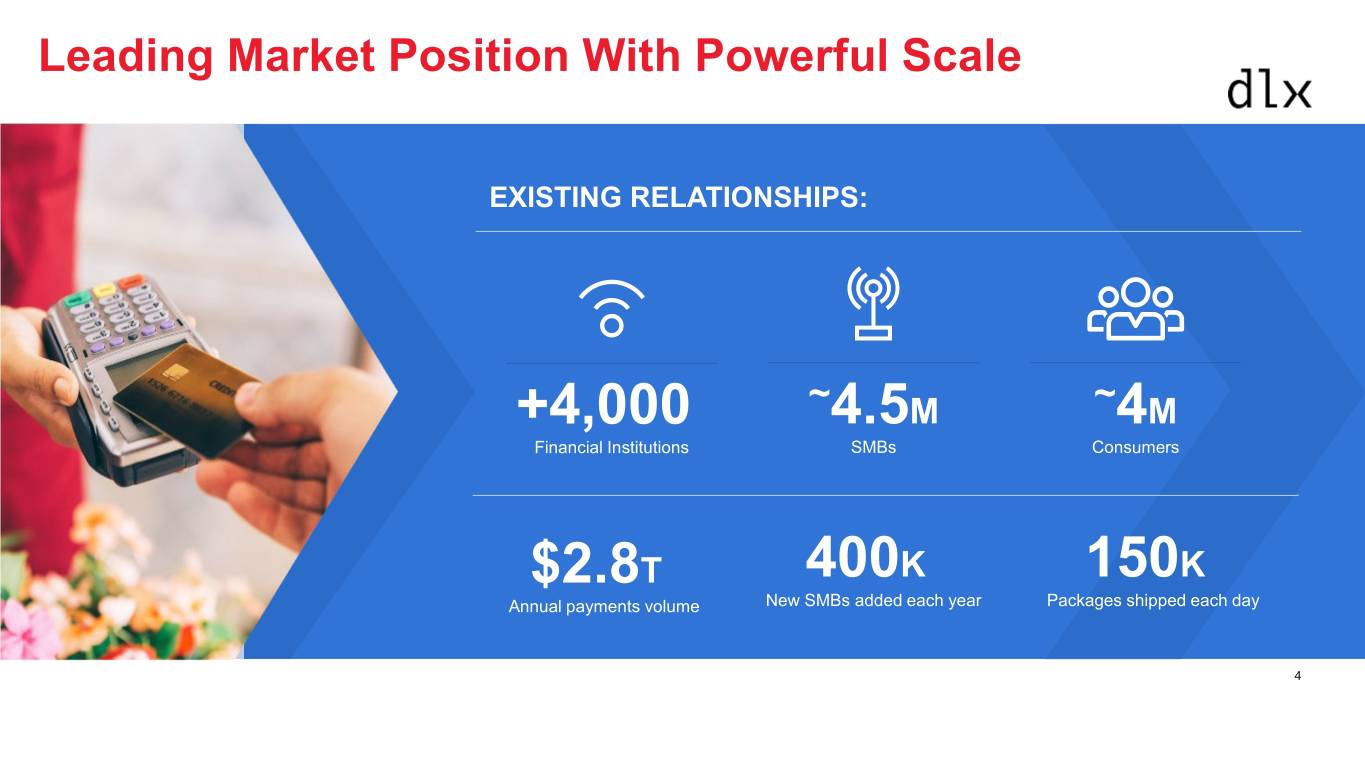
Leading Market Position With Powerful Scale EXISTING RELATIONSHIPS: +4,000 ~4.5M ~4M Financial Institutions SMBs Consumers $2.8T 400K 150K Annual payments volume New SMBs added each year Packages shipped each day 4
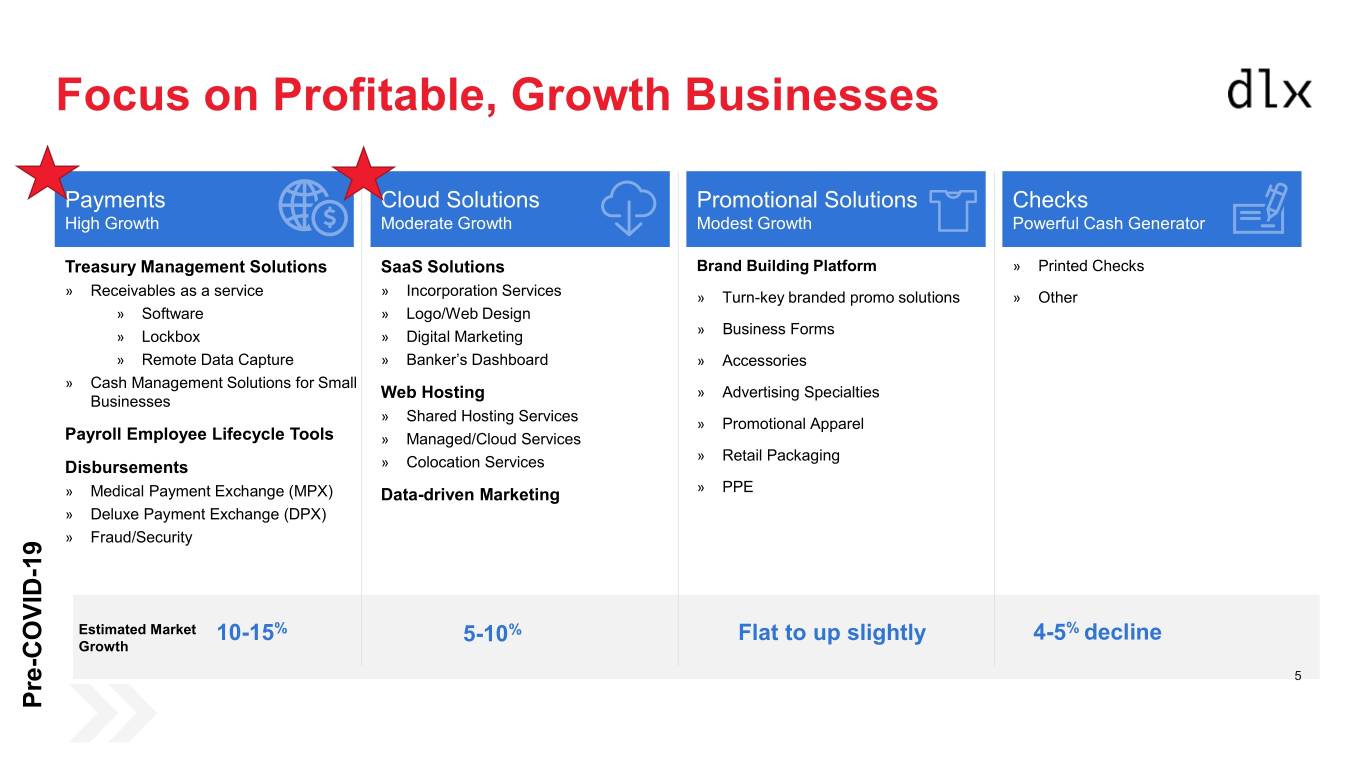
Focus on Profitable, Growth Businesses Payments Cloud Solutions Promotional Solutions Checks High Growth Moderate Growth Modest Growth Powerful Cash Generator Treasury Management Solutions SaaS Solutions Brand Building Platform » Printed Checks » Receivables as a service » Incorporation Services » Turn-key branded promo solutions » Other » Software » Logo/Web Design » » Lockbox » Digital Marketing Business Forms » Remote Data Capture » Banker’s Dashboard » Accessories » Cash Management Solutions for Small » Advertising Specialties Businesses Web Hosting » Shared Hosting Services » Promotional Apparel Payroll Employee Lifecycle Tools » Managed/Cloud Services » Retail Packaging Disbursements » Colocation Services » PPE » Medical Payment Exchange (MPX) Data-driven Marketing » Deluxe Payment Exchange (DPX) » Fraud/Security - 19 Estimated Market 10-15% % Flat to up slightly 4-5% decline Growth 5-10 - COVID 5 Pre
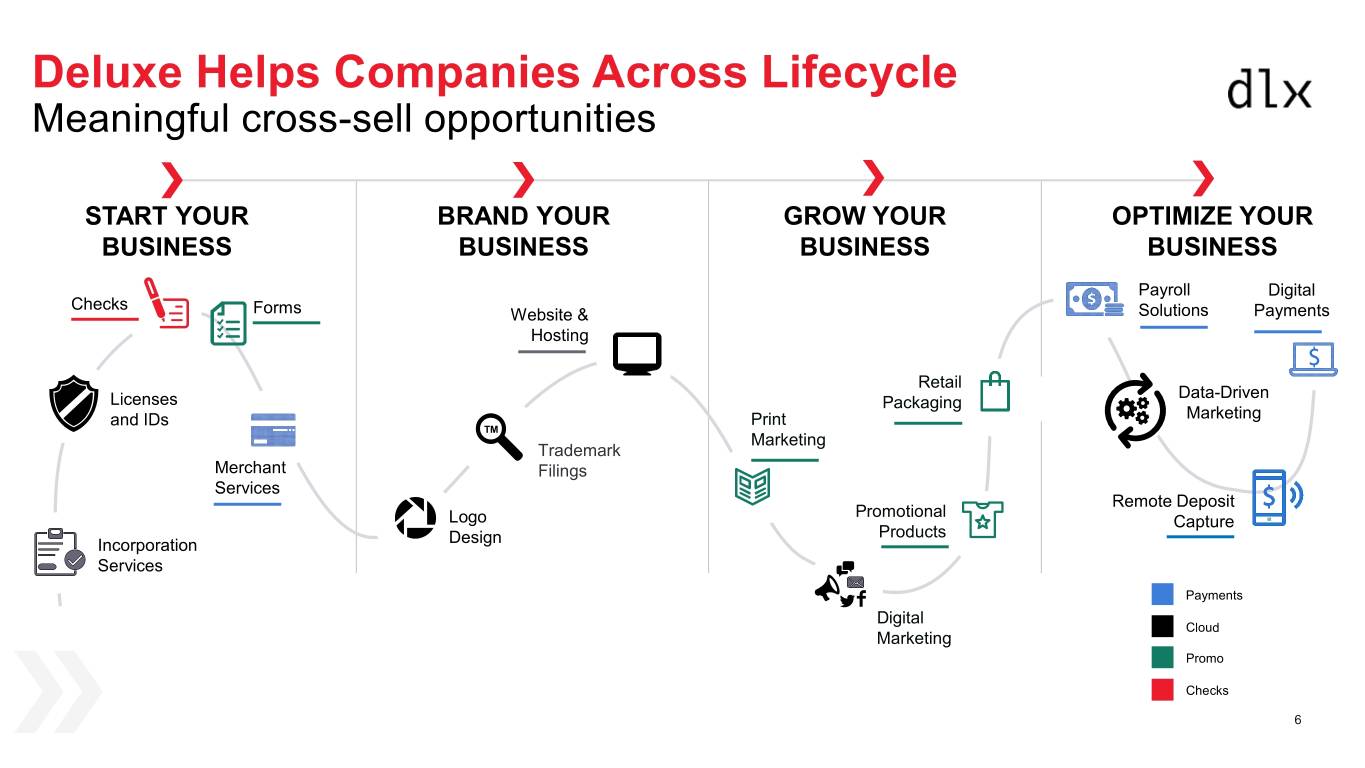
Deluxe Helps Companies Across Lifecycle Meaningful cross-sell opportunities START YOUR BRAND YOUR GROW YOUR OPTIMIZE YOUR BUSINESS BUSINESS BUSINESS BUSINESS Payroll Digital Checks Forms Website & Solutions Payments Hosting Retail Data-Driven Licenses Packaging and IDs Print Marketing TM Marketing Trademark Merchant Filings Services Remote Deposit Promotional Logo Capture Products Incorporation Design Services Payments Digital Cloud Marketing Promo Checks 6
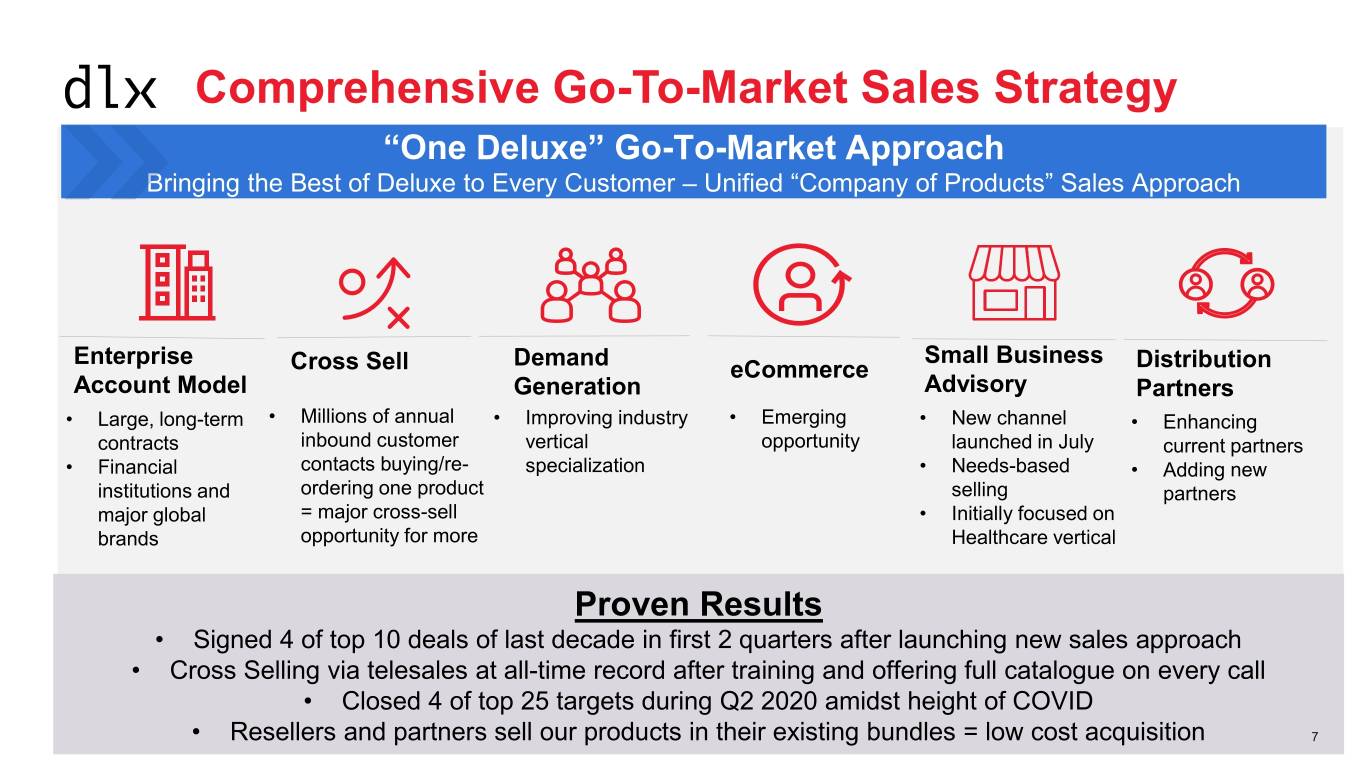
Comprehensive Go-To-Market Sales Strategy “One Deluxe” Go-To-Market Approach Bringing the Best of Deluxe to Every Customer – Unified “Company of Products” Sales Approach Enterprise Demand Small Business Cross Sell eCommerce Distribution Account Model Generation Advisory Partners • Large, long-term • Millions of annual • Improving industry • Emerging • New channel • Enhancing contracts inbound customer vertical opportunity launched in July current partners • Financial contacts buying/re- specialization • Needs-based • Adding new institutions and ordering one product selling partners major global = major cross-sell • Initially focused on brands opportunity for more Healthcare vertical Proven Results • Signed 4 of top 10 deals of last decade in first 2 quarters after launching new sales approach • Cross Selling via telesales at all-time record after training and offering full catalogue on every call • Closed 4 of top 25 targets during Q2 2020 amidst height of COVID 7 • Resellers and partners sell our products in their existing bundles = low cost acquisition 7
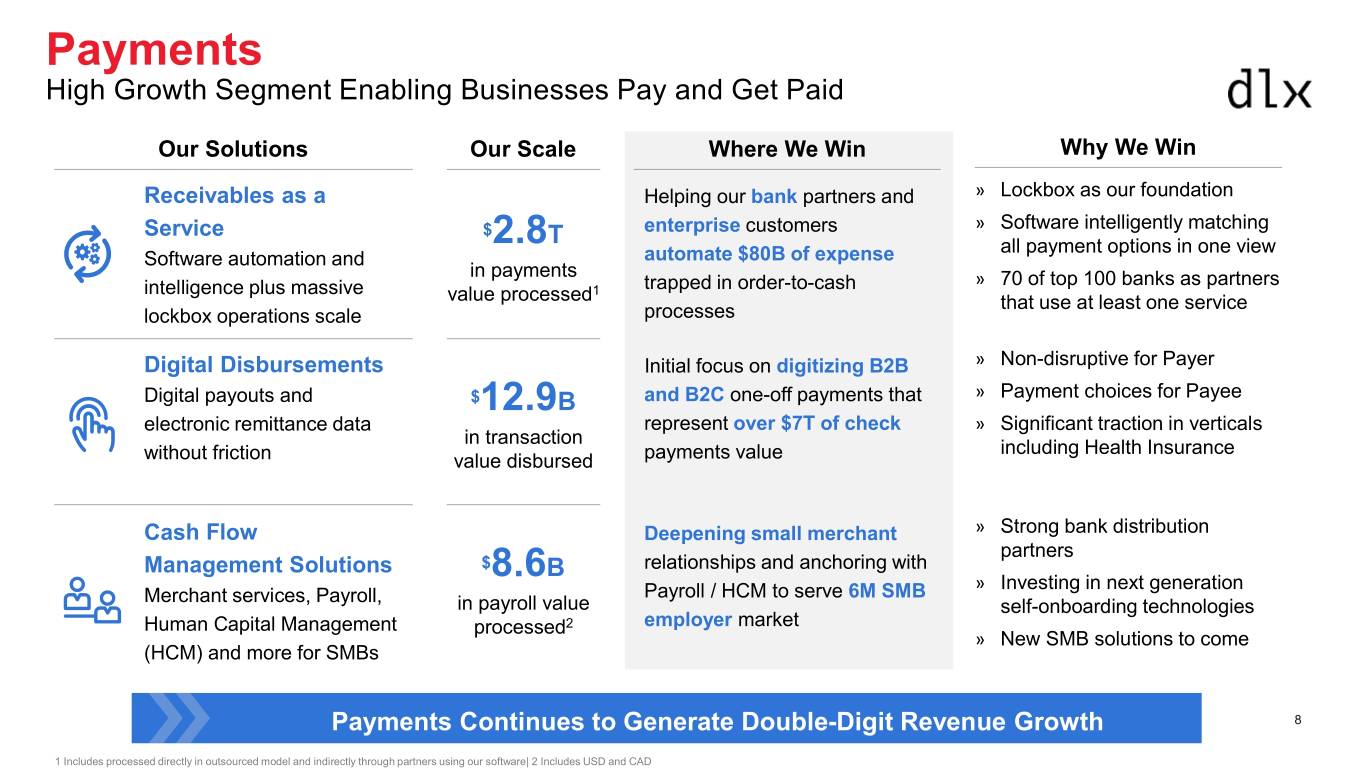
Payments High Growth Segment Enabling Businesses Pay and Get Paid Our Solutions Our Scale Where We Win Why We Win Receivables as a Helping our bank partners and » Lockbox as our foundation Service $ enterprise customers » Software intelligently matching 2.8T all payment options in one view Software automation and automate $80B of expense in payments » 70 of top 100 banks as partners intelligence plus massive 1 trapped in order-to-cash value processed that use at least one service lockbox operations scale processes Digital Disbursements Initial focus on digitizing B2B » Non-disruptive for Payer » Payment choices for Payee Digital payouts and $12.9B and B2C one-off payments that electronic remittance data represent over $7T of check » Significant traction in verticals in transaction including Health Insurance without friction value disbursed payments value Cash Flow Deepening small merchant » Strong bank distribution partners Management Solutions $ relationships and anchoring with 8.6B » Investing in next generation Merchant services, Payroll, Payroll / HCM to serve 6M SMB in payroll value self-onboarding technologies Human Capital Management processed2 employer market » New SMB solutions to come (HCM) and more for SMBs Payments Continues to Generate Double-Digit Revenue Growth 8 1 Includes processed directly in outsourced model and indirectly through partners using our software| 2 Includes USD and CAD
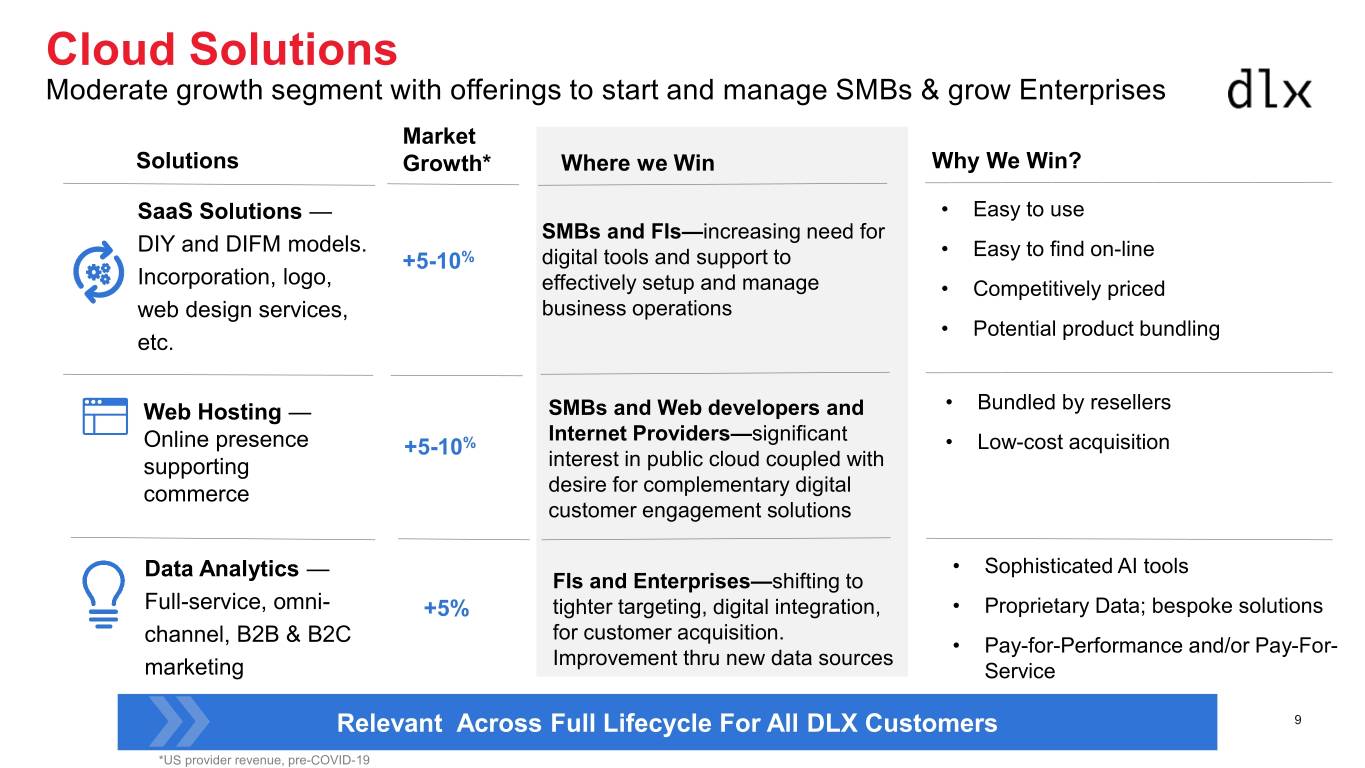
Cloud Solutions Moderate growth segment with offerings to start and manage SMBs & grow Enterprises Market Solutions Growth* Where we Win Why We Win? SaaS Solutions — • Easy to use SMBs and FIs—increasing need for DIY and DIFM models. • Easy to find on-line +5-10% digital tools and support to Incorporation, logo, effectively setup and manage • Competitively priced web design services, business operations • Potential product bundling etc. Web Hosting — SMBs and Web developers and • Bundled by resellers Internet Providers—significant Online presence +5-10% • Low-cost acquisition supporting interest in public cloud coupled with commerce desire for complementary digital customer engagement solutions Data Analytics — • Sophisticated AI tools FIs and Enterprises—shifting to Full-service, omni- +5% tighter targeting, digital integration, • Proprietary Data; bespoke solutions for customer acquisition. channel, B2B & B2C • Pay-for-Performance and/or Pay-For- Improvement thru new data sources marketing Service Relevant Across Full Lifecycle For All DLX Customers 9 *US provider revenue, pre-COVID-19
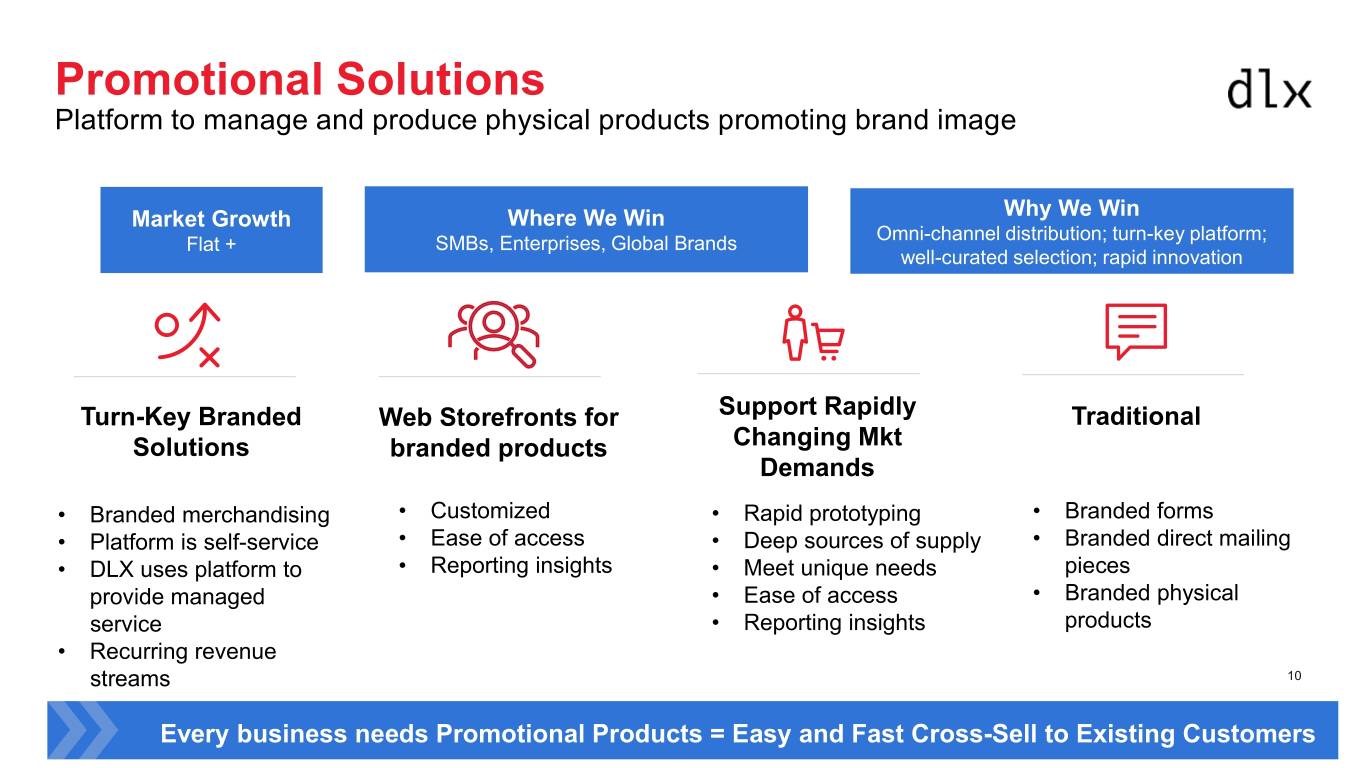
Promotional Solutions Platform to manage and produce physical products promoting brand image Market Growth Where We Win Why We Win Omni-channel distribution; turn-key platform; Flat + SMBs, Enterprises, Global Brands well-curated selection; rapid innovation Turn-Key Branded Web Storefronts for Support Rapidly Traditional Solutions branded products Changing Mkt Demands • Branded merchandising • Customized • Rapid prototyping • Branded forms • Platform is self-service • Ease of access • Deep sources of supply • Branded direct mailing • DLX uses platform to • Reporting insights • Meet unique needs pieces provide managed • Ease of access • Branded physical service • Reporting insights products • Recurring revenue streams 10 Every business needs Promotional Products = Easy and Fast Cross-Sell to Existing Customers
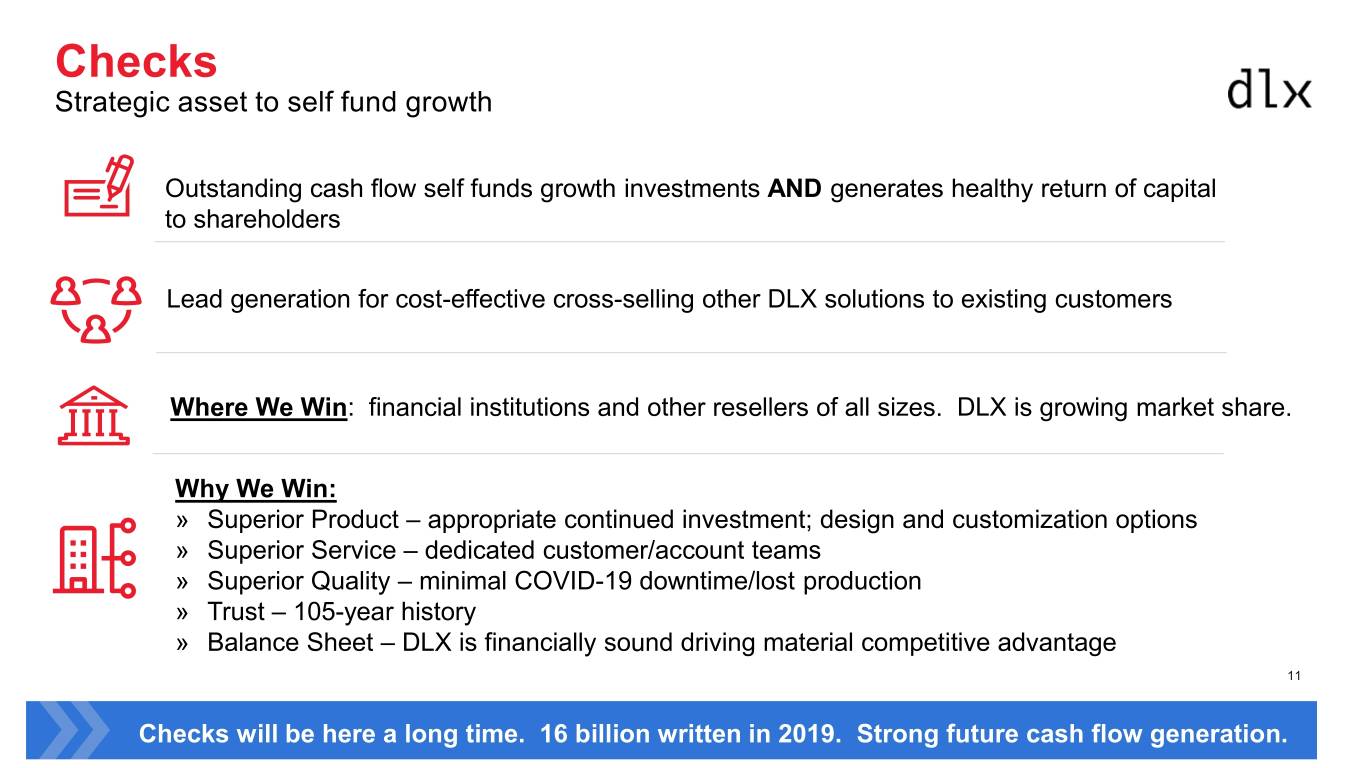
Checks Strategic asset to self fund growth Outstanding cash flow self funds growth investments AND generates healthy return of capital to shareholders Lead generation for cost-effective cross-selling other DLX solutions to existing customers Where We Win: financial institutions and other resellers of all sizes. DLX is growing market share. Why We Win: » Superior Product – appropriate continued investment; design and customization options » Superior Service – dedicated customer/account teams » Superior Quality – minimal COVID-19 downtime/lost production » Trust – 105-year history » Balance Sheet – DLX is financially sound driving material competitive advantage 11 Checks will be here a long time. 16 billion written in 2019. Strong future cash flow generation. 11
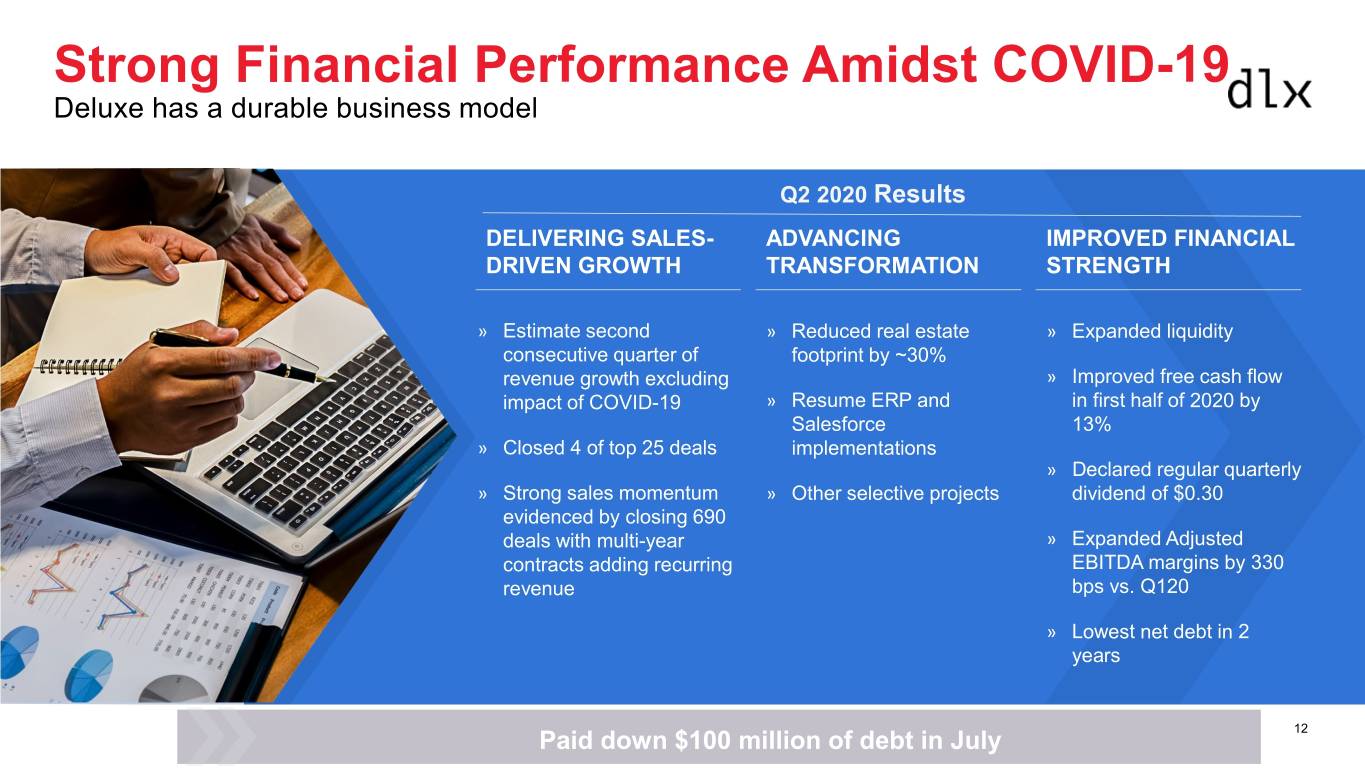
Strong Financial Performance Amidst COVID-19 Deluxe has a durable business model Q2 2020 Results DELIVERING SALES- ADVANCING IMPROVED FINANCIAL DRIVEN GROWTH TRANSFORMATION STRENGTH » Estimate second » Reduced real estate » Expanded liquidity consecutive quarter of footprint by ~30% revenue growth excluding » Improved free cash flow impact of COVID-19 » Resume ERP and in first half of 2020 by Salesforce 13% » Closed 4 of top 25 deals implementations » Declared regular quarterly » Strong sales momentum » Other selective projects dividend of $0.30 evidenced by closing 690 deals with multi-year » Expanded Adjusted contracts adding recurring EBITDA margins by 330 revenue bps vs. Q120 » Lowest net debt in 2 years 12 Paid down $100 million of debt in July
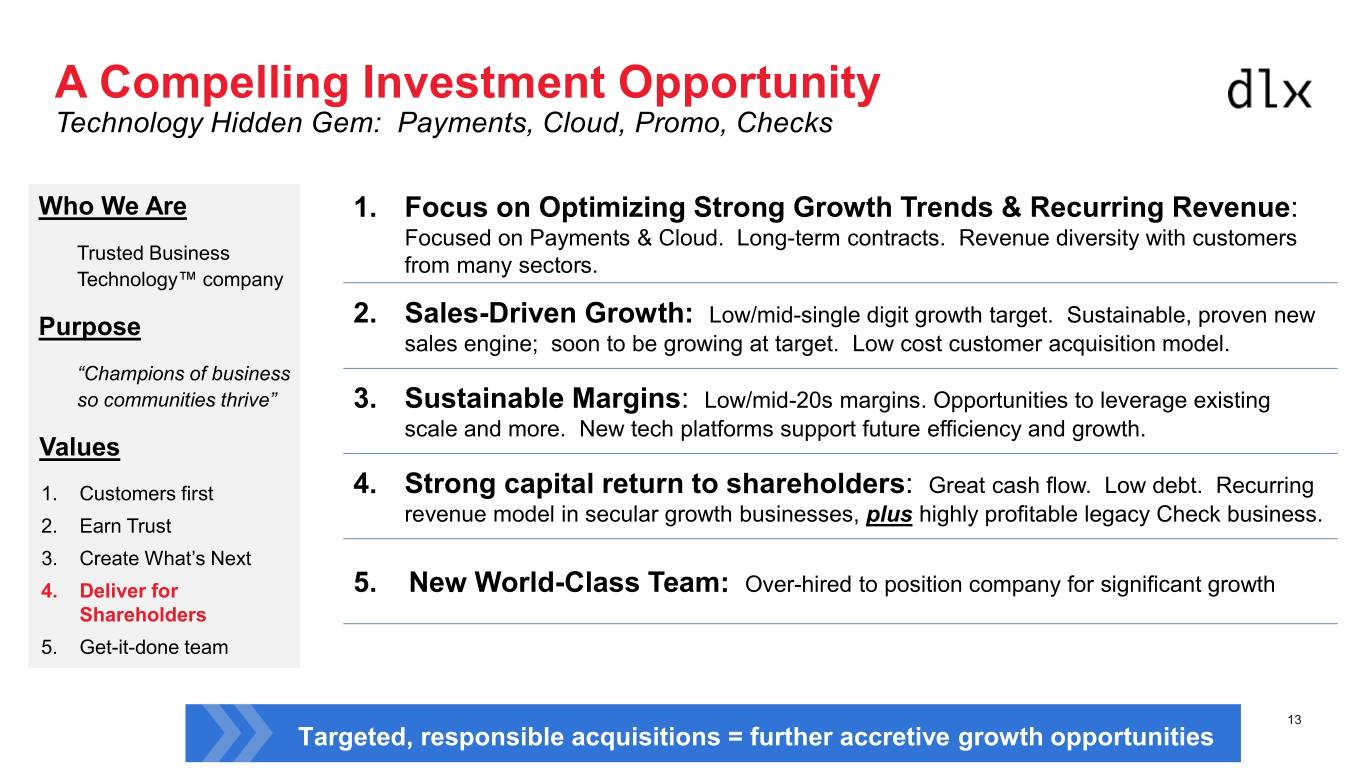
A Compelling Investment Opportunity Technology Hidden Gem: Payments, Cloud, Promo, Checks Who We Are 1. Focus on Optimizing Strong Growth Trends & Recurring Revenue: Focused on Payments & Cloud. Long-term contracts. Revenue diversity with customers Trusted Business from many sectors. Technology™ company Low/mid-single digit growth target. Sustainable, proven new Purpose 2. Sales-Driven Growth: sales engine; soon to be growing at target. Low cost customer acquisition model. “Champions of business so communities thrive” 3. Sustainable Margins: Low/mid-20s margins. Opportunities to leverage existing scale and more. New tech platforms support future efficiency and growth. Values 1. Customers first 4. Strong capital return to shareholders: Great cash flow. Low debt. Recurring revenue model in secular growth businesses, highly profitable legacy Check business. 2. Earn Trust plus 3. Create What’s Next 4. Deliver for 5. New World-Class Team: Over-hired to position company for significant growth Shareholders 5. Get-it-done team 13 Targeted, responsible acquisitions = further accretive growth opportunities


Appendix © Deluxe Financial Services, LLC. Proprietary and Confidential. 15
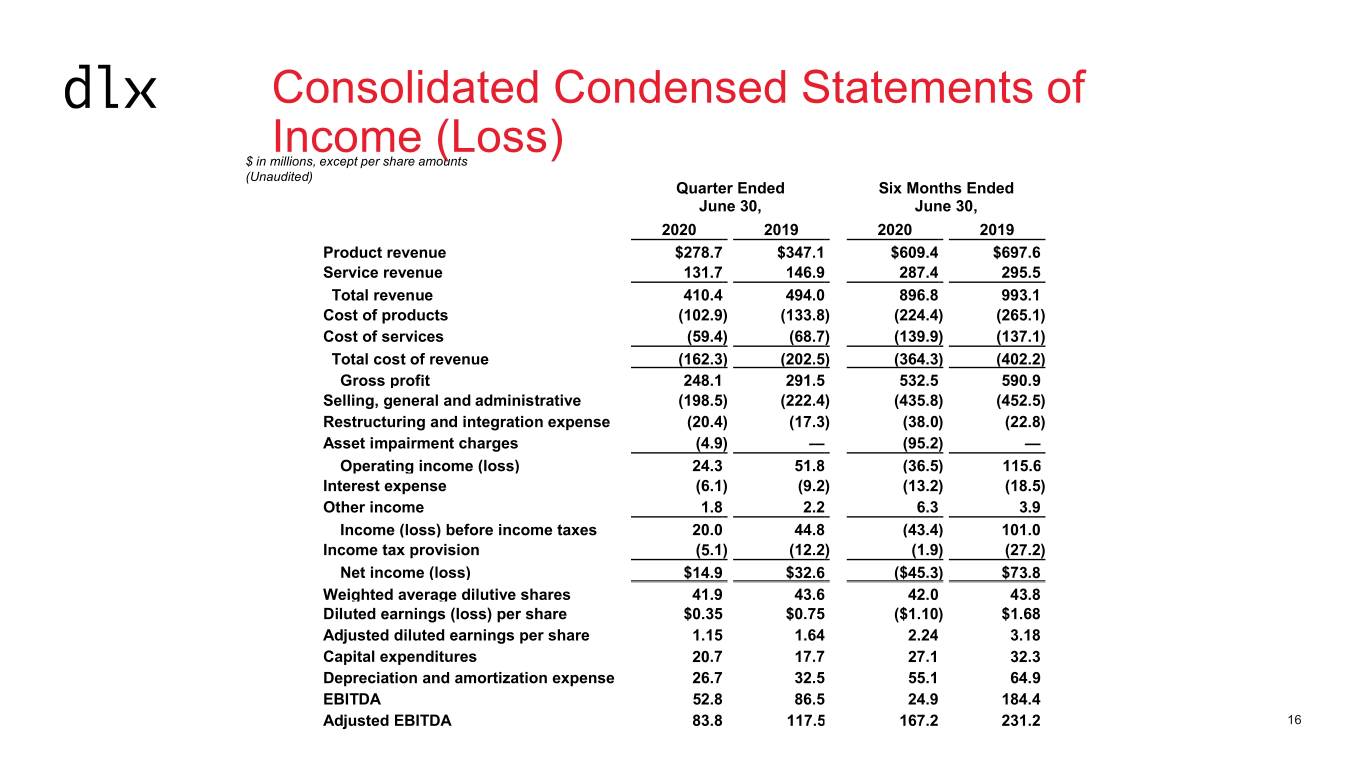
Consolidated Condensed Statements of Income (Loss) $ in millions, except per share amounts (Unaudited) Quarter Ended Six Months Ended June 30, June 30, 2020 2019 2020 2019 Product revenue $278.7 $347.1 $609.4 $697.6 Service revenue 131.7 146.9 287.4 295.5 Total revenue 410.4 494.0 896.8 993.1 Cost of products (102.9 ) (133.8 ) (224.4) (265.1) Cost of services (59.4 ) (68.7 ) (139.9) (137.1) Total cost of revenue (162.3 ) (202.5 ) (364.3) (402.2) Gross profit 248.1 291.5 532.5 590.9 Selling, general and administrative (198.5 ) (222.4 ) (435.8) (452.5) Restructuring and integration expense (20.4 ) (17.3 ) (38.0) (22.8) Asset impairment charges (4.9 ) — (95.2) — Operating income (loss) 24.3 51.8 (36.5) 115.6 Interest expense (6.1 ) (9.2 ) (13.2) (18.5) Other income 1.8 2.2 6.3 3.9 Income (loss) before income taxes 20.0 44.8 (43.4) 101.0 Income tax provision (5.1 ) (12.2 ) (1.9) (27.2) Net income (loss) $14.9 $32.6 ($45.3) $73.8 Weighted average dilutive shares 41.9 43.6 42.0 43.8 Diluted earnings (loss) per share $0.35 $0.75 ($1.10) $1.68 Adjusted diluted earnings per share 1.15 1.64 2.24 3.18 Capital expenditures 20.7 17.7 27.1 32.3 Depreciation and amortization expense 26.7 32.5 55.1 64.9 EBITDA 52.8 86.5 24.9 184.4 Adjusted EBITDA 83.8 117.5 167.2 231.2 16
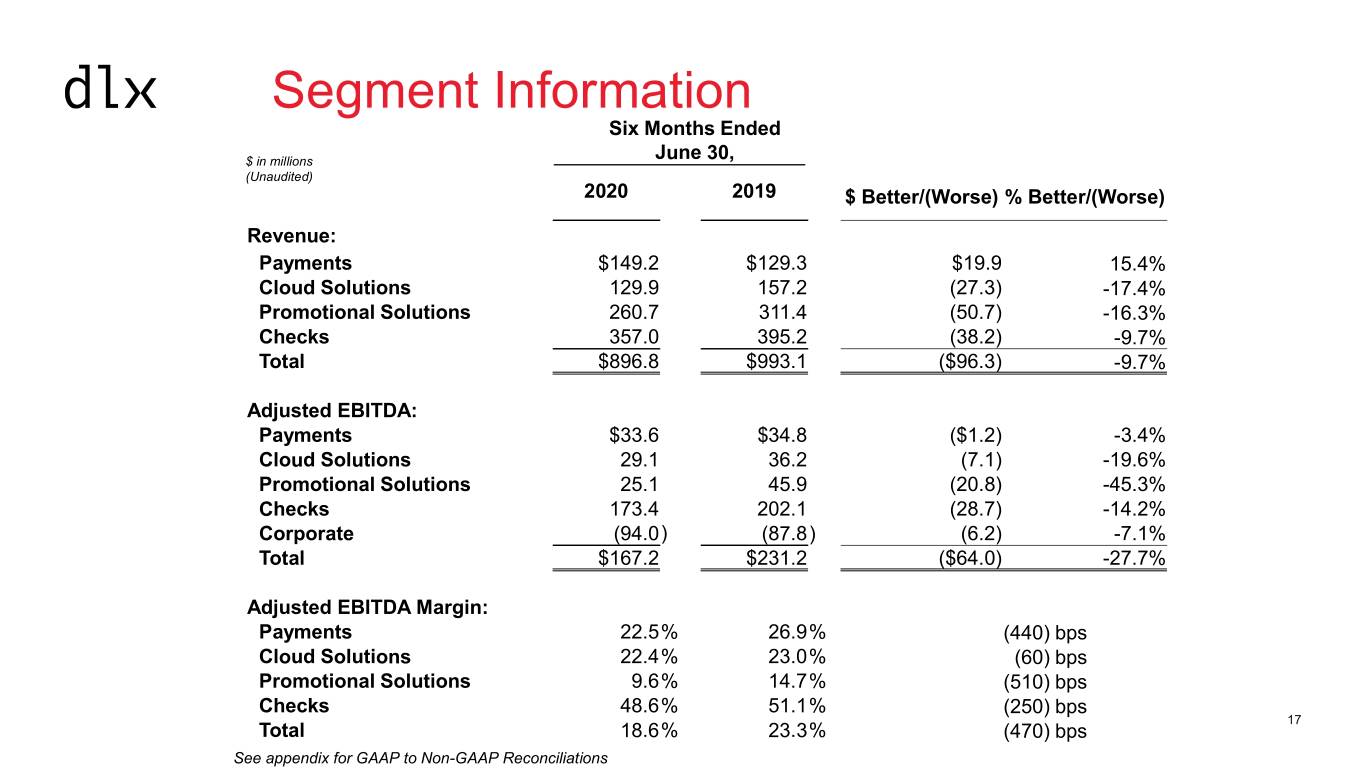
Segment Information Six Months Ended $ in millions June 30, (Unaudited) 2020 2019 $ Better/(Worse) % Better/(Worse) Revenue: Payments $149.2 $129.3 $19.9 15.4% Cloud Solutions 129.9 157.2 (27.3) -17.4% Promotional Solutions 260.7 311.4 (50.7) -16.3% Checks 357.0 395.2 (38.2) -9.7% Total $896.8 $993.1 ($96.3) -9.7% Adjusted EBITDA: Payments $33.6 $34.8 ($1.2) -3.4% Cloud Solutions 29.1 36.2 (7.1) -19.6% Promotional Solutions 25.1 45.9 (20.8) -45.3% Checks 173.4 202.1 (28.7) -14.2% Corporate (94.0) (87.8) (6.2) -7.1% Total $167.2 $231.2 ($64.0) -27.7% Adjusted EBITDA Margin: Payments 22.5% 26.9% (440) bps Cloud Solutions 22.4% 23.0% (60) bps Promotional Solutions 9.6% 14.7% (510) bps Checks 48.6% 51.1% (250) bps 17 Total 18.6% 23.3% (470) bps See appendix for GAAP to Non-GAAP Reconciliations
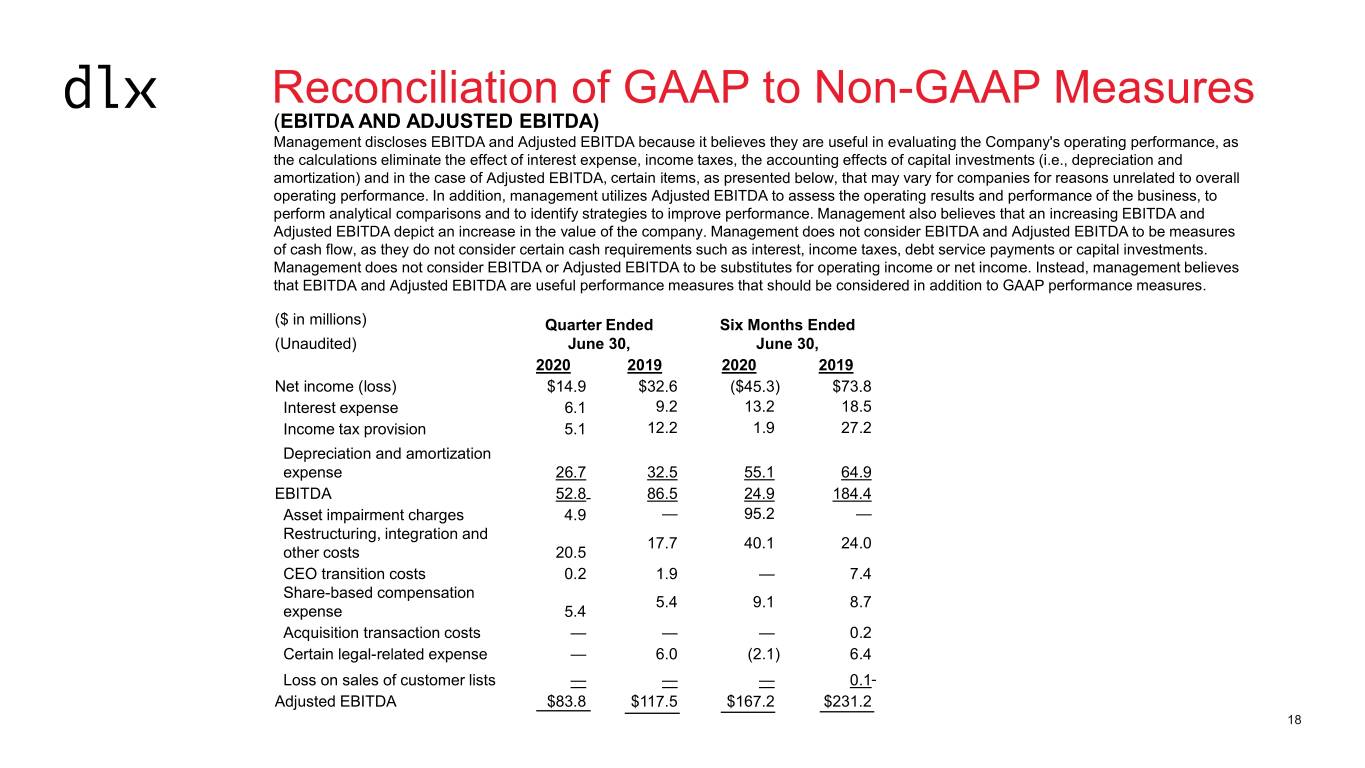
Reconciliation of GAAP to Non-GAAP Measures (EBITDA AND ADJUSTED EBITDA) Management discloses EBITDA and Adjusted EBITDA because it believes they are useful in evaluating the Company's operating performance, as the calculations eliminate the effect of interest expense, income taxes, the accounting effects of capital investments (i.e., depreciation and amortization) and in the case of Adjusted EBITDA, certain items, as presented below, that may vary for companies for reasons unrelated to overall operating performance. In addition, management utilizes Adjusted EBITDA to assess the operating results and performance of the business, to perform analytical comparisons and to identify strategies to improve performance. Management also believes that an increasing EBITDA and Adjusted EBITDA depict an increase in the value of the company. Management does not consider EBITDA and Adjusted EBITDA to be measures of cash flow, as they do not consider certain cash requirements such as interest, income taxes, debt service payments or capital investments. Management does not consider EBITDA or Adjusted EBITDA to be substitutes for operating income or net income. Instead, management believes that EBITDA and Adjusted EBITDA are useful performance measures that should be considered in addition to GAAP performance measures. ($ in millions) Quarter Ended Six Months Ended (Unaudited) June 30, June 30, 2020 2019 2020 2019 Net income (loss) $14.9 $32.6 ($45.3) $73.8 Interest expense 6.1 9.2 13.2 18.5 Income tax provision 5.1 12.2 1.9 27.2 Depreciation and amortization expense 26.7 32.5 55.1 64.9 EBITDA 52.8 86.5 24.9 184.4 Asset impairment charges 4.9 — 95.2 — Restructuring, integration and 17.7 40.1 24.0 other costs 20.5 CEO transition costs 0.2 1.9 — 7.4 Share-based compensation 5.4 9.1 8.7 expense 5.4 Acquisition transaction costs — — — 0.2 Certain legal-related expense — 6.0 (2.1) 6.4 Loss on sales of customer lists — — — 0.1 Adjusted EBITDA $83.8 $117.5 $167.2 $231.2 18
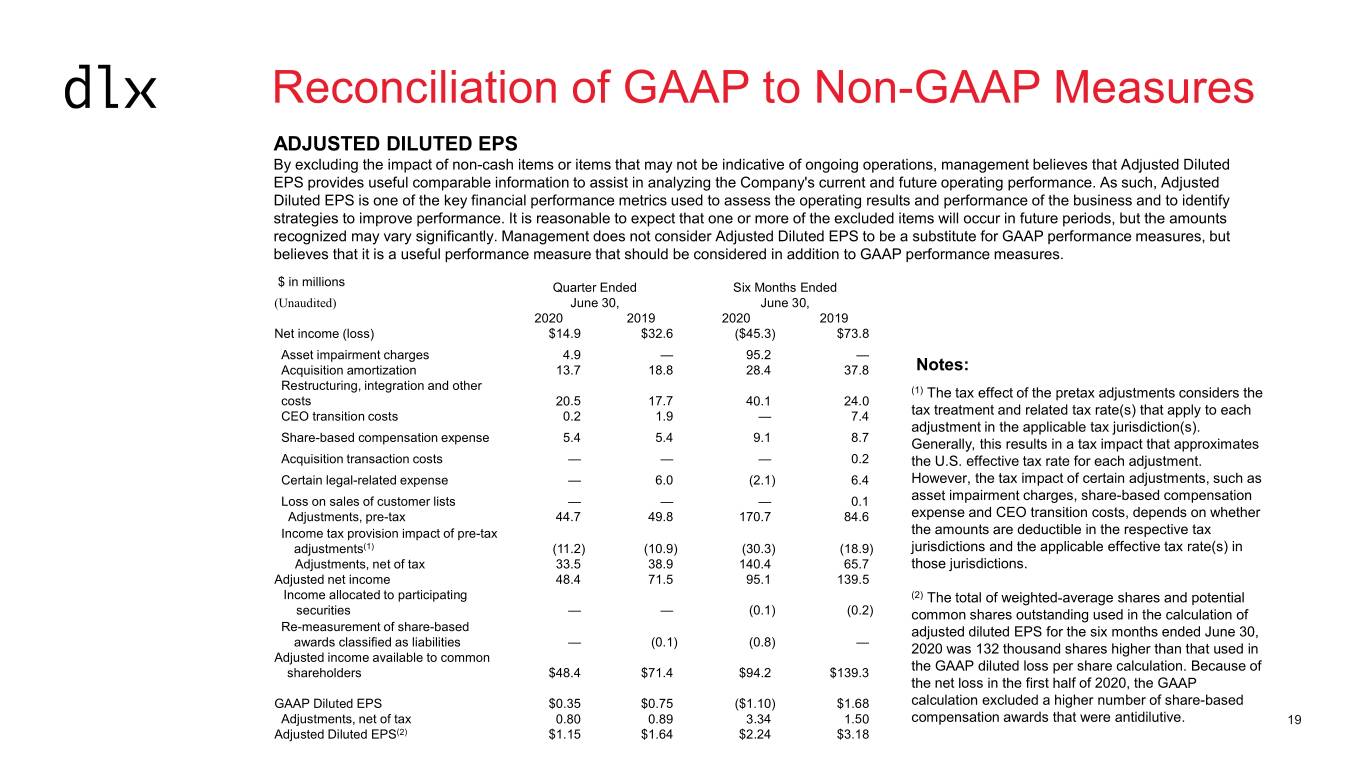
Reconciliation of GAAP to Non-GAAP Measures ADJUSTED DILUTED EPS By excluding the impact of non-cash items or items that may not be indicative of ongoing operations, management believes that Adjusted Diluted EPS provides useful comparable information to assist in analyzing the Company's current and future operating performance. As such, Adjusted Diluted EPS is one of the key financial performance metrics used to assess the operating results and performance of the business and to identify strategies to improve performance. It is reasonable to expect that one or more of the excluded items will occur in future periods, but the amounts recognized may vary significantly. Management does not consider Adjusted Diluted EPS to be a substitute for GAAP performance measures, but believes that it is a useful performance measure that should be considered in addition to GAAP performance measures. $ in millions Quarter Ended Six Months Ended (Unaudited) June 30, June 30, 2020 2019 2020 2019 Net income (loss) $14.9 $32.6 ($45.3) $73.8 Asset impairment charges 4.9 — 95.2 — Acquisition amortization 13.7 18.8 28.4 37.8 Notes: Restructuring, integration and other (1) The tax effect of the pretax adjustments considers the costs 20.5 17.7 40.1 24.0 CEO transition costs 0.2 1.9 — 7.4 tax treatment and related tax rate(s) that apply to each adjustment in the applicable tax jurisdiction(s). Share-based compensation expense 5.4 5.4 9.1 8.7 Generally, this results in a tax impact that approximates Acquisition transaction costs — — — 0.2 the U.S. effective tax rate for each adjustment. Certain legal-related expense — 6.0 (2.1) 6.4 However, the tax impact of certain adjustments, such as Loss on sales of customer lists — — — 0.1 asset impairment charges, share-based compensation Adjustments, pre-tax 44.7 49.8 170.7 84.6 expense and CEO transition costs, depends on whether Income tax provision impact of pre-tax the amounts are deductible in the respective tax adjustments(1) (11.2) (10.9) (30.3) (18.9) jurisdictions and the applicable effective tax rate(s) in Adjustments, net of tax 33.5 38.9 140.4 65.7 those jurisdictions. Adjusted net income 48.4 71.5 95.1 139.5 Income allocated to participating (2) The total of weighted-average shares and potential securities — — (0.1) (0.2) common shares outstanding used in the calculation of Re-measurement of share-based adjusted diluted EPS for the six months ended June 30, awards classified as liabilities — (0.1) (0.8) — 2020 was 132 thousand shares higher than that used in Adjusted income available to common shareholders $48.4 $71.4 $94.2 $139.3 the GAAP diluted loss per share calculation. Because of the net loss in the first half of 2020, the GAAP GAAP Diluted EPS $0.35 $0.75 ($1.10) $1.68 calculation excluded a higher number of share-based Adjustments, net of tax 0.80 0.89 3.34 1.50 compensation awards that were antidilutive. 19 Adjusted Diluted EPS(2) $1.15 $1.64 $2.24 $3.18
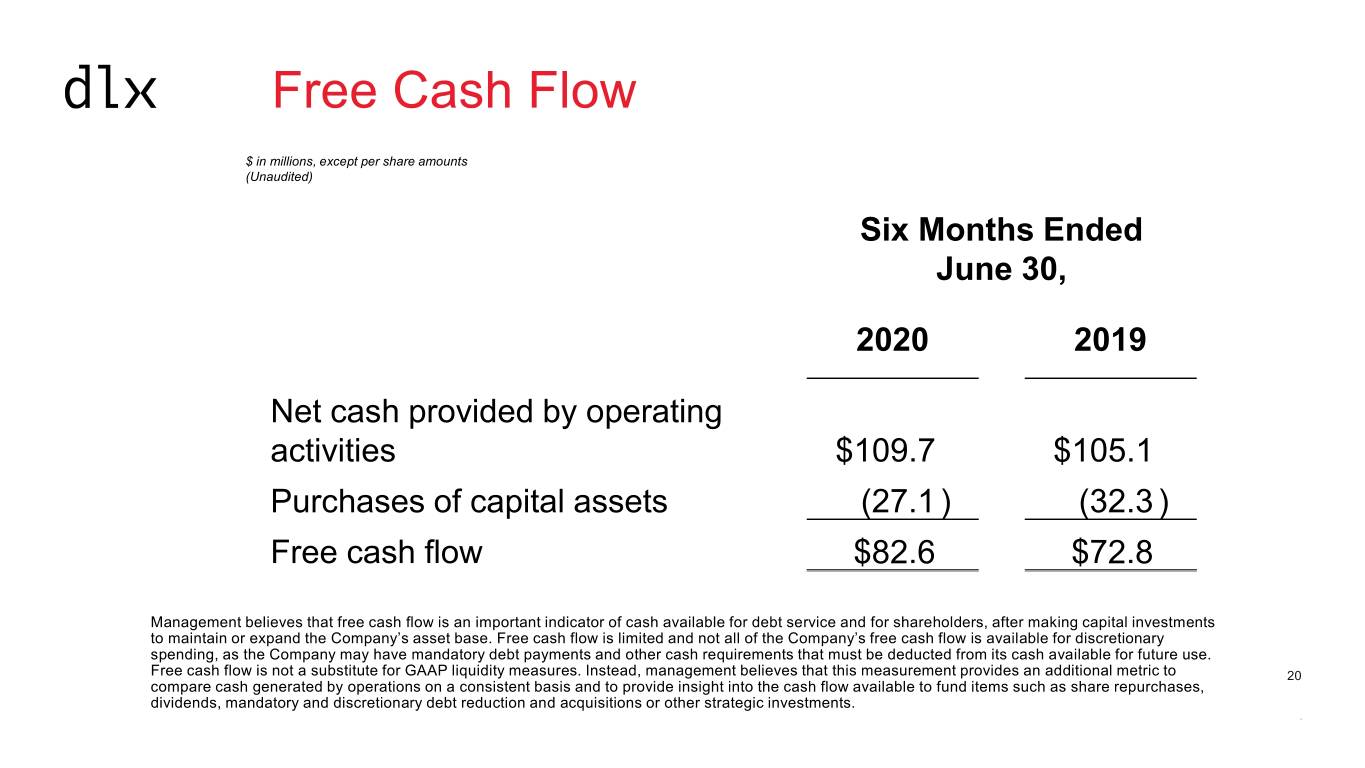
Free Cash Flow $ in millions, except per share amounts (Unaudited) Six Months Ended June 30, 2020 2019 Net cash provided by operating activities $109.7 $105.1 Purchases of capital assets (27.1 ) (32.3 ) Free cash flow $82.6 $72.8 Management believes that free cash flow is an important indicator of cash available for debt service and for shareholders, after making capital investments to maintain or expand the Company’s asset base. Free cash flow is limited and not all of the Company’s free cash flow is available for discretionary spending, as the Company may have mandatory debt payments and other cash requirements that must be deducted from its cash available for future use. Free cash flow is not a substitute for GAAP liquidity measures. Instead, management believes that this measurement provides an additional metric to 20 compare cash generated by operations on a consistent basis and to provide insight into the cash flow available to fund items such as share repurchases, dividends, mandatory and discretionary debt reduction and acquisitions or other strategic investments. 20