EX-99.1
Published on March 25, 2021

© 2020 Deluxe Corporation Investor Presentation March 24, 2021
2 Cautionary Statement This presentation highlights management’s intentions, projections, financial estimates or expectations about the company's future strategy or performance and are forward-looking in nature as defined in the Private Securities Litigation Reform Act of 1995. These comments are subject to risks and uncertainties, including risks related to potential continuing negative impacts from pandemic health issues, such as the coronavirus / COVID-19, along with the impact of government stay-at-home orders or other similar directives on our future financial results of operations, our future financial condition, and our ability to continue business activities in affected regions, which could cause our actual results to differ materially from our projections. Additional information about factors that might cause our actual results to differ from projections is contained in the company's Form 10-K for the year ended December 31, 2020 and other SEC filings. Any references to non- GAAP financial measures are reconciled to the comparable GAAP financial measures in fourth quarter and full year 2020 earnings release or other SEC filings.
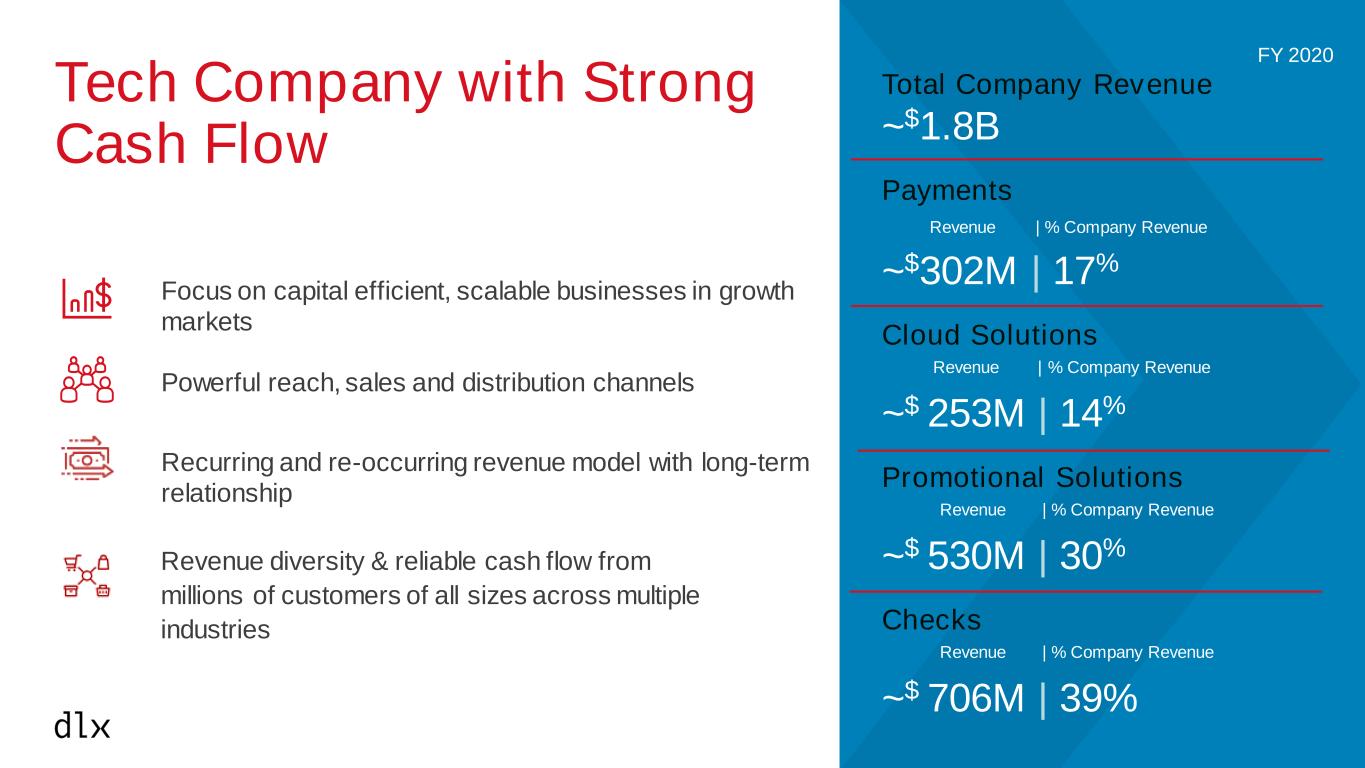
3 Tech Company with Strong Cash Flow Revenue diversity & reliable cash flow from millions of customers of all sizes across multiple industries Powerful reach, sales and distribution channels Focus on capital efficient, scalable businesses in growth markets Recurring and re-occurring revenue model with long-term relationship FY 2020 Total Company Revenue ~$1.8B Payments Revenue | % Company Revenue ~$302M | 17% Cloud Solutions Revenue | % Company Revenue ~$ 253M | 14% Promotional Solutions Revenue | % Company Revenue ~$ 530M | 30% Checks Revenue | % Company Revenue ~$ 706M | 39%
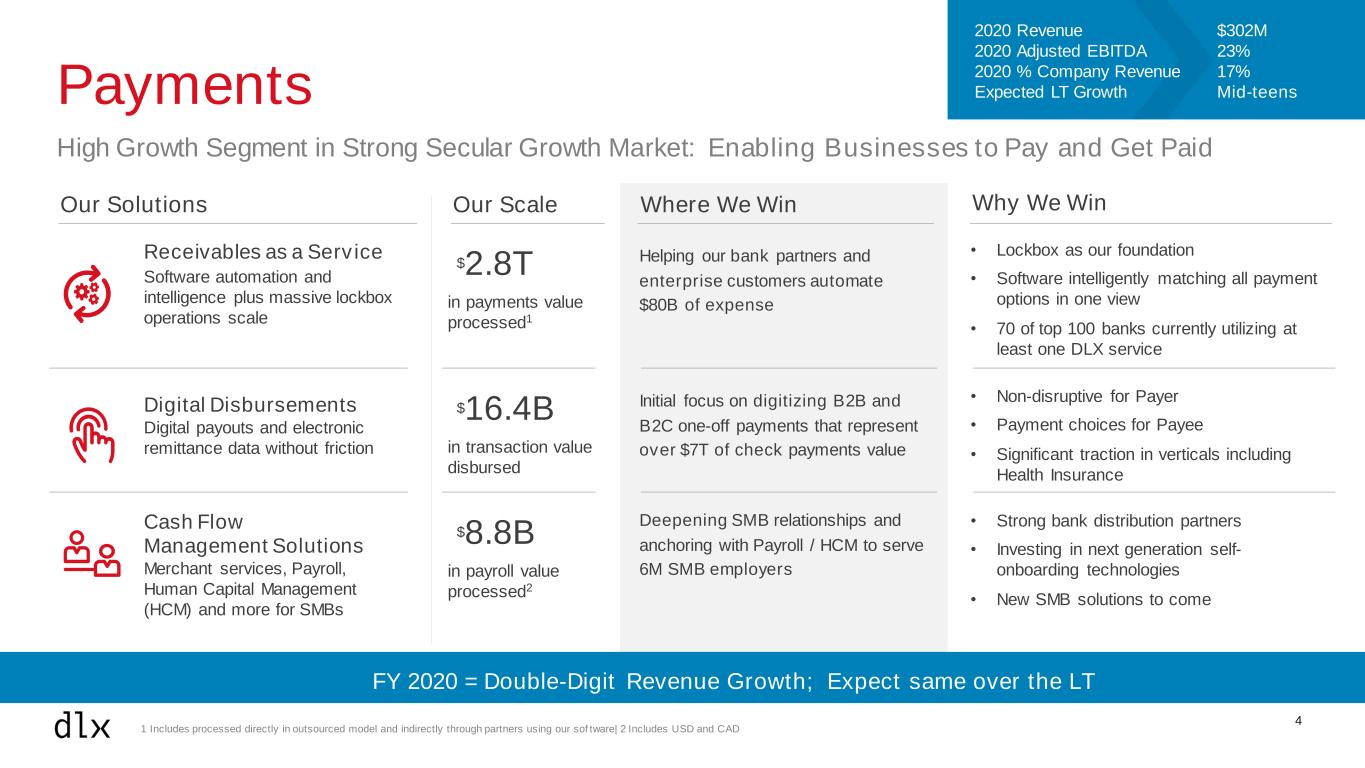
4 Payments High Growth Segment in Strong Secular Growth Market: Enabling Businesses to Pay and Get Paid Our Solutions Receivables as a Service Software automation and intelligence plus massive lockbox operations scale Our Scale Digital Disbursements Digital payouts and electronic remittance data without friction Cash Flow Management Solutions Merchant services, Payroll, Human Capital Management (HCM) and more for SMBs $16.4B in transaction value disbursed $2.8T in payments value processed1 $8.8B in payroll value processed2 Where We Win Why We Win Helping our bank partners and enterprise customers automate $80B of expense Initial focus on digitizing B2B and B2C one-off payments that represent over $7T of check payments value Deepening SMB relationships and anchoring with Payroll / HCM to serve 6M SMB employers • Lockbox as our foundation • Software intelligently matching all payment options in one view • 70 of top 100 banks currently utilizing at least one DLX service • Non-disruptive for Payer • Payment choices for Payee • Significant traction in verticals including Health Insurance • Strong bank distribution partners • Investing in next generation self- onboarding technologies • New SMB solutions to come FY 2020 = Double-Digit Revenue Growth; Expect same over the LT 1 Includes processed directly in outsourced model and indirectly through partners using our sof tware| 2 Includes USD and CAD 2020 Revenue $302M 2020 Adjusted EBITDA 23% 2020 % Company Revenue 17% Expected LT Growth Mid-teens
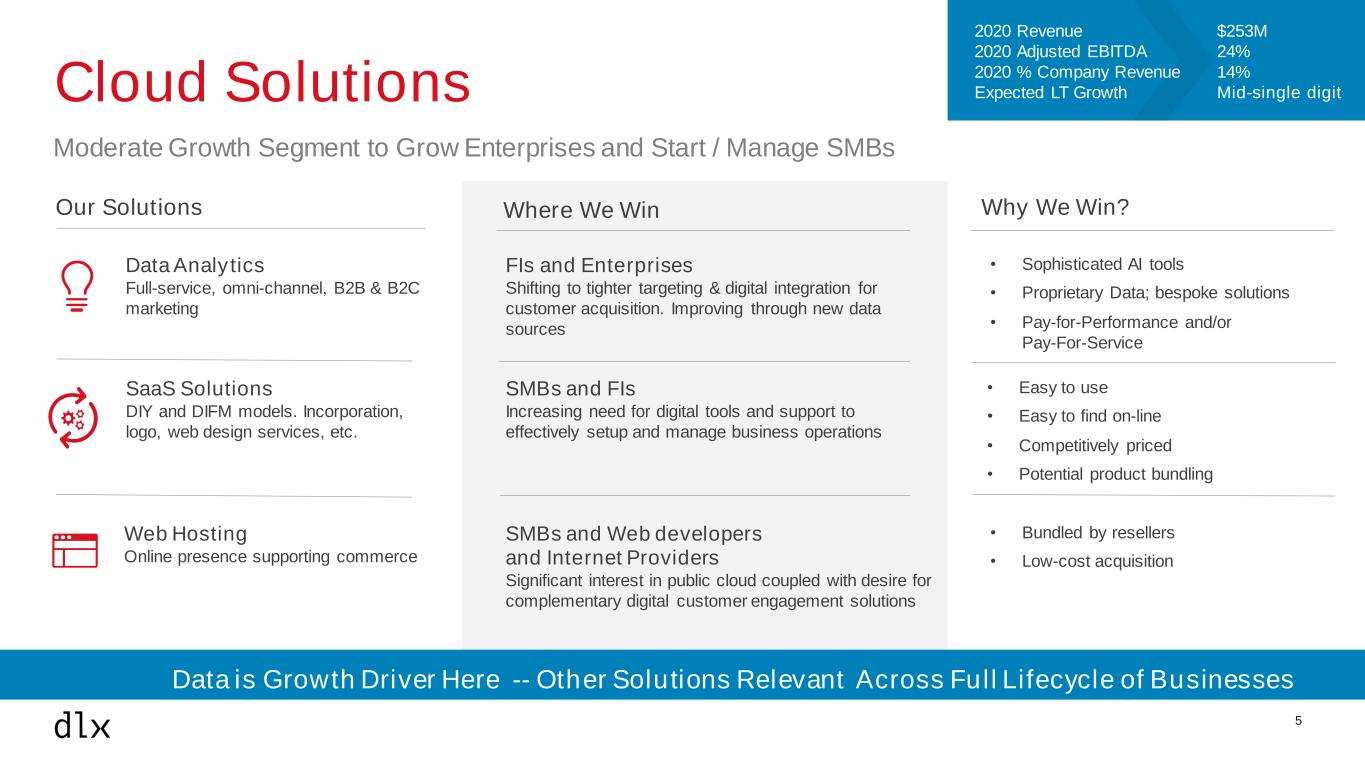
5 Cloud Solutions Moderate Growth Segment to Grow Enterprises and Start / Manage SMBs Our Solutions SaaS Solutions DIY and DIFM models. Incorporation, logo, web design services, etc. Web Hosting Online presence supporting commerce Where We Win SMBs and FIs Increasing need for digital tools and support to effectively setup and manage business operations SMBs and Web developers and Internet Providers Significant interest in public cloud coupled with desire for complementary digital customer engagement solutions Why We Win? • Easy to use • Easy to find on-line • Competitively priced • Potential product bundling • Bundled by resellers • Low-cost acquisition Data Analytics Full-service, omni-channel, B2B & B2C marketing FIs and Enterprises Shifting to tighter targeting & digital integration for customer acquisition. Improving through new data sources • Sophisticated AI tools • Proprietary Data; bespoke solutions • Pay-for-Performance and/or Pay-For-Service 2020 Revenue $253M 2020 Adjusted EBITDA 24% 2020 % Company Revenue 14% Expected LT Growth Mid-single digit Data is Growth Driver Here -- Other Solutions Relevant Across Full Lifecycle of Businesses

6 Promotional Solutions Tech Platform: Helps business manage their Brand. Produce and Manage: Physical Business-Branded Products. Our Solutions Traditional Business Essentials • Branded forms • Branded direct mailing pieces • Branded physical products Market Growth • Flat • Continue to increase scale Why We Win? Platform to Manage a Business’s Physical Brand Impression • Customized • Ease of access • Reporting insights • Self-service platform • Omni-channel distribution • Well-curated selection • Rapid innovation • SMBs • Enterprises • Global Brands Turn-Key Business-Branded Product/Inventory Management • Managed Service • Branded merchandising • Recurring revenue streams Support Rapidly Changing Market Demands • Rapid prototyping • Deep sources of supply • Meet unique needs • Ease of access • Reporting insights Where We Win 2020 Revenue $530M 2020 Adjusted EBITDA 13% 2020 % Company Revenue 30% Expected LT Growth Low-single digit Easy and Fast Cross-Sell to Existing Customers
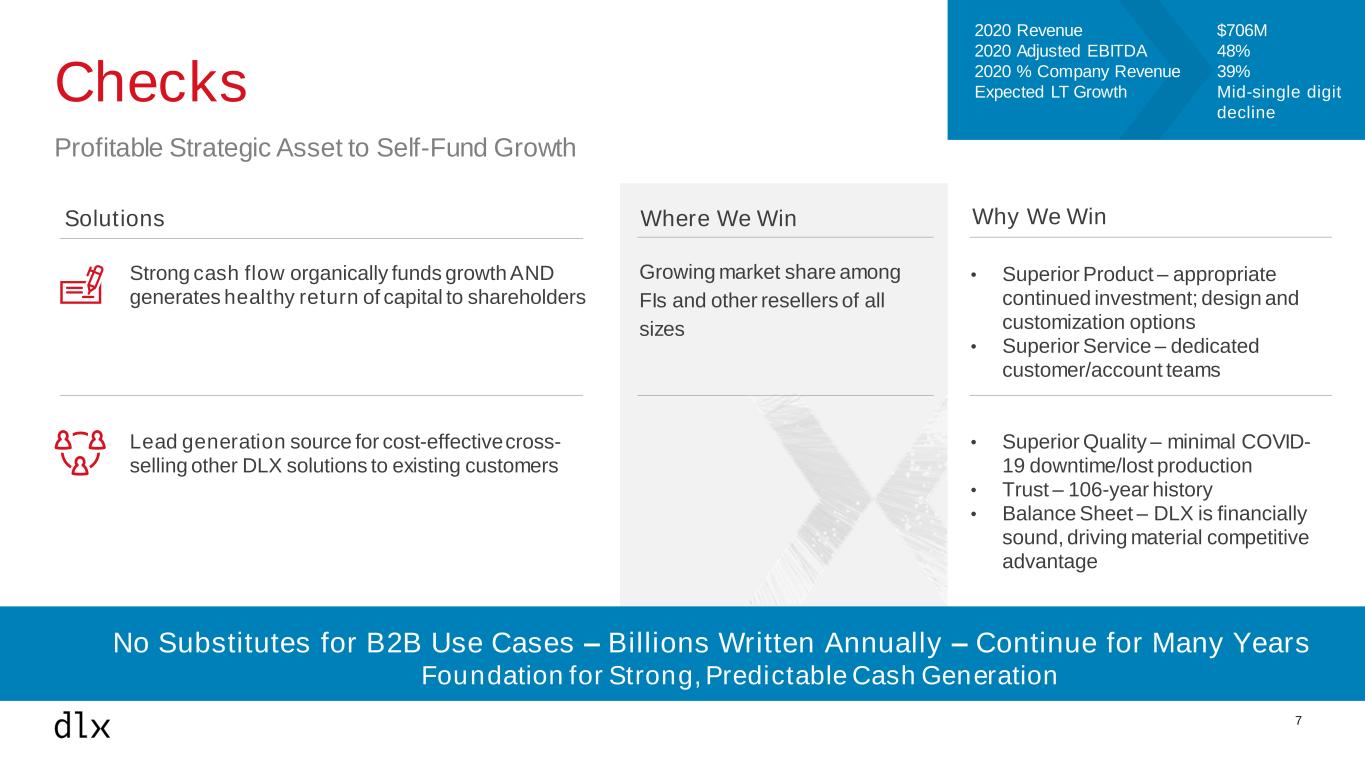
2020 Revenue $706M 2020 Adjusted EBITDA 48% 2020 % Company Revenue 39% Expected LT Growth Mid-single digit decline 7 Checks Profitable Strategic Asset to Self-Fund Growth Strong cash flow organically funds growth AND generates healthy return of capital to shareholders Lead generation source for cost-effective cross- selling other DLX solutions to existing customers No Substitutes for B2B Use Cases – Billions Written Annually – Continue for Many Years Foundation for Strong, Predictable Cash Generation Where We Win Why We Win Growing market share among FIs and other resellers of all sizes • Superior Product – appropriate continued investment; design and customization options • Superior Service – dedicated customer/account teams • Superior Quality – minimal COVID- 19 downtime/lost production • Trust – 106-year history • Balance Sheet – DLX is financially sound, driving material competitive advantage Solutions
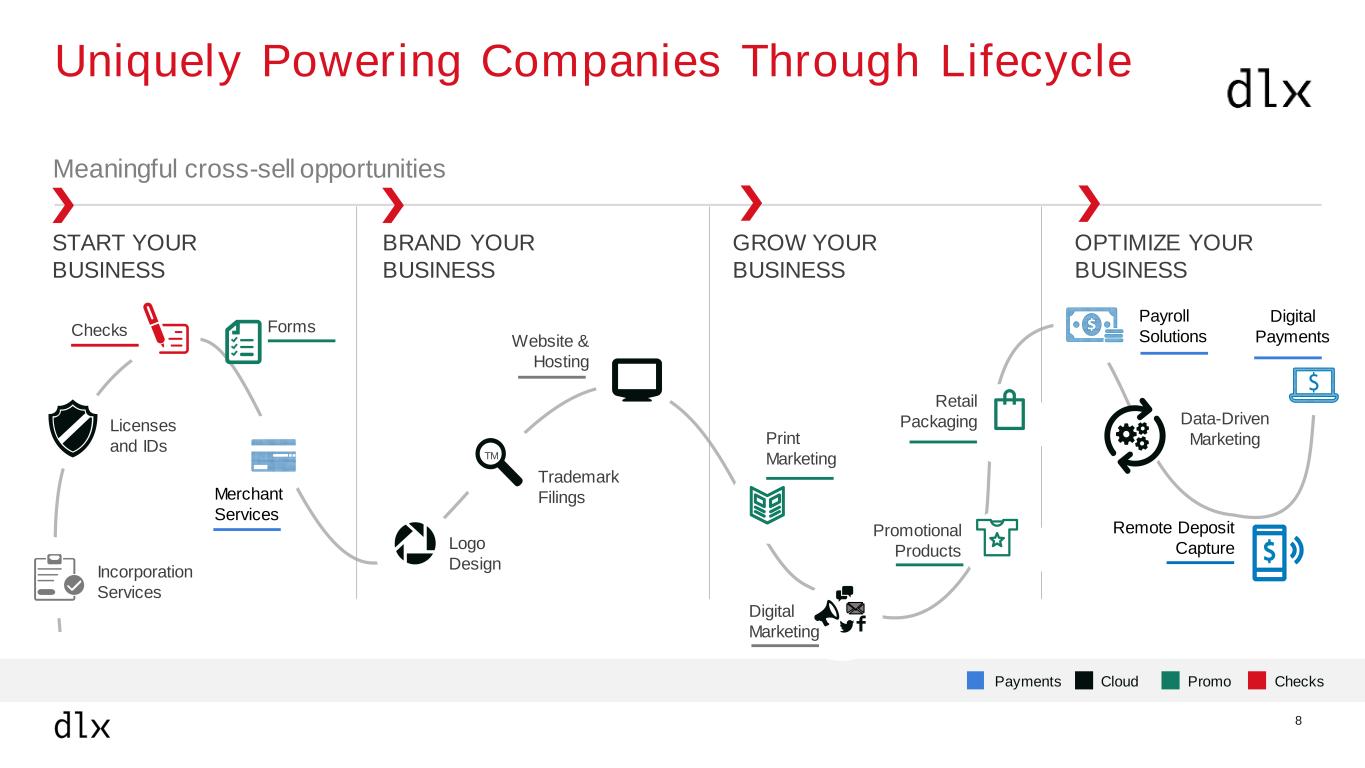
8 Uniquely Powering Companies Through Lifecycle Meaningful cross-sell opportunities START YOUR BUSINESS BRAND YOUR BUSINESS GROW YOUR BUSINESS OPTIMIZE YOUR BUSINESS ChecksCloud PromoPayments Checks Forms Print Marketing Promotional Products Retail Packaging Merchant Services Payroll Solutions Remote Deposit Capture Digital PaymentsWebsite & Hosting Data-Driven Marketing Digital Marketing Logo Design Licenses and IDs Incorporation Services Trademark Filings TM
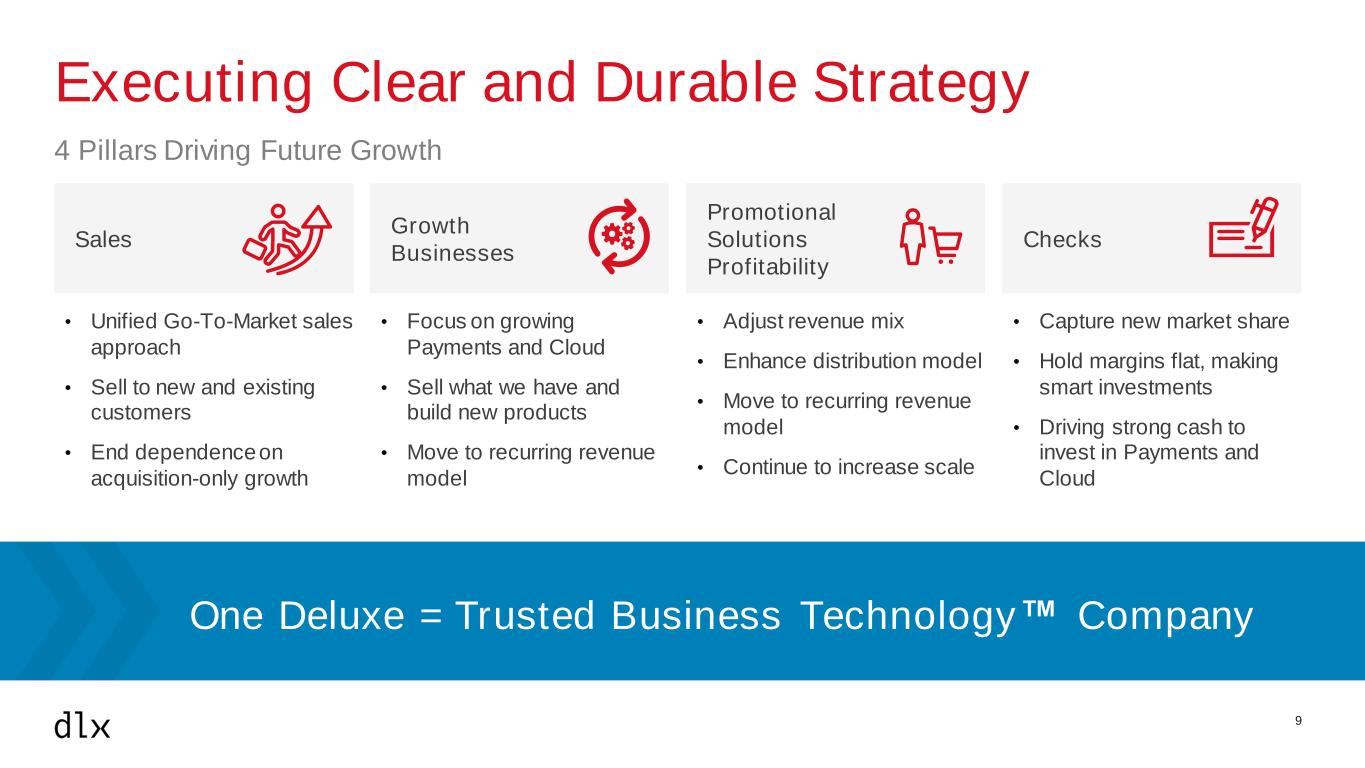
9 Executing Clear and Durable Strategy 4 Pillars Driving Future Growth Sales Growth Businesses Promotional Solutions Profitability Checks • Unified Go-To-Market sales approach • Sell to new and existing customers • End dependence on acquisition-only growth • Focus on growing Payments and Cloud • Sell what we have and build new products • Move to recurring revenue model • Adjust revenue mix • Enhance distribution model • Move to recurring revenue model • Continue to increase scale • Capture new market share • Hold margins flat, making smart investments • Driving strong cash to invest in Payments and Cloud One Deluxe = Trusted Business Technology™ Company
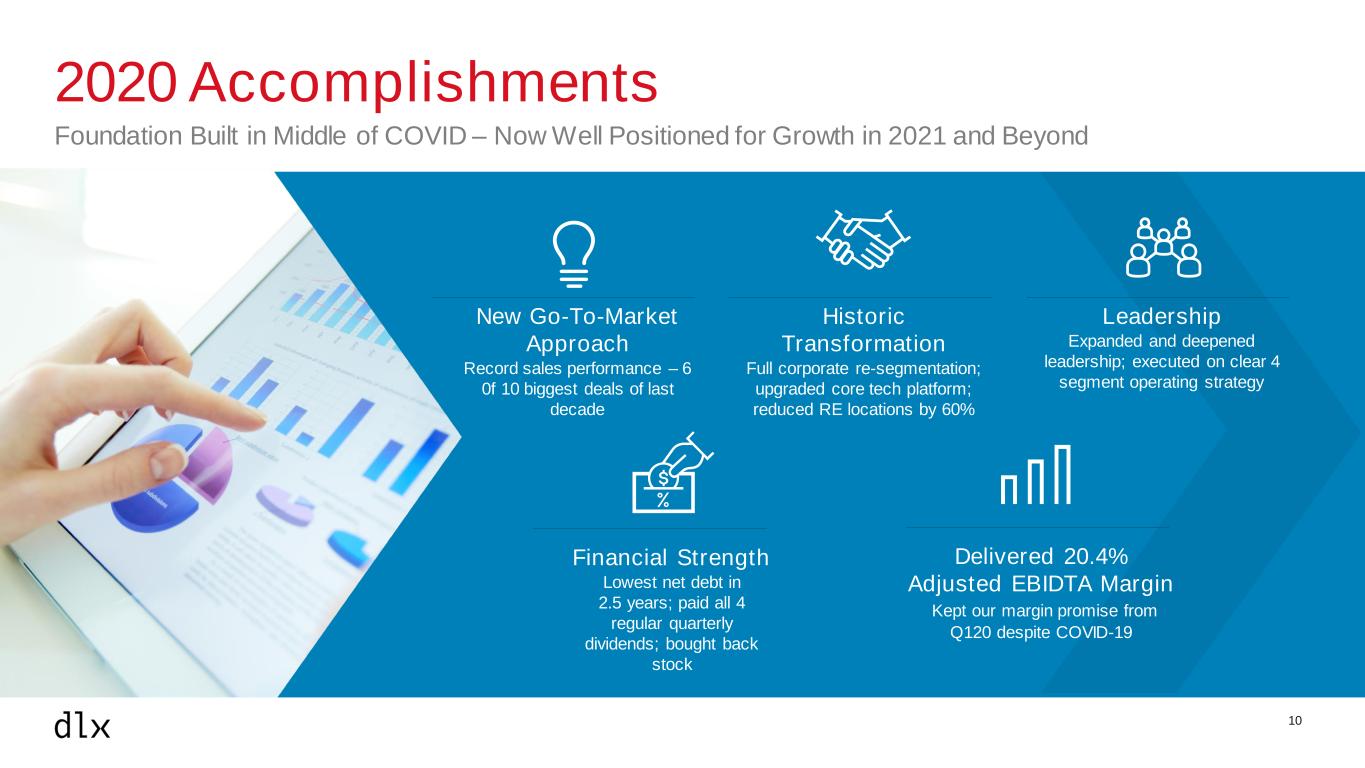
10 2020 Accomplishments Foundation Built in Middle of COVID – Now Well Positioned for Growth in 2021 and Beyond Delivered 20.4% Adjusted EBIDTA Margin Kept our margin promise from Q120 despite COVID-19 Financial Strength Lowest net debt in 2.5 years; paid all 4 regular quarterly dividends; bought back stock Historic Transformation Full corporate re-segmentation; upgraded core tech platform; reduced RE locations by 60% Leadership Expanded and deepened leadership; executed on clear 4 segment operating strategy New Go-To-Market Approach Record sales performance – 6 0f 10 biggest deals of last decade
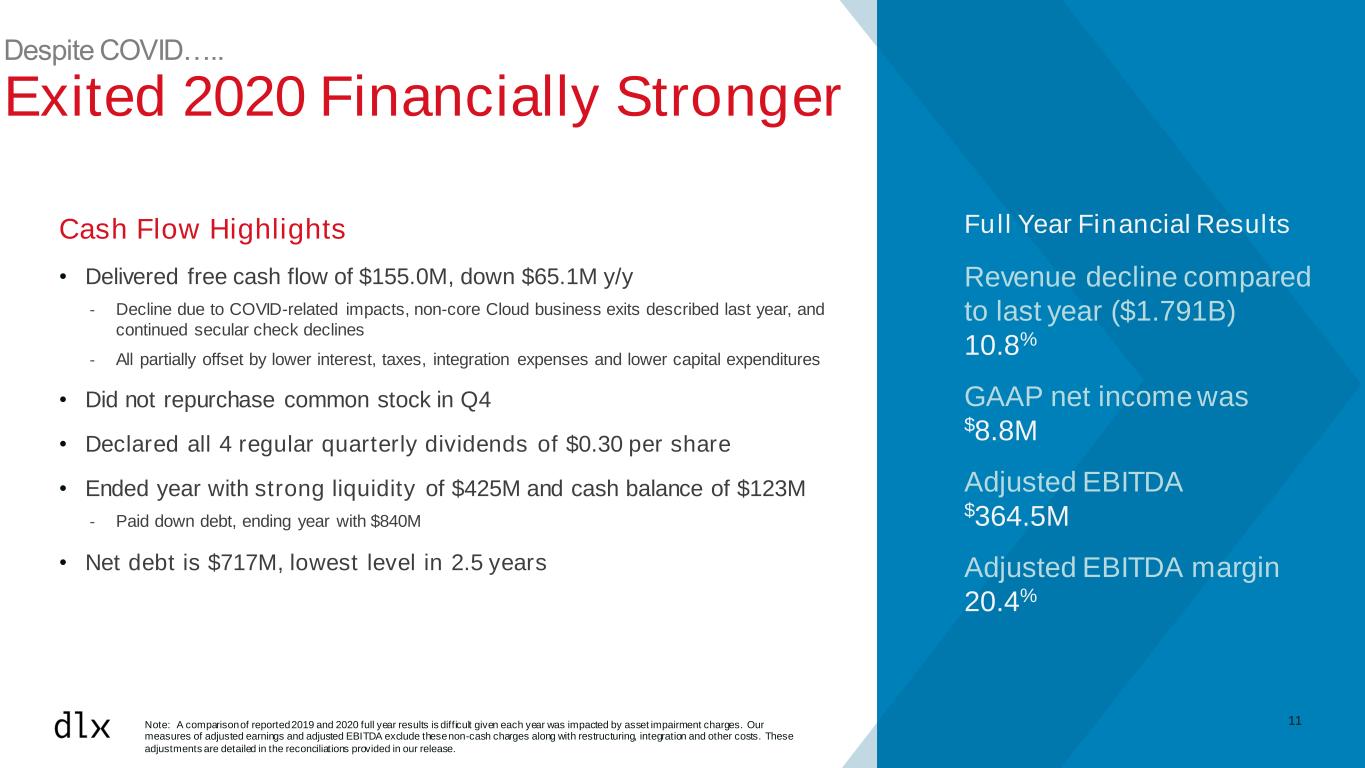
11 Despite COVID….. Exited 2020 Financially Stronger Note: A comparison of reported 2019 and 2020 full year results is difficult given each year was impacted by asset impairment charges. Our measures of adjusted earnings and adjusted EBITDA exclude these non-cash charges along with restructuring, integration and other costs. These adjustments are detailed in the reconciliations provided in our release. Full Year Financial Results Revenue decline compared to last year ($1.791B) 10.8% GAAP net income was $8.8M Adjusted EBITDA $364.5M Adjusted EBITDA margin 20.4% Cash Flow Highlights • Delivered free cash flow of $155.0M, down $65.1M y/y - Decline due to COVID-related impacts, non-core Cloud business exits described last year, and continued secular check declines - All partially offset by lower interest, taxes, integration expenses and lower capital expenditures • Did not repurchase common stock in Q4 • Declared all 4 regular quarterly dividends of $0.30 per share • Ended year with strong liquidity of $425M and cash balance of $123M - Paid down debt, ending year with $840M • Net debt is $717M, lowest level in 2.5 years
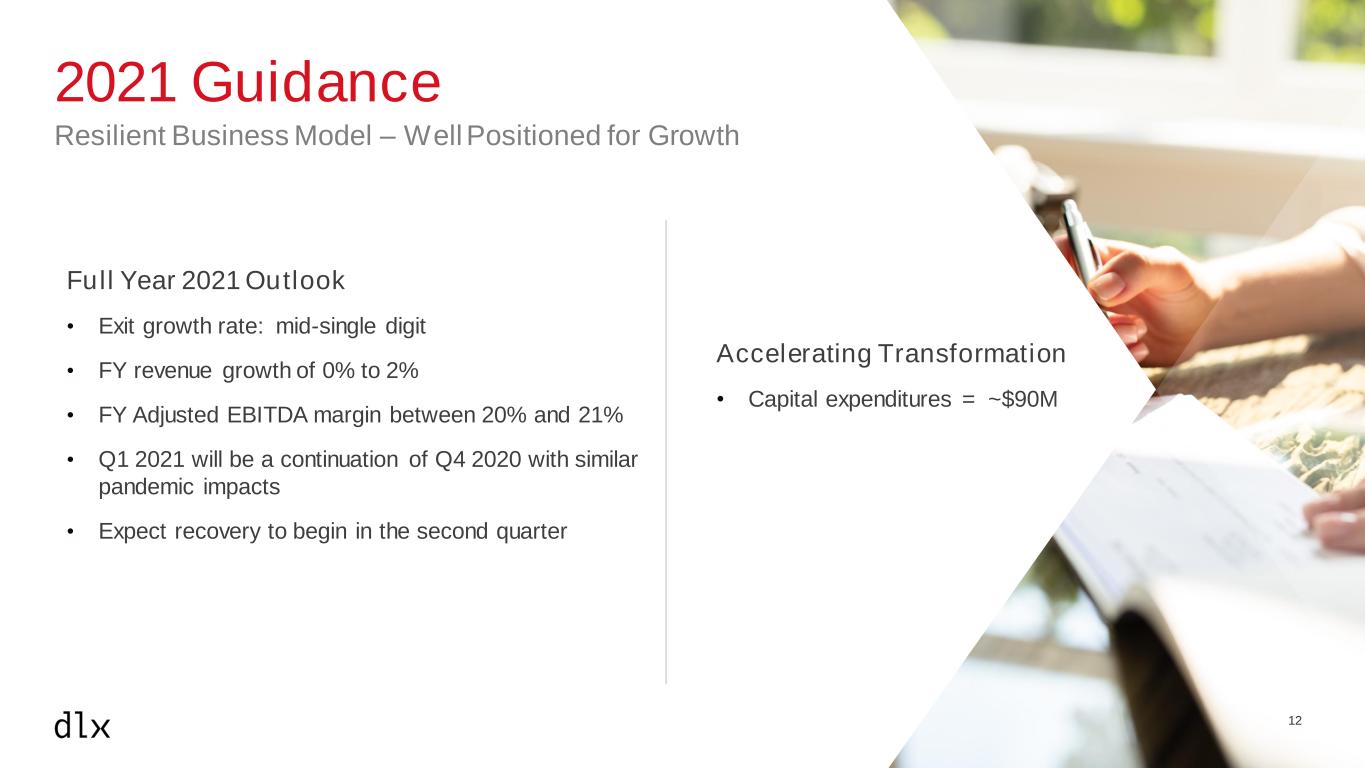
12 2021 Guidance Resilient Business Model – Well Positioned for Growth Full Year 2021 Outlook • Exit growth rate: mid-single digit • FY revenue growth of 0% to 2% • FY Adjusted EBITDA margin between 20% and 21% • Q1 2021 will be a continuation of Q4 2020 with similar pandemic impacts • Expect recovery to begin in the second quarter Accelerating Transformation • Capital expenditures = ~$90M
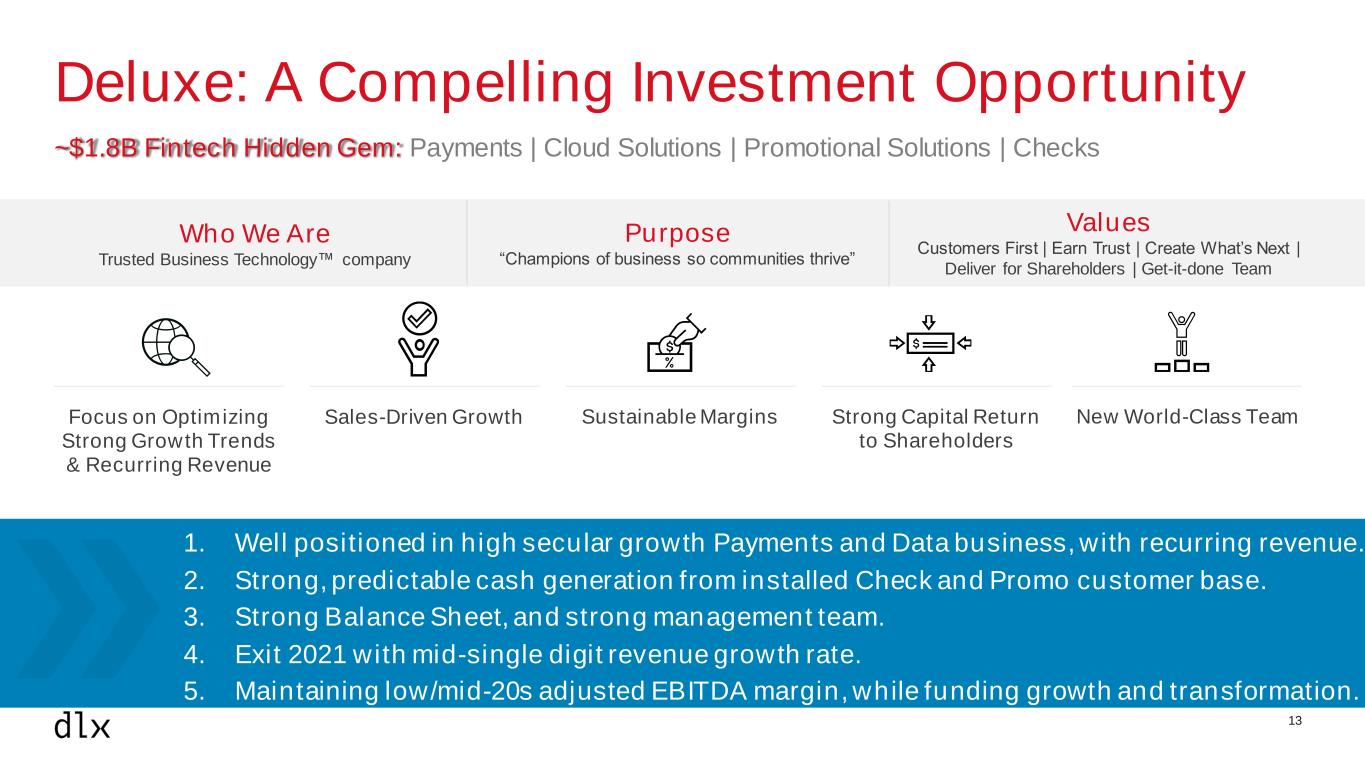
13 Deluxe: A Compelling Investment Opportunity ~$1.8B Fintech Hidden Gem: Payments | Cloud Solutions | Promotional Solutions | Checks Purpose “Champions of business so communities thrive” Values Customers First | Earn Trust | Create What’s Next | Deliver for Shareholders | Get-it-done Team Who We Are Trusted Business Technology™ company Focus on Optimizing Strong Growth Trends & Recurring Revenue Sales-Driven Growth Sustainable Margins Strong Capital Return to Shareholders New World-Class Team 1. Well positioned in high secular growth Payments and Data business, with recurring revenue. 2. Strong, predictable cash generation from installed Check and Promo customer base. 3. Strong Balance Sheet, and strong management team. 4. Exit 2021 with mid-single digit revenue growth rate. 5. Maintaining low/mid-20s adjusted EBITDA margin, while funding growth and transformation.


15 Appendix
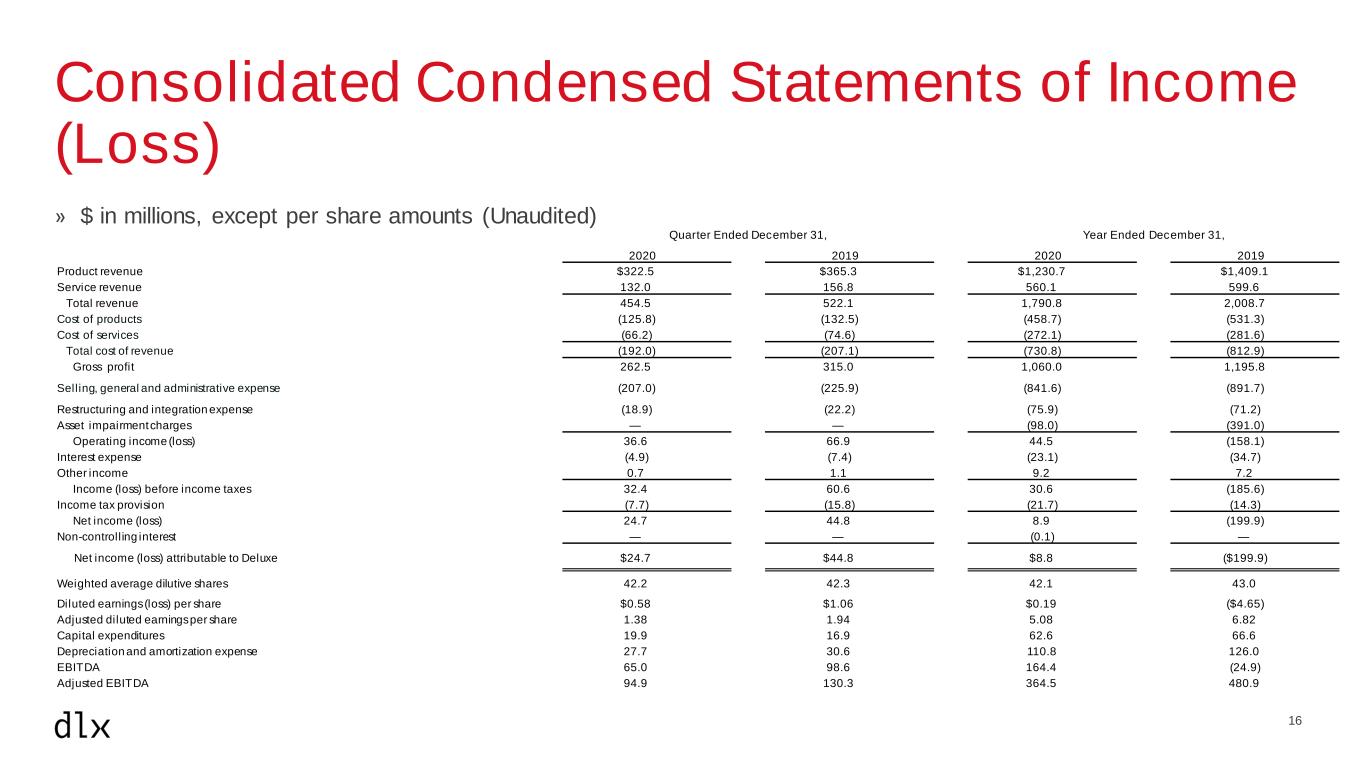
16 Consolidated Condensed Statements of Income (Loss) » $ in millions, except per share amounts (Unaudited) Quarter Ended December 31, Year Ended December 31, 2020 2019 2020 2019 Product revenue $322.5 $365.3 $1,230.7 $1,409.1 Service revenue 132.0 156.8 560.1 599.6 Total revenue 454.5 522.1 1,790.8 2,008.7 Cost of products (125.8) (132.5) (458.7) (531.3) Cost of services (66.2) (74.6) (272.1) (281.6) Total cost of revenue (192.0) (207.1) (730.8) (812.9) Gross profit 262.5 315.0 1,060.0 1,195.8 Selling, general and administrative expense (207.0) (225.9) (841.6) (891.7) Restructuring and integration expense (18.9) (22.2) (75.9) (71.2) Asset impairment charges — — (98.0) (391.0) Operating income (loss) 36.6 66.9 44.5 (158.1) Interest expense (4.9) (7.4) (23.1) (34.7) Other income 0.7 1.1 9.2 7.2 Income (loss) before income taxes 32.4 60.6 30.6 (185.6) Income tax provision (7.7) (15.8) (21.7) (14.3) Net income (loss) 24.7 44.8 8.9 (199.9) Non-controll ing interest — — (0.1) — Net income (loss) attributable to Deluxe $24.7 $44.8 $8.8 ($199.9) Weighted average dilutive shares 42.2 42.3 42.1 43.0 Diluted earnings (loss) per share $0.58 $1.06 $0.19 ($4.65) Adjusted diluted earnings per share 1.38 1.94 5.08 6.82 Capital expenditures 19.9 16.9 62.6 66.6 Depreciation and amortization expense 27.7 30.6 110.8 126.0 EBITDA 65.0 98.6 164.4 (24.9) Adjusted EBITDA 94.9 130.3 364.5 480.9
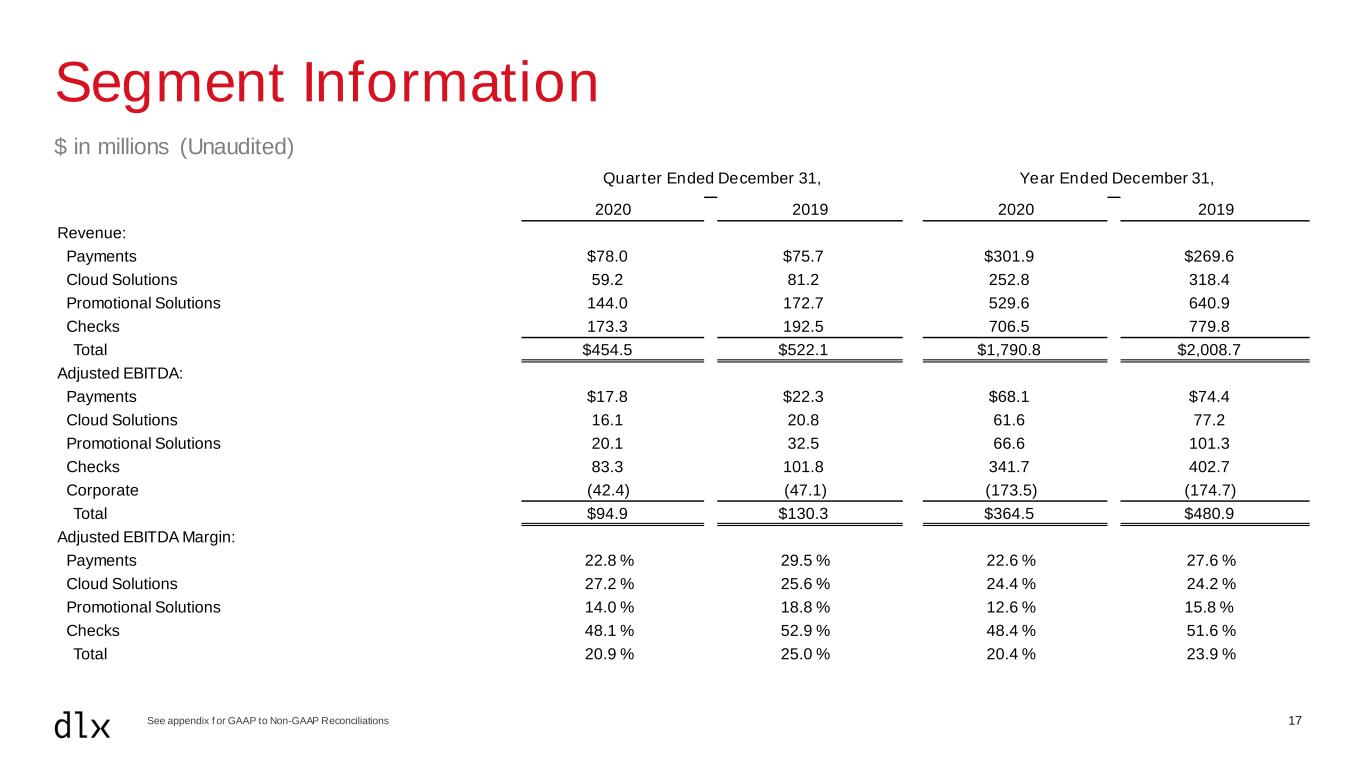
17 Segment Information $ in millions (Unaudited) See appendix f or GAAP to Non-GAAP Reconciliations Quarter Ended December 31, Year Ended December 31, 2020 2019 2020 2019 Revenue: Payments $78.0 $75.7 $301.9 $269.6 Cloud Solutions 59.2 81.2 252.8 318.4 Promotional Solutions 144.0 172.7 529.6 640.9 Checks 173.3 192.5 706.5 779.8 Total $454.5 $522.1 $1,790.8 $2,008.7 Adjusted EBITDA: Payments $17.8 $22.3 $68.1 $74.4 Cloud Solutions 16.1 20.8 61.6 77.2 Promotional Solutions 20.1 32.5 66.6 101.3 Checks 83.3 101.8 341.7 402.7 Corporate (42.4) (47.1) (173.5) (174.7) Total $94.9 $130.3 $364.5 $480.9 Adjusted EBITDA Margin: Payments 22.8 % 29.5 % 22.6 % 27.6 % Cloud Solutions 27.2 % 25.6 % 24.4 % 24.2 % Promotional Solutions 14.0 % 18.8 % 12.6 % 15.8 % Checks 48.1 % 52.9 % 48.4 % 51.6 % Total 20.9 % 25.0 % 20.4 % 23.9 %
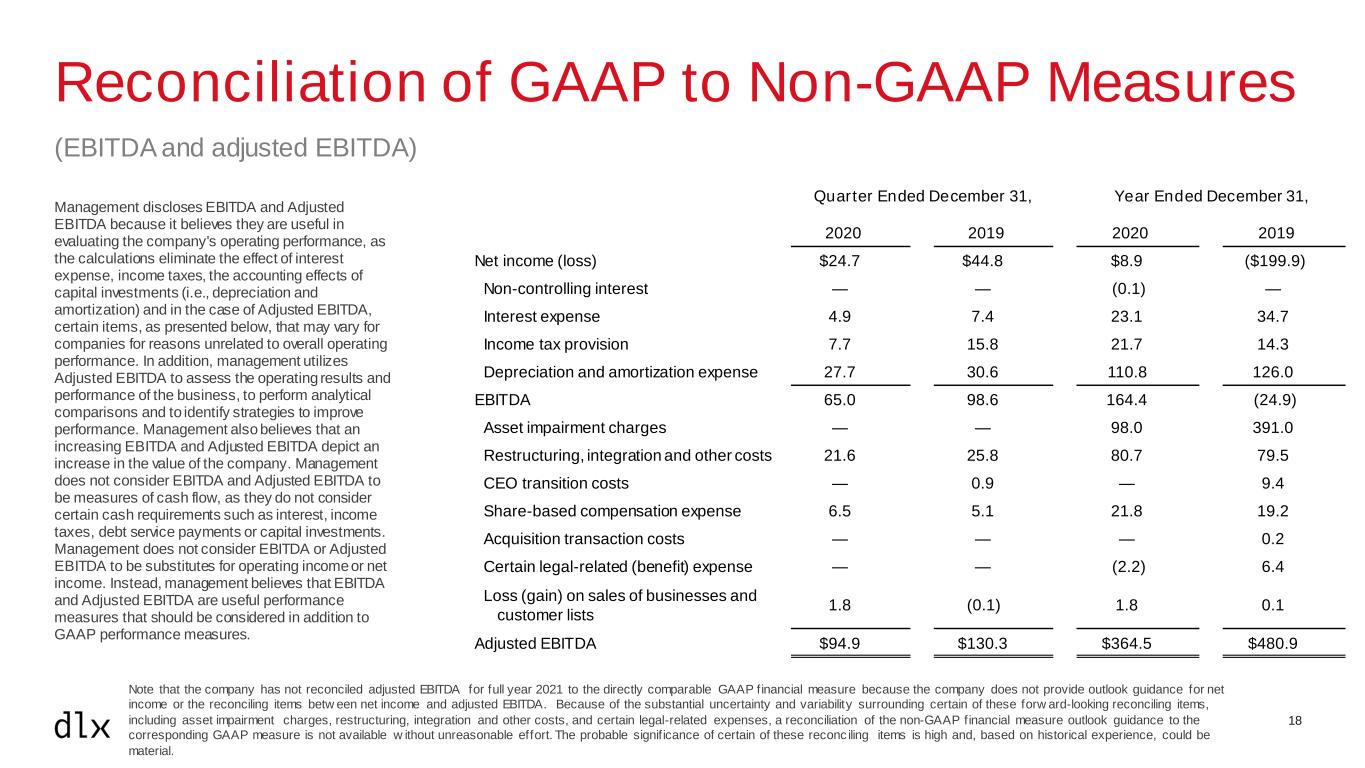
18 Reconciliation of GAAP to Non-GAAP Measures (EBITDA and adjusted EBITDA) Management discloses EBITDA and Adjusted EBITDA because it believes they are useful in evaluating the company's operating performance, as the calculations eliminate the effect of interest expense, income taxes, the accounting effects of capital investments (i.e., depreciation and amortization) and in the case of Adjusted EBITDA, certain items, as presented below, that may vary for companies for reasons unrelated to overall operating performance. In addition, management utilizes Adjusted EBITDA to assess the operating results and performance of the business, to perform analytical comparisons and to identify strategies to improve performance. Management also believes that an increasing EBITDA and Adjusted EBITDA depict an increase in the value of the company. Management does not consider EBITDA and Adjusted EBITDA to be measures of cash flow, as they do not consider certain cash requirements such as interest, income taxes, debt service payments or capital investments. Management does not consider EBITDA or Adjusted EBITDA to be substitutes for operating income or net income. Instead, management believes that EBITDA and Adjusted EBITDA are useful performance measures that should be considered in addition to GAAP performance measures. Quarter Ended December 31, Year Ended December 31, 2020 2019 2020 2019 Net income (loss) $24.7 $44.8 $8.9 ($199.9) Non-controlling interest — — (0.1) — Interest expense 4.9 7.4 23.1 34.7 Income tax provision 7.7 15.8 21.7 14.3 Depreciation and amortization expense 27.7 30.6 110.8 126.0 EBITDA 65.0 98.6 164.4 (24.9) Asset impairment charges — — 98.0 391.0 Restructuring, integration and other costs 21.6 25.8 80.7 79.5 CEO transition costs — 0.9 — 9.4 Share-based compensation expense 6.5 5.1 21.8 19.2 Acquisition transaction costs — — — 0.2 Certain legal-related (benefit) expense — — (2.2) 6.4 Loss (gain) on sales of businesses and customer lists 1.8 (0.1) 1.8 0.1 Adjusted EBITDA $94.9 $130.3 $364.5 $480.9 Note that the company has not reconciled adjusted EBITDA for full year 2021 to the directly comparable GAAP financial measure because the company does not provide outlook guidance for net income or the reconciling items betw een net income and adjusted EBITDA. Because of the substantial uncertainty and variability surrounding certain of these forw ard-looking reconciling items, including asset impairment charges, restructuring, integration and other costs, and certain legal-related expenses, a reconciliation of the non-GAAP financial measure outlook guidance to the corresponding GAAP measure is not available w ithout unreasonable effort. The probable signif icance of certain of these reconc iling items is high and, based on historical experience, could be material.
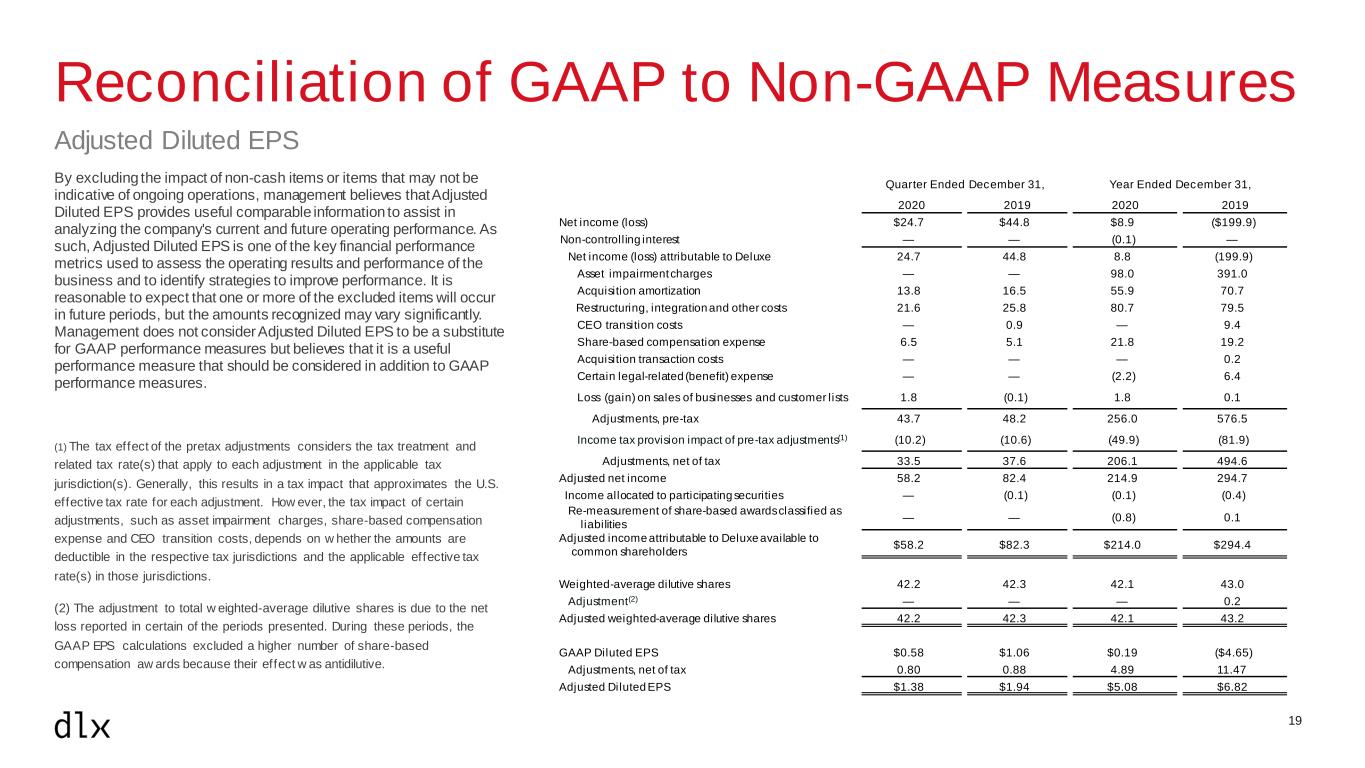
19 Reconciliation of GAAP to Non-GAAP Measures Adjusted Diluted EPS By excluding the impact of non-cash items or items that may not be indicative of ongoing operations, management believes that Adjusted Diluted EPS provides useful comparable information to assist in analyzing the company's current and future operating performance. As such, Adjusted Diluted EPS is one of the key financial performance metrics used to assess the operating results and performance of the business and to identify strategies to improve performance. It is reasonable to expect that one or more of the excluded items will occur in future periods, but the amounts recognized may vary significantly. Management does not consider Adjusted Diluted EPS to be a substitute for GAAP performance measures but believes that it is a useful performance measure that should be considered in addition to GAAP performance measures. (1) The tax effect of the pretax adjustments considers the tax treatment and related tax rate(s) that apply to each adjustment in the applicable tax jurisdiction(s). Generally, this results in a tax impact that approximates the U.S. effective tax rate for each adjustment. How ever, the tax impact of certain adjustments, such as asset impairment charges, share-based compensation expense and CEO transition costs, depends on w hether the amounts are deductible in the respective tax jurisdictions and the applicable effective tax rate(s) in those jurisdictions. (2) The adjustment to total w eighted-average dilutive shares is due to the net loss reported in certain of the periods presented. During these periods, the GAAP EPS calculations excluded a higher number of share-based compensation aw ards because their effect w as antidilutive. Quarter Ended December 31, Year Ended December 31, 2020 2019 2020 2019 Net income (loss) $24.7 $44.8 $8.9 ($199.9) Non-controll ing interest — — (0.1) — Net income (loss) attributable to Deluxe 24.7 44.8 8.8 (199.9) Asset impairment charges — — 98.0 391.0 Acquisition amortization 13.8 16.5 55.9 70.7 Restructuring, integration and other costs 21.6 25.8 80.7 79.5 CEO transition costs — 0.9 — 9.4 Share-based compensation expense 6.5 5.1 21.8 19.2 Acquisition transaction costs — — — 0.2 Certain legal-related (benefit) expense — — (2.2) 6.4 Loss (gain) on sales of businesses and customer lists 1.8 (0.1) 1.8 0.1 Adjustments, pre-tax 43.7 48.2 256.0 576.5 Income tax provision impact of pre-tax adjustments(1) (10.2) (10.6) (49.9) (81.9) Adjustments, net of tax 33.5 37.6 206.1 494.6 Adjusted net income 58.2 82.4 214.9 294.7 Income allocated to participating securities — (0.1) (0.1) (0.4) Re-measurement of share-based awards classified as l iabilities — — (0.8) 0.1 Adjusted income attributable to Deluxe available to common shareholders $58.2 $82.3 $214.0 $294.4 Weighted-average dilutive shares 42.2 42.3 42.1 43.0 Adjustment(2) — — — 0.2 Adjusted weighted-average dilutive shares 42.2 42.3 42.1 43.2 GAAP Diluted EPS $0.58 $1.06 $0.19 ($4.65) Adjustments, net of tax 0.80 0.88 4.89 11.47 Adjusted Diluted EPS $1.38 $1.94 $5.08 $6.82
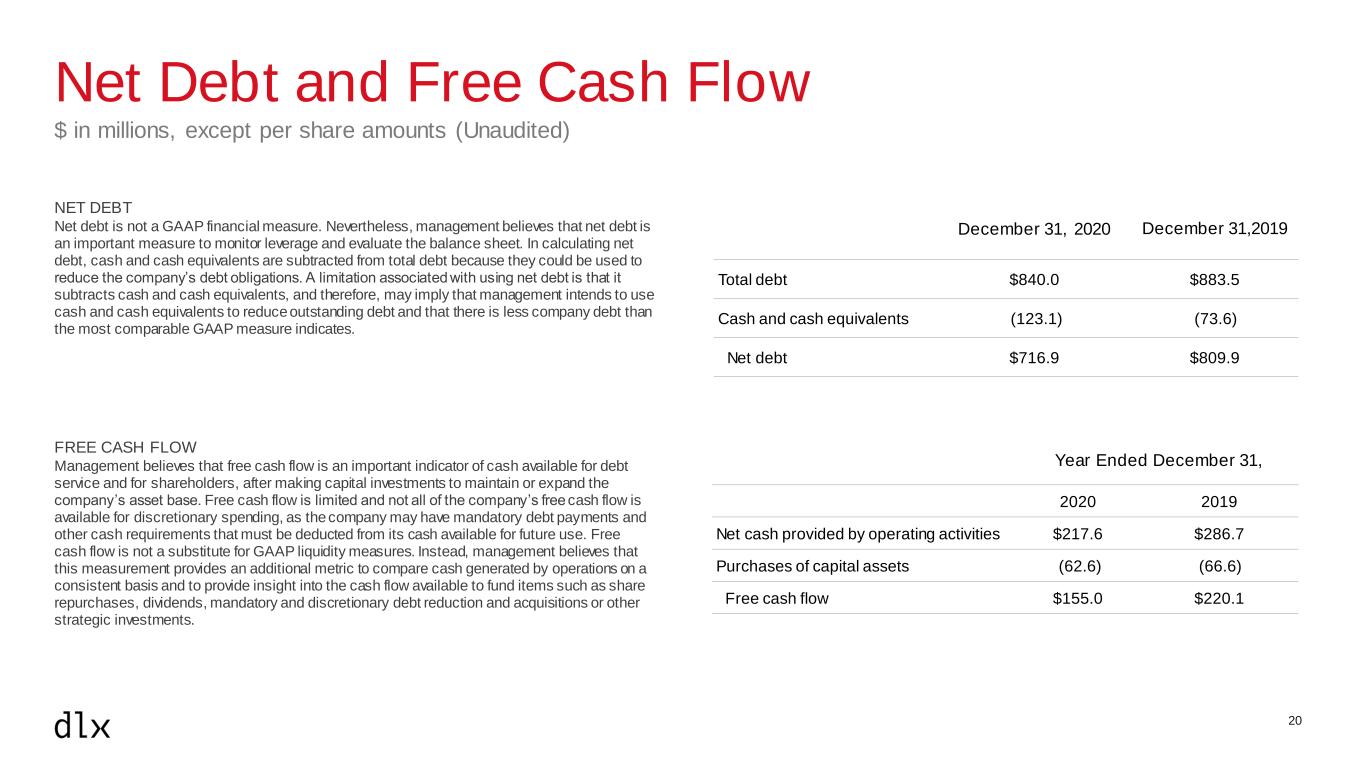
20 Net Debt and Free Cash Flow $ in millions, except per share amounts (Unaudited) December 31, 2020 December 31,2019 Total debt $840.0 $883.5 Cash and cash equivalents (123.1) (73.6) Net debt $716.9 $809.9 NET DEBT Net debt is not a GAAP financial measure. Nevertheless, management believes that net debt is an important measure to monitor leverage and evaluate the balance sheet. In calculating net debt, cash and cash equivalents are subtracted from total debt because they could be used to reduce the company’s debt obligations. A limitation associated with using net debt is that it subtracts cash and cash equivalents, and therefore, may imply that management intends to use cash and cash equivalents to reduce outstanding debt and that there is less company debt than the most comparable GAAP measure indicates. Year Ended December 31, 2020 2019 Net cash provided by operating activities $217.6 $286.7 Purchases of capital assets (62.6) (66.6) Free cash flow $155.0 $220.1 FREE CASH FLOW Management believes that free cash flow is an important indicator of cash available for debt service and for shareholders, after making capital investments to maintain or expand the company’s asset base. Free cash flow is limited and not all of the company’s free cash flow is available for discretionary spending, as the company may have mandatory debt payments and other cash requirements that must be deducted from its cash available for future use. Free cash flow is not a substitute for GAAP liquidity measures. Instead, management believes that this measurement provides an additional metric to compare cash generated by operations on a consistent basis and to provide insight into the cash flow available to fund items such as share repurchases, dividends, mandatory and discretionary debt reduction and acquisitions or other strategic investments.