EX-99.1
Published on March 23, 2022
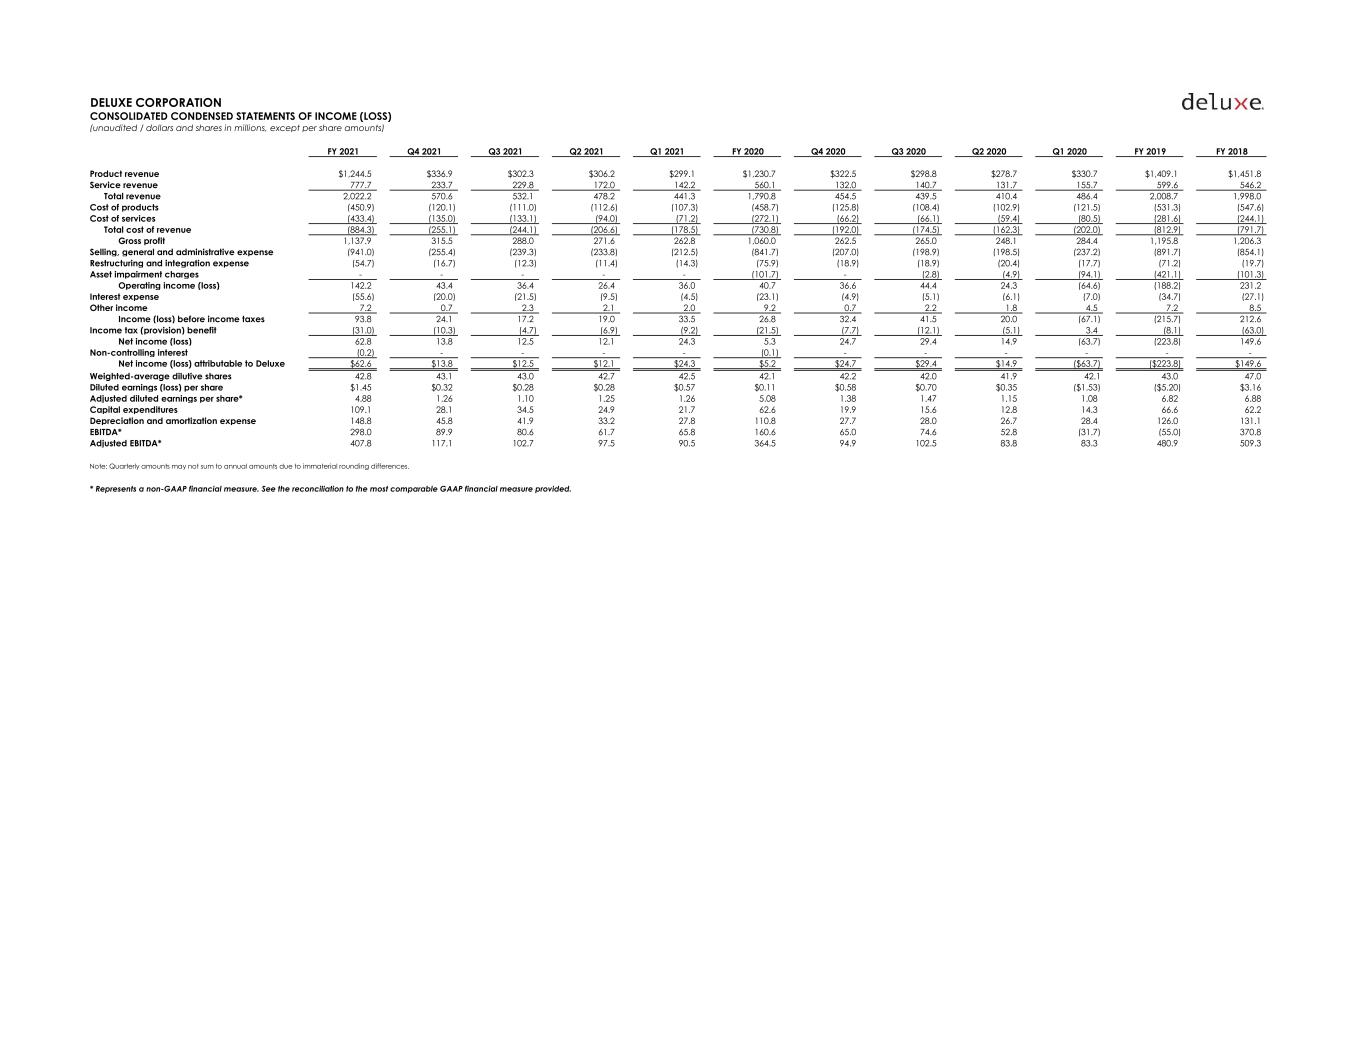
DELUXE CORPORATION CONSOLIDATED CONDENSED STATEMENTS OF INCOME (LOSS) (unaudited / dollars and shares in millions, except per share amounts) FY 2021 Q4 2021 Q3 2021 Q2 2021 Q1 2021 FY 2020 Q4 2020 Q3 2020 Q2 2020 Q1 2020 FY 2019 FY 2018 Product revenue $1,244.5 $336.9 $302.3 $306.2 $299.1 $1,230.7 $322.5 $298.8 $278.7 $330.7 $1,409.1 $1,451.8 Service revenue 777.7 233.7 229.8 172.0 142.2 560.1 132.0 140.7 131.7 155.7 599.6 546.2 Total revenue 2,022.2 570.6 532.1 478.2 441.3 1,790.8 454.5 439.5 410.4 486.4 2,008.7 1,998.0 Cost of products (450.9) (120.1) (111.0) (112.6) (107.3) (458.7) (125.8) (108.4) (102.9) (121.5) (531.3) (547.6) Cost of services (433.4) (135.0) (133.1) (94.0) (71.2) (272.1) (66.2) (66.1) (59.4) (80.5) (281.6) (244.1) Total cost of revenue (884.3) (255.1) (244.1) (206.6) (178.5) (730.8) (192.0) (174.5) (162.3) (202.0) (812.9) (791.7) Gross profit 1,137.9 315.5 288.0 271.6 262.8 1,060.0 262.5 265.0 248.1 284.4 1,195.8 1,206.3 Selling, general and administrative expense (941.0) (255.4) (239.3) (233.8) (212.5) (841.7) (207.0) (198.9) (198.5) (237.2) (891.7) (854.1) Restructuring and integration expense (54.7) (16.7) (12.3) (11.4) (14.3) (75.9) (18.9) (18.9) (20.4) (17.7) (71.2) (19.7) Asset impairment charges - - - - - (101.7) - (2.8) (4.9) (94.1) (421.1) (101.3) Operating income (loss) 142.2 43.4 36.4 26.4 36.0 40.7 36.6 44.4 24.3 (64.6) (188.2) 231.2 Interest expense (55.6) (20.0) (21.5) (9.5) (4.5) (23.1) (4.9) (5.1) (6.1) (7.0) (34.7) (27.1) Other income 7.2 0.7 2.3 2.1 2.0 9.2 0.7 2.2 1.8 4.5 7.2 8.5 Income (loss) before income taxes 93.8 24.1 17.2 19.0 33.5 26.8 32.4 41.5 20.0 (67.1) (215.7) 212.6 Income tax (provision) benefit (31.0) (10.3) (4.7) (6.9) (9.2) (21.5) (7.7) (12.1) (5.1) 3.4 (8.1) (63.0) Net income (loss) 62.8 13.8 12.5 12.1 24.3 5.3 24.7 29.4 14.9 (63.7) (223.8) 149.6 Non-controlling interest (0.2) - - - - (0.1) - - - - - - Net income (loss) attributable to Deluxe $62.6 $13.8 $12.5 $12.1 $24.3 $5.2 $24.7 $29.4 $14.9 ($63.7) ($223.8) $149.6 Weighted-average dilutive shares 42.8 43.1 43.0 42.7 42.5 42.1 42.2 42.0 41.9 42.1 43.0 47.0 Diluted earnings (loss) per share $1.45 $0.32 $0.28 $0.28 $0.57 $0.11 $0.58 $0.70 $0.35 ($1.53) ($5.20) $3.16 Adjusted diluted earnings per share* 4.88 1.26 1.10 1.25 1.26 5.08 1.38 1.47 1.15 1.08 6.82 6.88 Capital expenditures 109.1 28.1 34.5 24.9 21.7 62.6 19.9 15.6 12.8 14.3 66.6 62.2 Depreciation and amortization expense 148.8 45.8 41.9 33.2 27.8 110.8 27.7 28.0 26.7 28.4 126.0 131.1 EBITDA* 298.0 89.9 80.6 61.7 65.8 160.6 65.0 74.6 52.8 (31.7) (55.0) 370.8 Adjusted EBITDA* 407.8 117.1 102.7 97.5 90.5 364.5 94.9 102.5 83.8 83.3 480.9 509.3 Note: Quarterly amounts may not sum to annual amounts due to immaterial rounding differences. * Represents a non-GAAP financial measure. See the reconciliation to the most comparable GAAP financial measure provided.
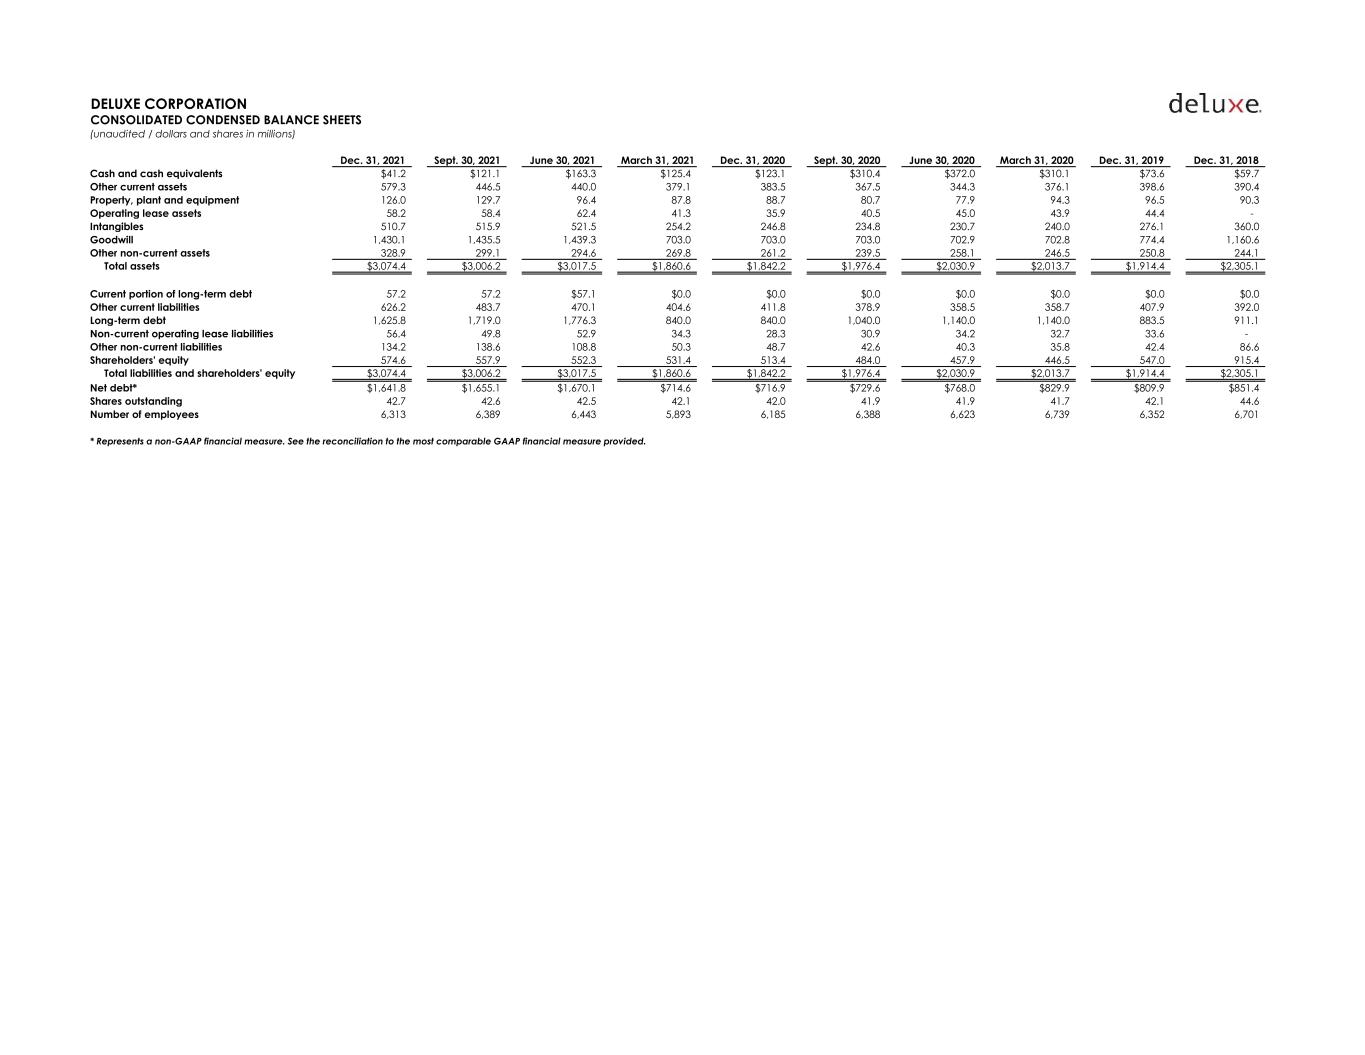
DELUXE CORPORATION CONSOLIDATED CONDENSED BALANCE SHEETS (unaudited / dollars and shares in millions) Dec. 31, 2021 Sept. 30, 2021 June 30, 2021 March 31, 2021 Dec. 31, 2020 Sept. 30, 2020 June 30, 2020 March 31, 2020 Dec. 31, 2019 Dec. 31, 2018 Cash and cash equivalents $41.2 $121.1 $163.3 $125.4 $123.1 $310.4 $372.0 $310.1 $73.6 $59.7 Other current assets 579.3 446.5 440.0 379.1 383.5 367.5 344.3 376.1 398.6 390.4 Property, plant and equipment 126.0 129.7 96.4 87.8 88.7 80.7 77.9 94.3 96.5 90.3 Operating lease assets 58.2 58.4 62.4 41.3 35.9 40.5 45.0 43.9 44.4 - Intangibles 510.7 515.9 521.5 254.2 246.8 234.8 230.7 240.0 276.1 360.0 Goodwill 1,430.1 1,435.5 1,439.3 703.0 703.0 703.0 702.9 702.8 774.4 1,160.6 Other non-current assets 328.9 299.1 294.6 269.8 261.2 239.5 258.1 246.5 250.8 244.1 Total assets $3,074.4 $3,006.2 $3,017.5 $1,860.6 $1,842.2 $1,976.4 $2,030.9 $2,013.7 $1,914.4 $2,305.1 Current portion of long-term debt 57.2 57.2 $57.1 $0.0 $0.0 $0.0 $0.0 $0.0 $0.0 $0.0 Other current liabilities 626.2 483.7 470.1 404.6 411.8 378.9 358.5 358.7 407.9 392.0 Long-term debt 1,625.8 1,719.0 1,776.3 840.0 840.0 1,040.0 1,140.0 1,140.0 883.5 911.1 Non-current operating lease liabilities 56.4 49.8 52.9 34.3 28.3 30.9 34.2 32.7 33.6 - Other non-current liabilities 134.2 138.6 108.8 50.3 48.7 42.6 40.3 35.8 42.4 86.6 Shareholders' equity 574.6 557.9 552.3 531.4 513.4 484.0 457.9 446.5 547.0 915.4 Total liabilities and shareholders' equity $3,074.4 $3,006.2 $3,017.5 $1,860.6 $1,842.2 $1,976.4 $2,030.9 $2,013.7 $1,914.4 $2,305.1 Net debt* $1,641.8 $1,655.1 $1,670.1 $714.6 $716.9 $729.6 $768.0 $829.9 $809.9 $851.4 Shares outstanding 42.7 42.6 42.5 42.1 42.0 41.9 41.9 41.7 42.1 44.6 Number of employees 6,313 6,389 6,443 5,893 6,185 6,388 6,623 6,739 6,352 6,701 * Represents a non-GAAP financial measure. See the reconciliation to the most comparable GAAP financial measure provided.
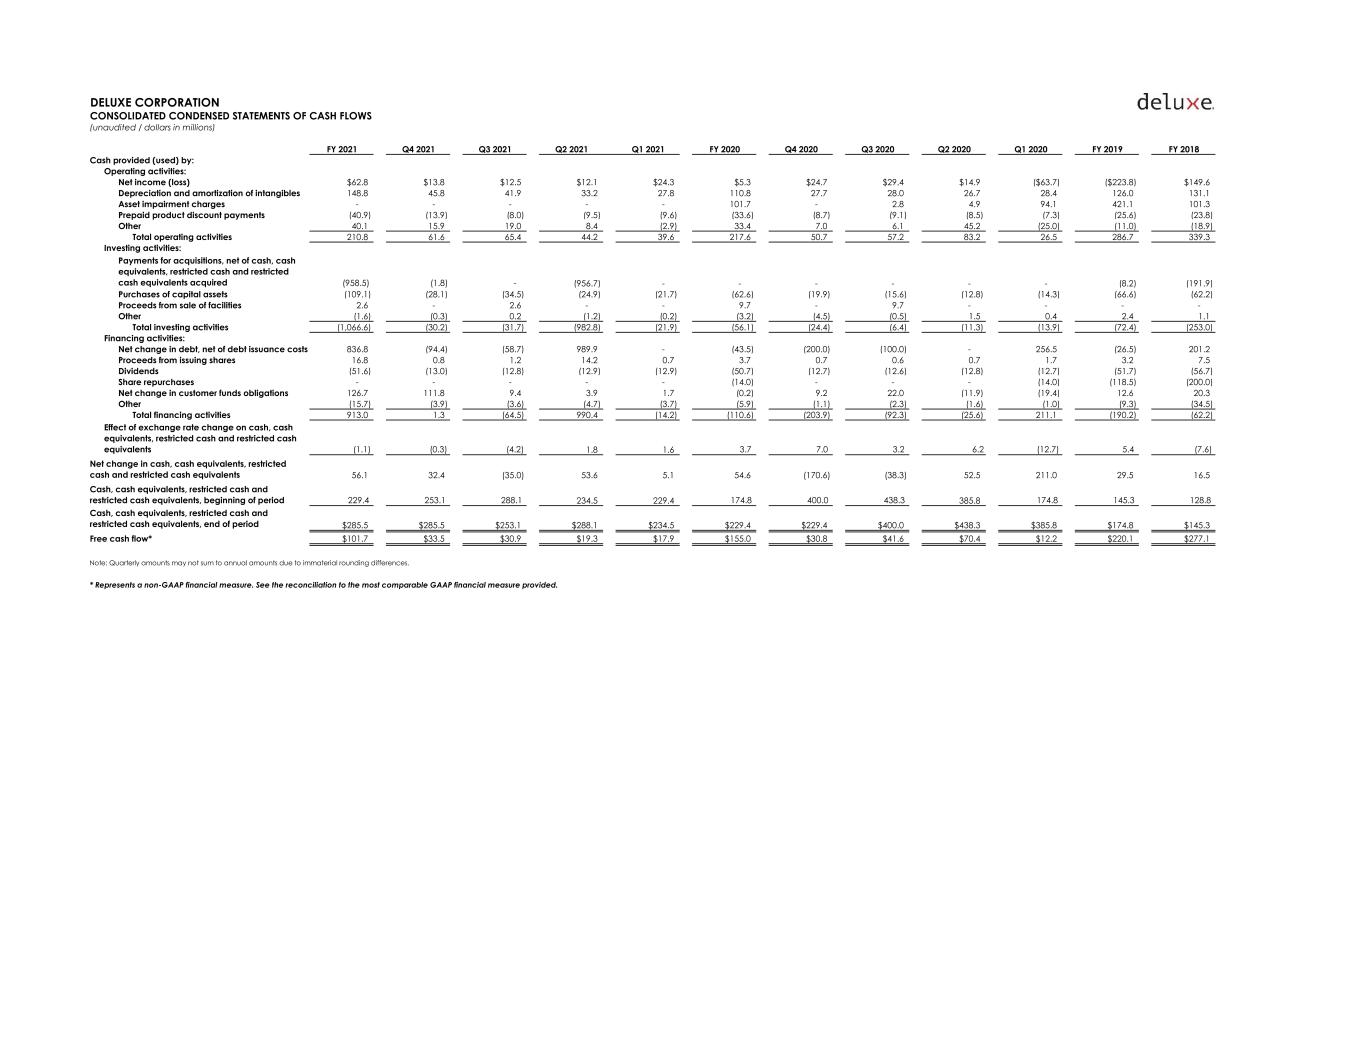
DELUXE CORPORATION CONSOLIDATED CONDENSED STATEMENTS OF CASH FLOWS (unaudited / dollars in millions) FY 2021 Q4 2021 Q3 2021 Q2 2021 Q1 2021 FY 2020 Q4 2020 Q3 2020 Q2 2020 Q1 2020 FY 2019 FY 2018 Cash provided (used) by: Operating activities: Net income (loss) $62.8 $13.8 $12.5 $12.1 $24.3 $5.3 $24.7 $29.4 $14.9 ($63.7) ($223.8) $149.6 Depreciation and amortization of intangibles 148.8 45.8 41.9 33.2 27.8 110.8 27.7 28.0 26.7 28.4 126.0 131.1 Asset impairment charges - - - - - 101.7 - 2.8 4.9 94.1 421.1 101.3 Prepaid product discount payments (40.9) (13.9) (8.0) (9.5) (9.6) (33.6) (8.7) (9.1) (8.5) (7.3) (25.6) (23.8) Other 40.1 15.9 19.0 8.4 (2.9) 33.4 7.0 6.1 45.2 (25.0) (11.0) (18.9) Total operating activities 210.8 61.6 65.4 44.2 39.6 217.6 50.7 57.2 83.2 26.5 286.7 339.3 Investing activities: Payments for acquisitions, net of cash, cash equivalents, restricted cash and restricted cash equivalents acquired (958.5) (1.8) - (956.7) - - - - - - (8.2) (191.9) Purchases of capital assets (109.1) (28.1) (34.5) (24.9) (21.7) (62.6) (19.9) (15.6) (12.8) (14.3) (66.6) (62.2) Proceeds from sale of facilities 2.6 - 2.6 - - 9.7 - 9.7 - - - - Other (1.6) (0.3) 0.2 (1.2) (0.2) (3.2) (4.5) (0.5) 1.5 0.4 2.4 1.1 Total investing activities (1,066.6) (30.2) (31.7) (982.8) (21.9) (56.1) (24.4) (6.4) (11.3) (13.9) (72.4) (253.0) Financing activities: Net change in debt, net of debt issuance costs 836.8 (94.4) (58.7) 989.9 - (43.5) (200.0) (100.0) - 256.5 (26.5) 201.2 Proceeds from issuing shares 16.8 0.8 1.2 14.2 0.7 3.7 0.7 0.6 0.7 1.7 3.2 7.5 Dividends (51.6) (13.0) (12.8) (12.9) (12.9) (50.7) (12.7) (12.6) (12.8) (12.7) (51.7) (56.7) Share repurchases - - - - - (14.0) - - - (14.0) (118.5) (200.0) Net change in customer funds obligations 126.7 111.8 9.4 3.9 1.7 (0.2) 9.2 22.0 (11.9) (19.4) 12.6 20.3 Other (15.7) (3.9) (3.6) (4.7) (3.7) (5.9) (1.1) (2.3) (1.6) (1.0) (9.3) (34.5) Total financing activities 913.0 1.3 (64.5) 990.4 (14.2) (110.6) (203.9) (92.3) (25.6) 211.1 (190.2) (62.2) Effect of exchange rate change on cash, cash equivalents, restricted cash and restricted cash equivalents (1.1) (0.3) (4.2) 1.8 1.6 3.7 7.0 3.2 6.2 (12.7) 5.4 (7.6) Net change in cash, cash equivalents, restricted cash and restricted cash equivalents 56.1 32.4 (35.0) 53.6 5.1 54.6 (170.6) (38.3) 52.5 211.0 29.5 16.5 Cash, cash equivalents, restricted cash and restricted cash equivalents, beginning of period 229.4 253.1 288.1 234.5 229.4 174.8 400.0 438.3 385.8 174.8 145.3 128.8 Cash, cash equivalents, restricted cash and restricted cash equivalents, end of period $285.5 $285.5 $253.1 $288.1 $234.5 $229.4 $229.4 $400.0 $438.3 $385.8 $174.8 $145.3 Free cash flow* $101.7 $33.5 $30.9 $19.3 $17.9 $155.0 $30.8 $41.6 $70.4 $12.2 $220.1 $277.1 Note: Quarterly amounts may not sum to annual amounts due to immaterial rounding differences. * Represents a non-GAAP financial measure. See the reconciliation to the most comparable GAAP financial measure provided.
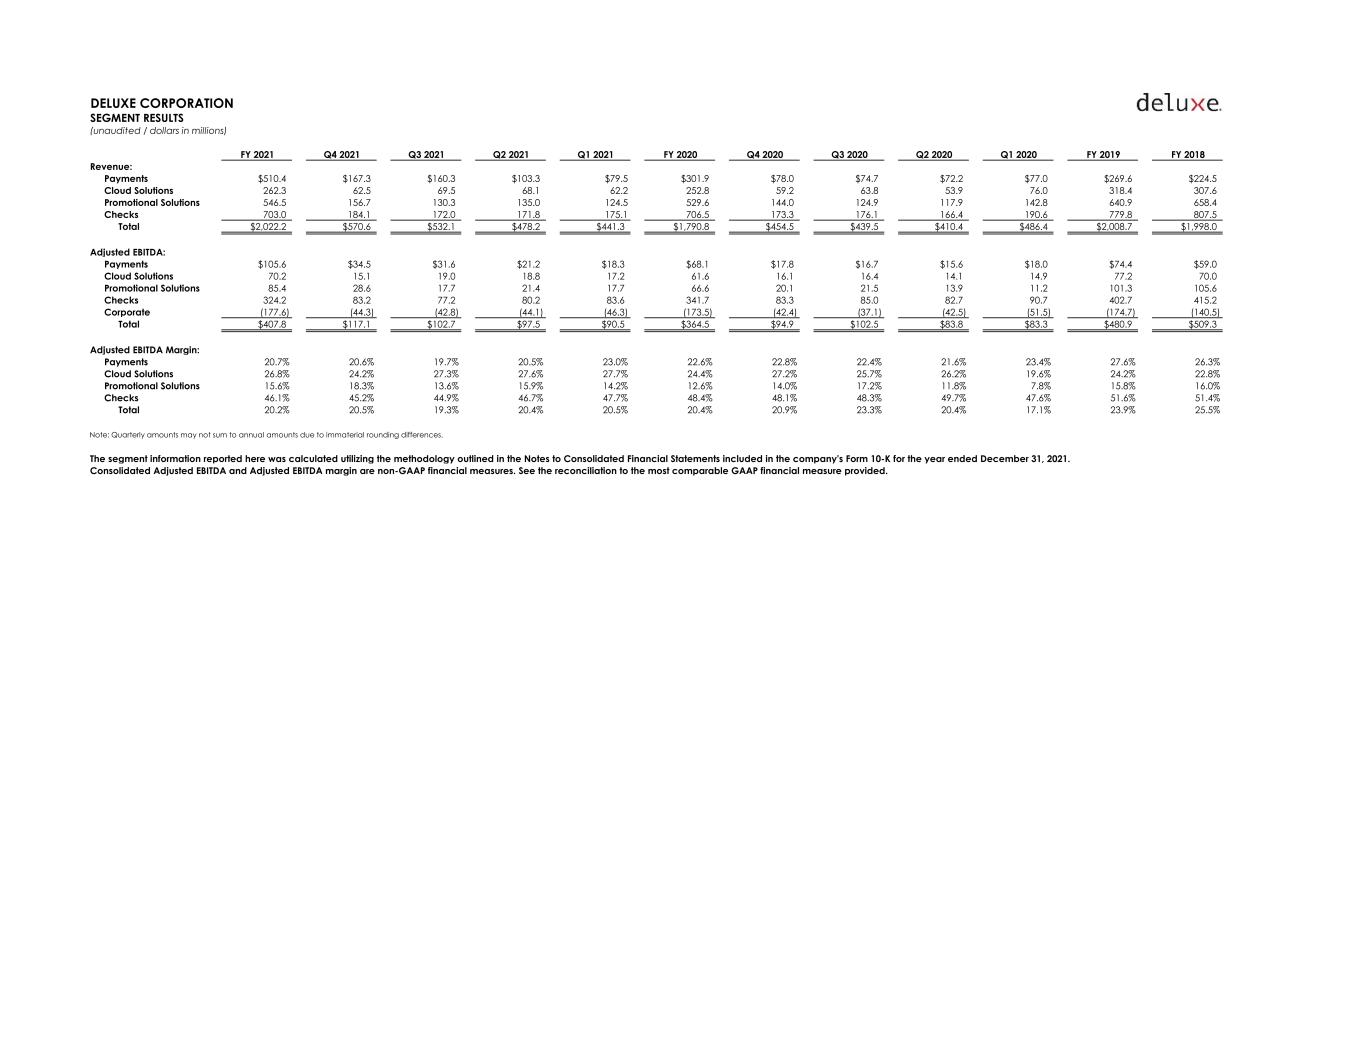
DELUXE CORPORATION SEGMENT RESULTS (unaudited / dollars in millions) FY 2021 Q4 2021 Q3 2021 Q2 2021 Q1 2021 FY 2020 Q4 2020 Q3 2020 Q2 2020 Q1 2020 FY 2019 FY 2018 Revenue: Payments $510.4 $167.3 $160.3 $103.3 $79.5 $301.9 $78.0 $74.7 $72.2 $77.0 $269.6 $224.5 Cloud Solutions 262.3 62.5 69.5 68.1 62.2 252.8 59.2 63.8 53.9 76.0 318.4 307.6 Promotional Solutions 546.5 156.7 130.3 135.0 124.5 529.6 144.0 124.9 117.9 142.8 640.9 658.4 Checks 703.0 184.1 172.0 171.8 175.1 706.5 173.3 176.1 166.4 190.6 779.8 807.5 Total $2,022.2 $570.6 $532.1 $478.2 $441.3 $1,790.8 $454.5 $439.5 $410.4 $486.4 $2,008.7 $1,998.0 Adjusted EBITDA: Payments $105.6 $34.5 $31.6 $21.2 $18.3 $68.1 $17.8 $16.7 $15.6 $18.0 $74.4 $59.0 Cloud Solutions 70.2 15.1 19.0 18.8 17.2 61.6 16.1 16.4 14.1 14.9 77.2 70.0 Promotional Solutions 85.4 28.6 17.7 21.4 17.7 66.6 20.1 21.5 13.9 11.2 101.3 105.6 Checks 324.2 83.2 77.2 80.2 83.6 341.7 83.3 85.0 82.7 90.7 402.7 415.2 Corporate (177.6) (44.3) (42.8) (44.1) (46.3) (173.5) (42.4) (37.1) (42.5) (51.5) (174.7) (140.5) Total $407.8 $117.1 $102.7 $97.5 $90.5 $364.5 $94.9 $102.5 $83.8 $83.3 $480.9 $509.3 Adjusted EBITDA Margin: Payments 20.7% 20.6% 19.7% 20.5% 23.0% 22.6% 22.8% 22.4% 21.6% 23.4% 27.6% 26.3% Cloud Solutions 26.8% 24.2% 27.3% 27.6% 27.7% 24.4% 27.2% 25.7% 26.2% 19.6% 24.2% 22.8% Promotional Solutions 15.6% 18.3% 13.6% 15.9% 14.2% 12.6% 14.0% 17.2% 11.8% 7.8% 15.8% 16.0% Checks 46.1% 45.2% 44.9% 46.7% 47.7% 48.4% 48.1% 48.3% 49.7% 47.6% 51.6% 51.4% Total 20.2% 20.5% 19.3% 20.4% 20.5% 20.4% 20.9% 23.3% 20.4% 17.1% 23.9% 25.5% Note: Quarterly amounts may not sum to annual amounts due to immaterial rounding differences. The segment information reported here was calculated utilizing the methodology outlined in the Notes to Consolidated Financial Statements included in the company's Form 10-K for the year ended December 31, 2021. Consolidated Adjusted EBITDA and Adjusted EBITDA margin are non-GAAP financial measures. See the reconciliation to the most comparable GAAP financial measure provided.
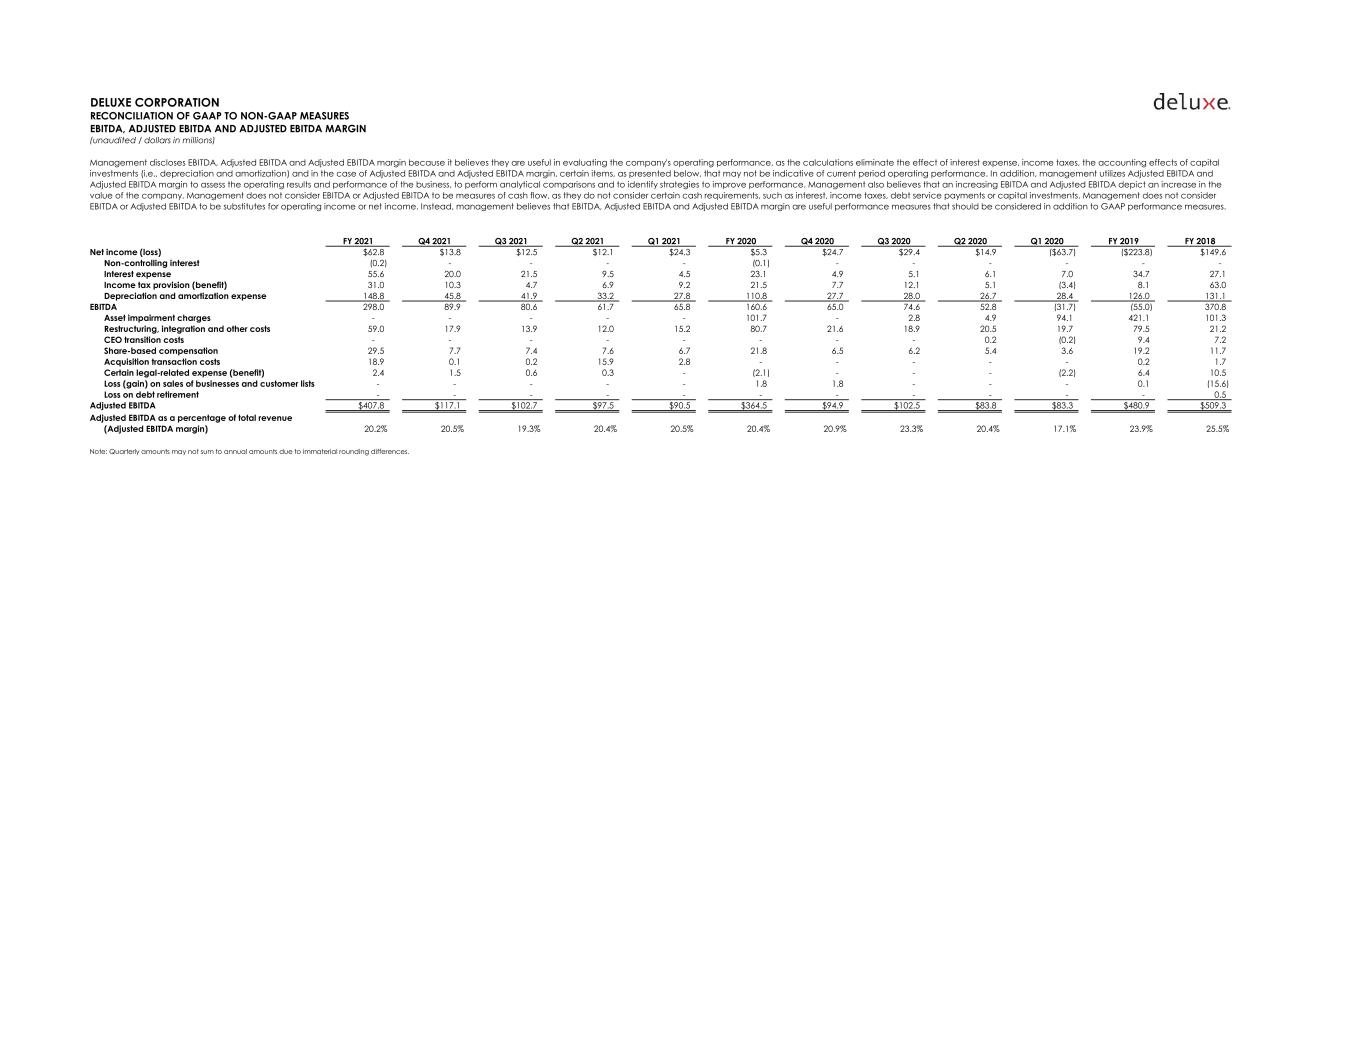
DELUXE CORPORATION RECONCILIATION OF GAAP TO NON-GAAP MEASURES EBITDA, ADJUSTED EBITDA AND ADJUSTED EBITDA MARGIN (unaudited / dollars in millions) FY 2021 Q4 2021 Q3 2021 Q2 2021 Q1 2021 FY 2020 Q4 2020 Q3 2020 Q2 2020 Q1 2020 FY 2019 FY 2018 Net income (loss) $62.8 $13.8 $12.5 $12.1 $24.3 $5.3 $24.7 $29.4 $14.9 ($63.7) ($223.8) $149.6 Non-controlling interest (0.2) - - - - (0.1) - - - - - - Interest expense 55.6 20.0 21.5 9.5 4.5 23.1 4.9 5.1 6.1 7.0 34.7 27.1 Income tax provision (benefit) 31.0 10.3 4.7 6.9 9.2 21.5 7.7 12.1 5.1 (3.4) 8.1 63.0 Depreciation and amortization expense 148.8 45.8 41.9 33.2 27.8 110.8 27.7 28.0 26.7 28.4 126.0 131.1 EBITDA 298.0 89.9 80.6 61.7 65.8 160.6 65.0 74.6 52.8 (31.7) (55.0) 370.8 Asset impairment charges - - - - - 101.7 - 2.8 4.9 94.1 421.1 101.3 Restructuring, integration and other costs 59.0 17.9 13.9 12.0 15.2 80.7 21.6 18.9 20.5 19.7 79.5 21.2 CEO transition costs - - - - - - - - 0.2 (0.2) 9.4 7.2 Share-based compensation 29.5 7.7 7.4 7.6 6.7 21.8 6.5 6.2 5.4 3.6 19.2 11.7 Acquisition transaction costs 18.9 0.1 0.2 15.9 2.8 - - - - - 0.2 1.7 Certain legal-related expense (benefit) 2.4 1.5 0.6 0.3 - (2.1) - - - (2.2) 6.4 10.5 Loss (gain) on sales of businesses and customer lists - - - - - 1.8 1.8 - - - 0.1 (15.6) Loss on debt retirement - - - - - - - - - - - 0.5 Adjusted EBITDA $407.8 $117.1 $102.7 $97.5 $90.5 $364.5 $94.9 $102.5 $83.8 $83.3 $480.9 $509.3 Adjusted EBITDA as a percentage of total revenue (Adjusted EBITDA margin) 20.2% 20.5% 19.3% 20.4% 20.5% 20.4% 20.9% 23.3% 20.4% 17.1% 23.9% 25.5% Note: Quarterly amounts may not sum to annual amounts due to immaterial rounding differences. Management discloses EBITDA, Adjusted EBITDA and Adjusted EBITDA margin because it believes they are useful in evaluating the company's operating performance, as the calculations eliminate the effect of interest expense, income taxes, the accounting effects of capital investments (i.e., depreciation and amortization) and in the case of Adjusted EBITDA and Adjusted EBITDA margin, certain items, as presented below, that may not be indicative of current period operating performance. In addition, management utilizes Adjusted EBITDA and Adjusted EBITDA margin to assess the operating results and performance of the business, to perform analytical comparisons and to identify strategies to improve performance. Management also believes that an increasing EBITDA and Adjusted EBITDA depict an increase in the value of the company. Management does not consider EBITDA or Adjusted EBITDA to be measures of cash flow, as they do not consider certain cash requirements, such as interest, income taxes, debt service payments or capital investments. Management does not consider EBITDA or Adjusted EBITDA to be substitutes for operating income or net income. Instead, management believes that EBITDA, Adjusted EBITDA and Adjusted EBITDA margin are useful performance measures that should be considered in addition to GAAP performance measures.
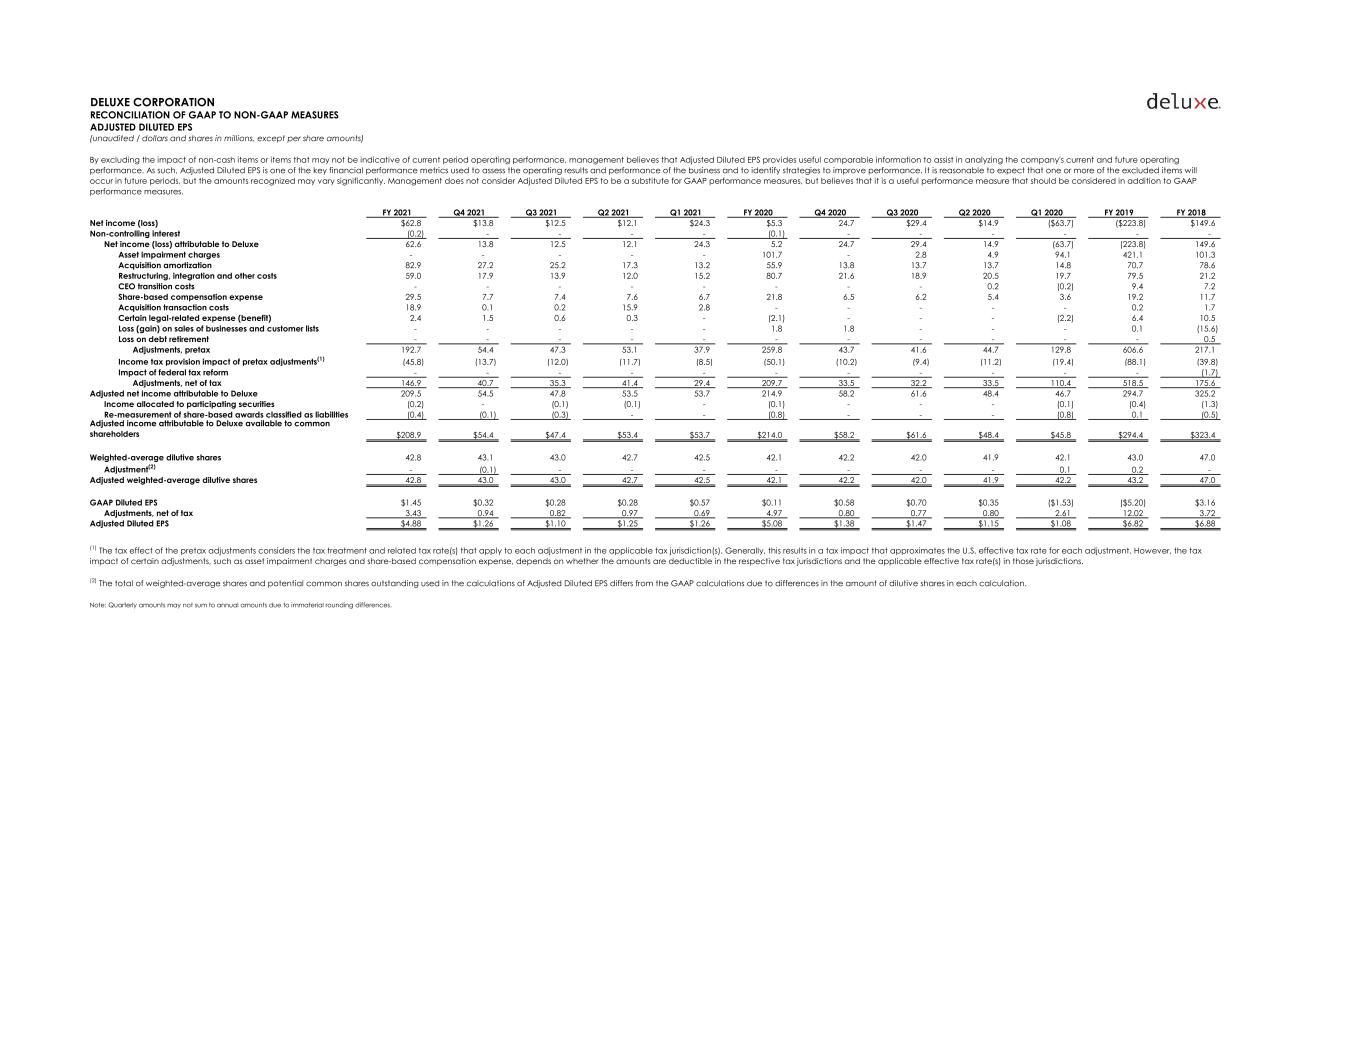
DELUXE CORPORATION RECONCILIATION OF GAAP TO NON-GAAP MEASURES ADJUSTED DILUTED EPS (unaudited / dollars and shares in millions, except per share amounts) FY 2021 Q4 2021 Q3 2021 Q2 2021 Q1 2021 FY 2020 Q4 2020 Q3 2020 Q2 2020 Q1 2020 FY 2019 FY 2018 Net income (loss) $62.8 $13.8 $12.5 $12.1 $24.3 $5.3 24.7 $29.4 $14.9 ($63.7) ($223.8) $149.6 Non-controlling interest (0.2) - - - - (0.1) - - - - - - Net income (loss) attributable to Deluxe 62.6 13.8 12.5 12.1 24.3 5.2 24.7 29.4 14.9 (63.7) (223.8) 149.6 Asset impairment charges - - - - - 101.7 - 2.8 4.9 94.1 421.1 101.3 Acquisition amortization 82.9 27.2 25.2 17.3 13.2 55.9 13.8 13.7 13.7 14.8 70.7 78.6 Restructuring, integration and other costs 59.0 17.9 13.9 12.0 15.2 80.7 21.6 18.9 20.5 19.7 79.5 21.2 CEO transition costs - - - - - - - - 0.2 (0.2) 9.4 7.2 Share-based compensation expense 29.5 7.7 7.4 7.6 6.7 21.8 6.5 6.2 5.4 3.6 19.2 11.7 Acquisition transaction costs 18.9 0.1 0.2 15.9 2.8 - - - - - 0.2 1.7 Certain legal-related expense (benefit) 2.4 1.5 0.6 0.3 - (2.1) - - - (2.2) 6.4 10.5 Loss (gain) on sales of businesses and customer lists - - - - - 1.8 1.8 - - - 0.1 (15.6) Loss on debt retirement - - - - - - - - - - - 0.5 Adjustments, pretax 192.7 54.4 47.3 53.1 37.9 259.8 43.7 41.6 44.7 129.8 606.6 217.1 Income tax provision impact of pretax adjustments (1) (45.8) (13.7) (12.0) (11.7) (8.5) (50.1) (10.2) (9.4) (11.2) (19.4) (88.1) (39.8) Impact of federal tax reform - - - - - - - - - - - (1.7) Adjustments, net of tax 146.9 40.7 35.3 41.4 29.4 209.7 33.5 32.2 33.5 110.4 518.5 175.6 Adjusted net income attributable to Deluxe 209.5 54.5 47.8 53.5 53.7 214.9 58.2 61.6 48.4 46.7 294.7 325.2 Income allocated to participating securities (0.2) - (0.1) (0.1) - (0.1) - - - (0.1) (0.4) (1.3) Re-measurement of share-based awards classified as liabilities (0.4) (0.1) (0.3) - - (0.8) - - - (0.8) 0.1 (0.5) Adjusted income attributable to Deluxe available to common shareholders $208.9 $54.4 $47.4 $53.4 $53.7 $214.0 $58.2 $61.6 $48.4 $45.8 $294.4 $323.4 Weighted-average dilutive shares 42.8 43.1 43.0 42.7 42.5 42.1 42.2 42.0 41.9 42.1 43.0 47.0 Adjustment (2) - (0.1) - - - - - - - 0.1 0.2 - Adjusted weighted-average dilutive shares 42.8 43.0 43.0 42.7 42.5 42.1 42.2 42.0 41.9 42.2 43.2 47.0 GAAP Diluted EPS $1.45 $0.32 $0.28 $0.28 $0.57 $0.11 $0.58 $0.70 $0.35 ($1.53) ($5.20) $3.16 Adjustments, net of tax 3.43 0.94 0.82 0.97 0.69 4.97 0.80 0.77 0.80 2.61 12.02 3.72 Adjusted Diluted EPS $4.88 $1.26 $1.10 $1.25 $1.26 $5.08 $1.38 $1.47 $1.15 $1.08 $6.82 $6.88 Note: Quarterly amounts may not sum to annual amounts due to immaterial rounding differences. By excluding the impact of non-cash items or items that may not be indicative of current period operating performance, management believes that Adjusted Diluted EPS provides useful comparable information to assist in analyzing the company's current and future operating performance. As such, Adjusted Diluted EPS is one of the key financial performance metrics used to assess the operating results and performance of the business and to identify strategies to improve performance. It is reasonable to expect that one or more of the excluded items will occur in future periods, but the amounts recognized may vary significantly. Management does not consider Adjusted Diluted EPS to be a substitute for GAAP performance measures, but believes that it is a useful performance measure that should be considered in addition to GAAP performance measures. (1) The tax effect of the pretax adjustments considers the tax treatment and related tax rate(s) that apply to each adjustment in the applicable tax jurisdiction(s). Generally, this results in a tax impact that approximates the U.S. effective tax rate for each adjustment. However, the tax impact of certain adjustments, such as asset impairment charges and share-based compensation expense, depends on whether the amounts are deductible in the respective tax jurisdictions and the applicable effective tax rate(s) in those jurisdictions. (2) The total of weighted-average shares and potential common shares outstanding used in the calculations of Adjusted Diluted EPS differs from the GAAP calculations due to differences in the amount of dilutive shares in each calculation.
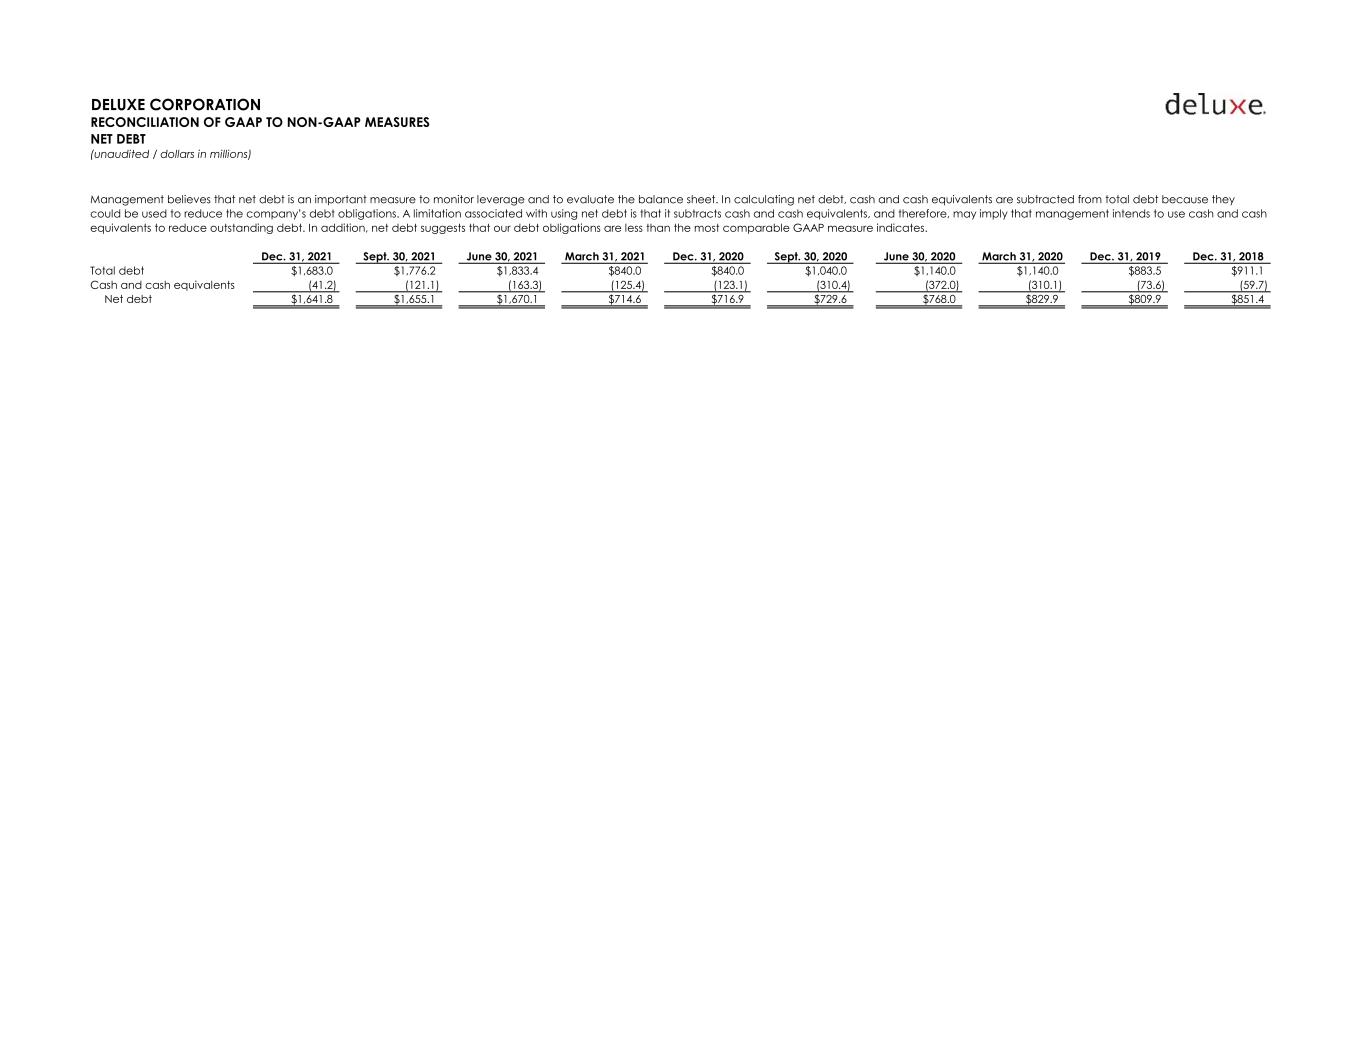
DELUXE CORPORATION RECONCILIATION OF GAAP TO NON-GAAP MEASURES NET DEBT (unaudited / dollars in millions) Dec. 31, 2021 Sept. 30, 2021 June 30, 2021 March 31, 2021 Dec. 31, 2020 Sept. 30, 2020 June 30, 2020 March 31, 2020 Dec. 31, 2019 Dec. 31, 2018 Total debt $1,683.0 $1,776.2 $1,833.4 $840.0 $840.0 $1,040.0 $1,140.0 $1,140.0 $883.5 $911.1 Cash and cash equivalents (41.2) (121.1) (163.3) (125.4) (123.1) (310.4) (372.0) (310.1) (73.6) (59.7) Net debt $1,641.8 $1,655.1 $1,670.1 $714.6 $716.9 $729.6 $768.0 $829.9 $809.9 $851.4 Management believes that net debt is an important measure to monitor leverage and to evaluate the balance sheet. In calculating net debt, cash and cash equivalents are subtracted from total debt because they could be used to reduce the company’s debt obligations. A limitation associated with using net debt is that it subtracts cash and cash equivalents, and therefore, may imply that management intends to use cash and cash equivalents to reduce outstanding debt. In addition, net debt suggests that our debt obligations are less than the most comparable GAAP measure indicates.
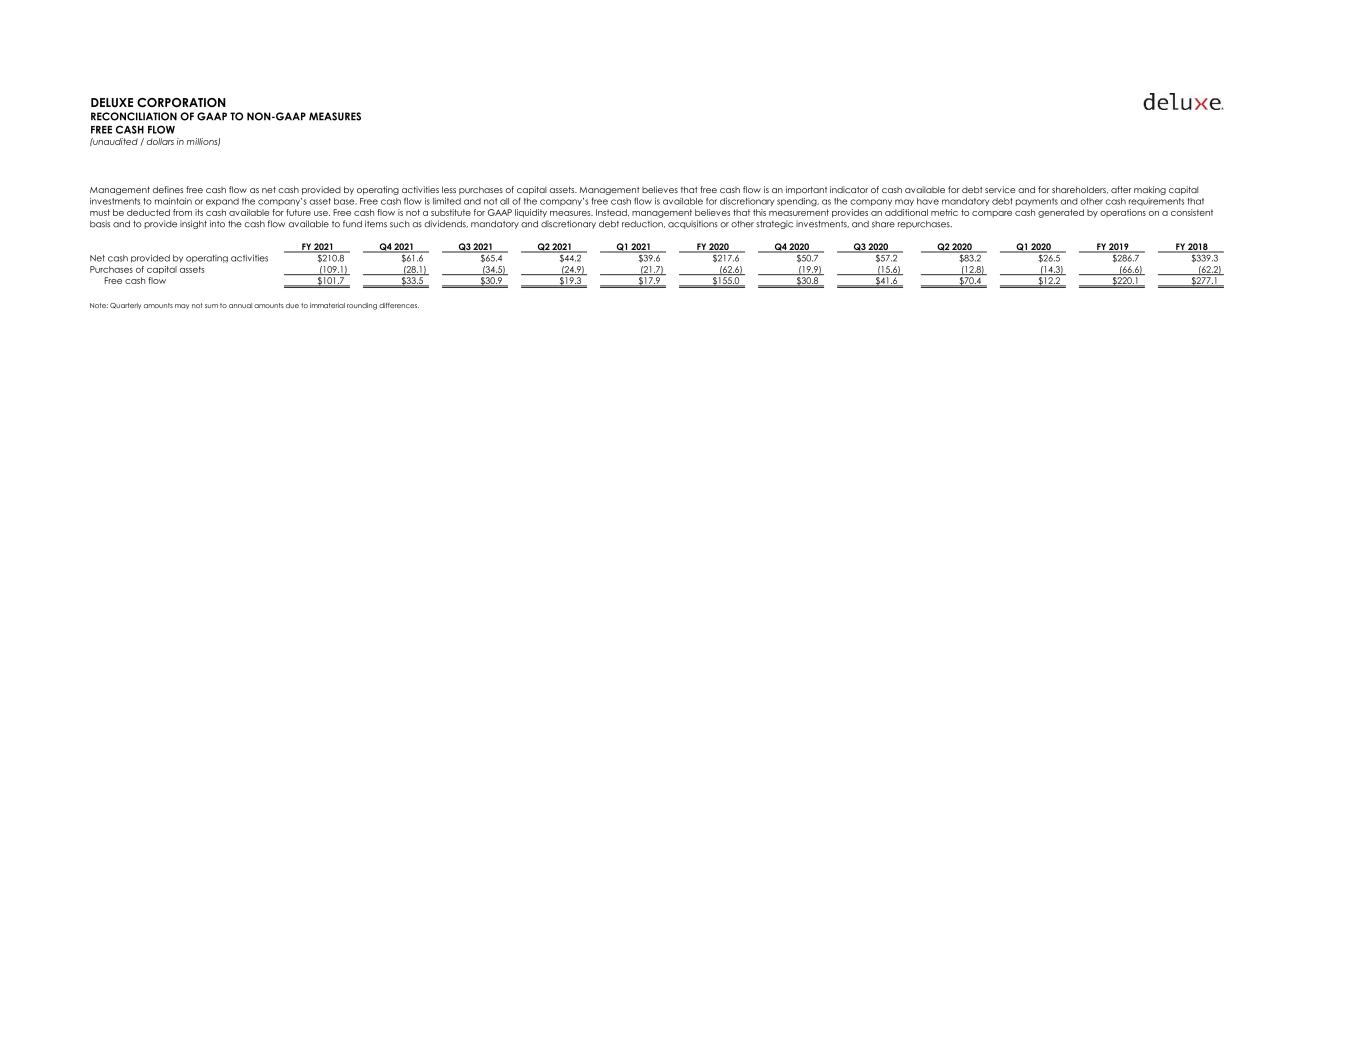
DELUXE CORPORATION RECONCILIATION OF GAAP TO NON-GAAP MEASURES FREE CASH FLOW (unaudited / dollars in millions) FY 2021 Q4 2021 Q3 2021 Q2 2021 Q1 2021 FY 2020 Q4 2020 Q3 2020 Q2 2020 Q1 2020 FY 2019 FY 2018 Net cash provided by operating activities $210.8 $61.6 $65.4 $44.2 $39.6 $217.6 $50.7 $57.2 $83.2 $26.5 $286.7 $339.3 Purchases of capital assets (109.1) (28.1) (34.5) (24.9) (21.7) (62.6) (19.9) (15.6) (12.8) (14.3) (66.6) (62.2) Free cash flow $101.7 $33.5 $30.9 $19.3 $17.9 $155.0 $30.8 $41.6 $70.4 $12.2 $220.1 $277.1 Note: Quarterly amounts may not sum to annual amounts due to immaterial rounding differences. Management defines free cash flow as net cash provided by operating activities less purchases of capital assets. Management believes that free cash flow is an important indicator of cash available for debt service and for shareholders, after making capital investments to maintain or expand the company’s asset base. Free cash flow is limited and not all of the company’s free cash flow is available for discretionary spending, as the company may have mandatory debt payments and other cash requirements that must be deducted from its cash available for future use. Free cash flow is not a substitute for GAAP liquidity measures. Instead, management believes that this measurement provides an additional metric to compare cash generated by operations on a consistent basis and to provide insight into the cash flow available to fund items such as dividends, mandatory and discretionary debt reduction, acquisitions or other strategic investments, and share repurchases.