10-K: Annual report pursuant to Section 13 and 15(d)
Published on February 24, 2023
UNITED STATES
SECURITIES AND EXCHANGE COMMISSION
Washington, D.C. 20549
FORM 10-K
| Annual Report Pursuant to Section 13 or 15(d) of the Securities Exchange Act of 1934 for the fiscal year ended | |||||
Commission file number: 1-7945

(Exact name of registrant as specified in its charter)
(State or other jurisdiction of incorporation or organization) |
(I.R.S. Employer Identification No.) |
||||||||||
(Address of principal executive offices) |
(Zip Code) |
||||||||||
Registrant’s telephone number, including area code: (651 ) 483-7111
Securities registered pursuant to Section 12(b) of the Act:
| Title of each class | Trading symbol(s) | Name of each exchange on which registered | ||||||
Securities registered pursuant to Section 12(g) of the Act: None
Indicate by check mark if the registrant is a well-known seasoned issuer, as defined in Rule 405 of the Securities Act. ☑ Yes ☐ No
Indicate by check mark if the registrant is not required to file reports pursuant to Section 13 or Section 15(d) of the Act. ☐ Yes ☑ No
Indicate by check mark whether the registrant (1) has filed all reports required to be filed by Section 13 or 15(d) of the Securities Exchange Act of 1934 during the preceding 12 months (or for such shorter period that the registrant was required to file such reports), and (2) has been subject to such filing requirements for the past 90 days. ☑ Yes ☐ No
Indicate by check mark whether the registrant has submitted electronically every Interactive Data File required to be submitted pursuant to Rule 405 of Regulation S-T (§232.405 of this chapter) during the preceding 12 months (or for such shorter period that the registrant was required to submit such files). ☑ Yes ☐ No
Indicate by check mark whether the registrant is a large accelerated filer, an accelerated filer, a non-accelerated filer, a smaller reporting company, or an emerging growth company. See the definitions of “large accelerated filer,” “accelerated filer,” “smaller reporting company,” and "emerging growth company" in Rule 12b-2 of the Exchange Act.
| Accelerated Filer | ☐ | ||||||||||
| Non-accelerated Filer | ☐ | Smaller Reporting Company | |||||||||
| Emerging Growth Company | |||||||||||
If an emerging growth company, indicate by check mark if the registrant has elected not to use the extended transition period for complying with any new or revised financial accounting standards provided pursuant to Section 13(a) of the Exchange Act. ☐
If securities are registered pursuant to Section 12(b) of the Act, indicate by check mark whether the financial statements of the registrant included in the filing reflect the correction of an error to previously issued financial statements. ☐
Indicate by check mark whether any of those error corrections are restatements that required a recovery analysis of incentive-based compensation received by any of the registrant's executive officers during the relevant recovery period pursuant to §240.10D-1(b). ☐
Indicate by check mark whether the registrant has filed a report on and attestation to its management’s assessment of the effectiveness of its internal control over financial reporting under Section 404(b) of the Sarbanes-Oxley Act (15 U.S.C. 7262(b)) by the registered public accounting firm that prepared or issued its audit report. ☑
Indicate by check mark whether the registrant is a shell company (as defined in Rule 12b-2 of the Act). ☐ Yes ☑ No
The aggregate market value of the voting stock held by non-affiliates of the registrant is $924,918,940 based on the last sales price of the registrant's common stock on the New York Stock Exchange on June 30, 2022. The number of outstanding shares of the registrant's common stock as of February 8, 2023 was 43,266,924 .
Documents Incorporated by Reference: Portions of our definitive proxy statement to be filed within 120 days after our fiscal year-end are incorporated by reference in Part III.
DELUXE CORPORATION
FORM 10-K
FOR THE YEAR ENDED DECEMBER 31, 2022
TABLE OF CONTENTS
| Item | Page | |||||||||||||
2
PART I
Please note that this Annual Report on Form 10-K contains statements that may constitute “forward-looking statements” under the Private Securities Litigation Reform Act of 1995 (the "Reform Act"). Forward-looking statements include information concerning future strategic objectives, business prospects, anticipated savings, financial results (including earnings, liquidity, cash flow and capital expenditures), industry or market conditions, demand for our products and services, acquisitions and divestitures, anticipated results of litigation, regulatory developments or general economic conditions. Because actual results may differ materially from those expressed or implied by these forward-looking statements, we caution readers not to place undue reliance on these statements. Our business, financial condition, cash flows and operating results are influenced by many factors, which are often beyond our control, that can cause actual results to differ from those expressed or implied by the forward-looking statements. Part I, Item 1A of this report outlines known material risks and important information to consider when evaluating our forward-looking statements. The Reform Act provides a “safe harbor” for forward-looking statements to encourage companies to provide prospective information. When we use the words or phrases “should result,” “believe,” “intend,” “plan,” “are expected to,” “targeted,” “will continue,” “will approximate,” “is anticipated,” “estimate,” “project,” “outlook,” "forecast" or similar expressions in this Annual Report on Form 10-K, in future filings with the Securities and Exchange Commission, in our press releases, investor presentations and in oral statements made by our representatives, they indicate forward-looking statements within the meaning of the Reform Act. Readers are cautioned that all forward-looking statements are based upon current expectations and estimates and apply only as of the date of this report. We assume no obligation to update this information.
| ITEM 1. BUSINESS | ||
| OUR BUSINESS | ||
More than 105 years ago, Deluxe Corporation began providing payment solutions. Our longevity is a testament to our innovation, our ability to evolve with our customers, and the trust they place in us. We are no longer solely a check printing company, but have transformed to a Trusted Payments and Data CompanyTM that champions business so communities thrive. We support millions of small businesses, thousands of financial institutions and hundreds of the world's largest consumer brands, while processing approximately $3 trillion in annual payment volume. We operate primarily in the U.S., but we also sell our products and services in Canada and portions of Europe and South America. We operate 4 business segments that are generally organized by product type. These segments provide the following products and services:
| Business Segment | Category | Percentage of 2022 consolidated revenue | Description | |||||||||||||||||
| Payments | Merchant services and other payment solutions | 19.5 | % | Merchant in-store, online and mobile payment solutions; payables as a service, including eChecks, Medical Payment Exchange and Deluxe Payment Exchange; payroll and human resources services; fraud and security services | ||||||||||||||||
| Treasury management solutions | 10.8 | % | Receivables as a service, including remittance and lockbox processing, remote deposit capture, receivables management, and payment acceptance | |||||||||||||||||
| Total | 30.3 | % | ||||||||||||||||||
| Data Solutions | Data-driven marketing solutions | 7.9 | % | Solutions for marketing business-to-business and business-to-consumer | ||||||||||||||||
Web and hosted solutions |
4.0 | % | Web hosting and software-as-a-service (SaaS) solutions, including web design, logo design, financial institution profitability reporting, and business incorporation services | |||||||||||||||||
| Total | 11.9 | % | ||||||||||||||||||
| Promotional Solutions | Forms and other products | 13.0 | % | Business forms and accessories, including envelopes, labels, stationery and more | ||||||||||||||||
| Marketing and promotional solutions | 12.2 | % | Advertising specialties, promotional apparel and print services | |||||||||||||||||
| Total | 25.2 | % | ||||||||||||||||||
| Checks | Checks | 32.6 | % | Printed business and personal checks | ||||||||||||||||
3
We sold our Australian web hosting business during 2022 and expect to complete the sale of our North American web hosting and logo design businesses in the first quarter of 2023, after which we will have completed an intentional strategic exit from this market.
| OUR STRATEGY | ||
Our vision is to be a trusted technology partner empowering businesses to pay, get paid and grow. To realize this vision, we will continue to leverage our strengths.
•Our customers – Our products and services are utilized by customers of all sizes and maturities. We continue to benefit from a long heritage of offering trusted service to our customers, which in turn, fuels meaningful cash flow that is redeployed to invest in our products, infrastructure and growth opportunities.
•World-class payments and data products and platforms – We continue to invest in market-leading payments and data products and platforms that are proprietary to Deluxe, encouraging our customers to build their businesses on our platforms for the long-term.
•Scale – We believe our volumes for many of our service offerings enable us to offer per-unit costs and reliability superior to our competitors. We will continue to focus on scaling our technology and product management capabilities.
•Sales and distribution channels – We have extensive market reach, with millions of small business and consumer customers and thousands of financial institution clients. We will continue to maximize the deployment of these resources, including our sales force and our various strategic relationships, to cost-effectively reach customers.
Since 2019, our focus has been on our transformational strategy, moving from a traditional manufacturing “company of companies” to a more technologically focused “company of products.” We worked to integrate the numerous technology platforms we obtained over the years through our various acquisitions to achieve a connected, modern technology platform. We assembled a talented management team and built an organization focused on developing new and improved products. As a result, we are realizing the benefit of significant new client wins in all of our segments, and in 2022, we generated consolidated sales-driven revenue growth for the second consecutive year. In June 2021, we completed the acquisition of First American Payment Systems, L.P. (First American), a large-scale payments technology company that provides partners and merchants with comprehensive in-store, online and mobile payment solutions. The acquisition enables us to expand significantly in the fast-growing payments sector, a sector known for generating significant recurring revenues and cash flows, and revenue from our growing Payments segment is expected to surpass that of our Checks segment during the first half of 2023. We now have an even stronger foundation from which to pursue future acquisitions or strategic partnerships that will allow us to potentially realize significant revenue synergies, and we believe that our scaled back-end processing will readily support incremental volume.
Moving into the next stage of our transformation, we remain focused on strategic growth and scaling our operations. This includes maximizing our payments and data products, increasing recurring revenue streams, strengthening our talent and culture, and accelerating our portfolio rationalization efforts. For example, we sold our Australian web hosting business during 2022 and expect to complete the sale of our North American web hosting business in the first quarter of 2023. We also sold two smaller product lines within our Promotional Solutions segment. The sale of these businesses allows us to focus our resources on the key growth areas of payments and data. As we invest in these growth areas, we continue efforts to lower costs and simplify and eliminate duplicative processes. We continue to review our real estate footprint, and in 2022, we closed 6 facilities, in addition to the 40 facilities we closed during 2021 and 2020. We are continually refining our operating model to match expected customer needs and anticipated volumes, as well as to gain efficiencies.
| UPDATE ON COVID-19 IMPACT ON OUR BUSINESS | ||
The health and safety of our employees, our customers and their families is always our top priority. As of the date of this filing, all of our facilities are fully operational. When COVID-19 struck, we implemented a variety of new policies and procedures, including additional cleaning, social distancing, and significantly restricting on-site visitors, to minimize the risk to our employees of contracting COVID-19. While many of these precautions have been relaxed or eliminated as the health risk of COVID-19 has decreased, we may need to reinstitute and/or modify these policies and procedures as necessary should the health risk return to an unacceptable level. In such an event, our businesses or our suppliers could be impacted further by supply chain disruptions, which together with other factors such as a shortage of labor, could result in longer delivery times and restricted manufacturing capacity for certain of our products. Governmental actions in response to a resurgence of COVID-19 could also temporarily limit our business activities and those of our suppliers.
Emerging from the COVID-19 pandemic, we have experienced labor shortages, material and delivery inflation, and supply chain disruptions, including impacts on the supply of certain higher margin printed products in our Promotional Solutions segment. We experienced inflationary headwinds across all of our segments during the year ended December 31, 2022;
4
however, these impacts were largely mitigated, with some time lag, through price increases, when possible. We expect inflationary pressures to continue into fiscal 2023, and this trend could have a materially adverse impact if inflation rates significantly exceed our ability to continue to achieve price increases or if such price increases adversely impact demand for our products.
We will continue to actively monitor the situation and may take actions that impact our operations as may be required by federal, state or local authorities or that we determine are in the best interests of our employees, customers, suppliers and shareholders. The extent of additional adverse impacts on our financial condition and results of operations will be dictated by the currently unknowable duration and severity of COVID-19 and its variants, and individuals', companies' and governments' responses to the pandemic, inflation and other macroeconomic conditions.
| SALES AND MARKETING | ||
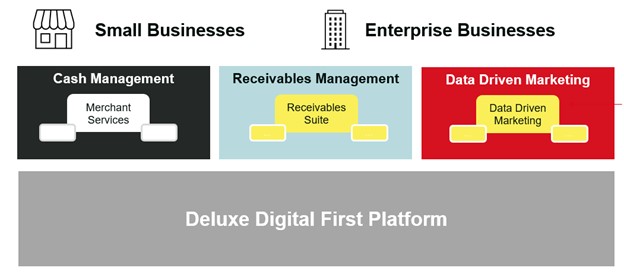
Everyone sells at Deluxe. We employ a customer-focused approach, deploying dedicated sales teams across our 4 business segments to ensure we leverage the expertise within each segment to meet our customer's needs. Our customers rely on our solutions and platforms to help their finance and marketing teams pay, get paid and grow their business (as illustrated below), allowing our business segments to help each other deliver greater value for our customers and enabling our customers to build their businesses on our platforms for the long-term.
We employ a multi-channel sales and marketing approach, selling directly to financial institutions and major global brands. We also sell our products and services through scalable partnerships, enabling us to cost-effectively reach customers, specifically leveraging our financial institution partnerships, our e-commerce assets and other strategic partnerships. In addition, millions of in-bound customer contacts buying or re-ordering our products and services provide extensive cross-sell opportunities.
| INDUSTRY TRENDS AND OUR COMPETITION | ||
Payment solutions, including checks
The payments industry continues to expand and evolve, with digital payment vehicles and transaction volumes growing around the world. The industry is continuously changing, highly innovative, and increasingly subject to regulatory scrutiny and oversight. The challenge for payment providers is to continually modernize their infrastructure to support new service offerings and to identify new revenue streams, as well as to invest in cloud computing and other digital technologies to more rapidly address evolving customer preferences. This pace of change puts pressure on payment providers to transform and adapt in order to remain competitive.
Competition in the payments industry is intense. We are competing against numerous financial technology (Fintech) companies, including independent payment processors, credit card processing firms and treasury management service providers, as well as financial institution in-house capabilities. Volume is the key to staying cost-competitive, as it allows us to drive scale in our operations, and breadth of services is critical to staying relevant to customers. We believe our competitive advantages are: our scalable platform, extensive distribution channels, superior end-customer experience, frictionless payments (i.e., non-disruptive for payer, and payment choices for payee), automated receivables management, a strong balance sheet and
5
a trusted and respected brand. We also believe there is growth potential for our Medical Payments Exchange (MPX) and Deluxe Payments Exchange (DPX) platforms, which convert paper checks to digital payments.
Our Checks business remains an important part of our strategy. We believe there will continue to be demand for personal and business checks for the foreseeable future. However, the total number of checks written in the U.S. has been in decline since the mid-1990s. The cash flow generated by our Checks business partially self-funds our growth investments. Our check programs are also an important source of lead generation for cost-effective cross-selling of other products and services.
Our Checks business faces significant competition from another large check printer in our traditional financial institution sales channel, direct mail and internet-based sellers of personal and business checks, check printing software vendors, and certain significant retailers. Pricing continues to be competitive in our financial institution sales channel, as financial institutions seek to maintain their previous levels of profitability, even as check usage declines. We believe our competitive advantages come from our design and customization options, our quality and service, the trust our customers have in us, and our strong financial position. In addition, our digital and print-on-demand technology allows us to implement new customer requirements faster and expand our premium check and overall print design options.
Data Solutions
Data-driven marketing – With increased competition among businesses to target and engage new and existing customers, the use of data-driven marketing has continued to increase and evolve. Competition in this industry is intense, with a wide variety of companies in the data solutions space, including advertising agencies, marketing technology firms, data aggregators and brokers, and source data providers. Adapting to new technology is a key challenge in this industry, along with hiring and retaining the right people. We must continually adapt to the changing needs of our customers and expand our offerings to provide a greater breadth of services.
We believe we have significant growth opportunity in this market. We continue to simplify and integrate our separate businesses operating in this market, monetize the significant amount of data we process across the company, invest in technologies, such as artificial intelligence and machine learning, and consolidate our data infrastructure to reduce costs. We also believe that our pay-for-performance offerings provide us a competitive advantage, as our customers value that they get the highest return on their marketing and advertising dollars.
Web and hosted solutions – The market for web hosting services is highly competitive and commoditized, requiring significant spending on product development and customer acquisition to effectively compete in this space. Our business was largely a white label service offered through telecom partners which did not allow for material cross-selling opportunities and did not fit within our overall portfolio. Accordingly, we have strategically moved to exit this business. We sold our Australian web hosting business during 2022 and expect to complete the sale of our North American web hosting and logo design businesses in the first quarter of 2023.
Promotional Solutions
The market for business forms and certain business accessories has been declining for several years, as continual technological improvements have provided businesses with alternative means to execute and record business transactions. Greater acceptance of electronic signatures has also contributed to the overall decline in printed products. The markets for business forms and promotional products are highly competitive and fragmented. Current and potential competitors include traditional storefront printing companies, office superstores, wholesale printers, online printing companies, small business product resellers and providers of custom apparel and gifts.
We believe that our competitive advantages include our multi-channel experience, ease of use, deep sources of supply and breadth of selection of branded apparel and promotional merchandise. We also believe that, by expanding our product set and driving integration of physical and digital solutions, we will transition this segment to a technology-driven business that can respond quickly to market opportunities and differentiate us from our competitors.
| OUR OPERATIONS / SUSTAINABLE PRACTICES | ||
We continue our focus on improving the customer experience by providing excellent service and quality, while increasing our productivity and reducing our costs. We accomplish this by embedding lean operating principles into our processes, while emphasizing a culture of continuous improvement. We utilize a shared services approach, which allows our businesses to leverage shared facilities to optimize capacity utilization and to enhance operational excellence. We continue to reduce costs by utilizing our assets and technologies more efficiently and by enabling employees to better leverage their capabilities and talents.
We have formed an Enterprise Environmental, Social and Governance ("ESG”) Council that is led by our Chief Compliance Officer, with participation from our executive leadership team and senior-level staff, including our General Counsel
6
and Vice Presidents representing our real estate, operations, and human resources functions. This council assesses and monitors our top enterprise ESG risks, goals and strategies and provides updates to our board of directors.
We have implemented a stakeholder-focused ESG program in order to meet the needs and expectations of regulators, our customers, shareholders and employees. We devote significant resources to addressing ESG throughout the enterprise, including waste reduction and process improvement efforts, enhancing our commitments to diversity, equity and inclusion (“DEI”) through our DEI Council and employee resource groups, promoting community awareness, giving back through our volunteer time off program, and continually improving our cybersecurity and privacy processes and controls to keep our data safe. We measure our ESG goals and impacts through yearly strategic assessments that keep us accountable and inform our annual and multi-year ESG strategies.
Sustainability is also embedded into our operational model. We take sustainability seriously and focus on the following areas:
•Energy – We implemented several energy-saving measures during last year's construction of our facilities in Atlanta and Minneapolis, including installing LED lighting, daylight harvesting strategies, optimized HVAC systems and material selections that reduce carbon input and increase recycled content.
•Waste – We are focused on understanding the waste stream in all of our facilities, with the goal of reducing the amount of waste we generate and recycling as much of our waste stream as practicable. We have moved from volume inventories of custom inks to onsite mixing systems. This has greatly reduced waste stream processing, with an added benefit of better response times for customers.
•Materials – Over 90% of our check and forms paper is purchased from Forest Stewardship Council-certified supplier mills. In addition, our vinyl checkbook covers are produced using a minimum of 45% post-industrial recycled material. We also employ recycling efforts that allow us to divert more of our waste out of landfills by being diligent in the segregation of our waste streams.
•Carbon – We continue to review every aspect of our business, including the materials we use, how we manage our facilities and the the role we play in communities, to ensure our growth includes sustainable practices.
Protecting the environment and our shared future is key to our business and to delivering the products our customers need.
| CYBERSECURITY | ||
We are a trusted partner to enterprises of all sizes, and this is a responsibility we take seriously. The secure and uninterrupted operation of our networks and systems, as well as the processing, maintenance and confidentiality of the sensitive information that resides on our systems, is critical to our business operations and strategy. Each year, we process hundreds of millions of records containing data related to individuals and businesses. In addition, many of our products are hosted solutions, and the amount of data we store for our customers on our servers, including personal, important business and other potentially sensitive information, has been increasing. Technology-based organizations such as ours are vulnerable to targeted attacks aimed at exploiting network and system applications or weaknesses. A successful cyberattack could result in the disclosure or misuse of sensitive business and personal information and data, cause interruptions in our operations, damage our reputation and deter clients and consumers from ordering our products and services. It could also result in litigation, the termination of client contracts, government inquiries and/or enforcement actions.
We have implemented a risk-based information/cybersecurity program dedicated to protecting our data and solutions. Our privacy policies, together with associated controls and procedures, provide a comprehensive framework to inform and guide the handling of data. These programs dovetail with our information security program in a manner designed to protect the data we handle. We employ an in-depth defensive strategy, utilizing the concept of security layers and the CIA (confidential, integrity and availability) triad model. Our information security program is led by our Chief Information Security Officer and the Information Security department, which establishes the policies, standards and strategies to manage security risk. We devote significant resources to addressing security vulnerabilities through enhancing security and reliability features in our products and services, reviewing and auditing our systems against independent security control frameworks, such as ISO 27001, and performing security maturity assessments, which inform our annual and multi-year cybersecurity strategies and our product security plans.
We have an Enterprise Risk Management Committee that is led by our Assurance and Risk Advisory Services group, our Chief Financial Officer and our Chief Administrative Officer, with participation from our executive leadership team and senior-level staff, including our Chief Compliance Officer and our Chief Information Security Officer. This committee assesses and monitors our top enterprise risks, including cybersecurity, and provides quarterly updates to our board of directors. Our Chief Information Security Officer also provides periodic updates to our board of directors, which is responsible for ensuring that we have implemented appropriate risk mitigation strategies, systems, processes and controls.
7
In the event a cybersecurity incident is identified, our Cybersecurity Incident Response team will act in accordance with our Incident and Crisis Management Program to communicate to our executive leadership team and to coordinate the response to any incident. Our Chief Executive Officer, Chief Financial Officer, General Counsel, Chief Information Security Officer and Chief Compliance Officer are responsible for assessing such incidents for materiality, ensuring that any required notification or communication occurs and determining, among other things, whether any prohibition on the trading of our common stock by insiders should be imposed prior to the disclosure of information about a material cybersecurity event. We maintain cybersecurity insurance coverage that insures us for costs resulting from cyberattacks, although this coverage may not reimburse us for all losses.
For more information on risks related to data security, see Item 1A, "Operational Risks – Security breaches, computer malware or other cyberattacks involving the confidential information of our customers, employees or business partners could substantially damage our reputation, subject us to litigation and enforcement actions, and substantially harm our business and results of operations."
| OUR MATERIALS, SUPPLIES AND SERVICE PROVIDERS | ||
The principal materials used in producing our main products are paper, plastics, ink, corrugated packaging and printing plate material, which we purchase from various sources. We also purchase stock business forms and promotional apparel produced by third parties. In addition, we have entered into agreements with third-party providers for delivery services and information technology services, including telecommunications, network server and transaction processing services, as well as various other services. We also rely on third parties to provide a portion of the data used to maintain our proprietary and non-proprietary databases, including credit and non-credit data from the national credit bureaus and other data brokers.
We have engaged a third-party global sourcing group to help manage our supply chain. We believe that in the event one of our vendors fails to perform, we would be able to obtain an alternative source of supply. However, with recent stresses on the global supply chain and labor market, we are taking steps to secure multiple sources of supply for certain of the materials and services we utilize, including those related to certain higher margin printed products in our Promotional Solutions segment. We can provide no assurance that we would be able to obtain an alternative source of supply, or that such supply could be obtained at current prices, in the event one of our vendors fails to perform.
| OUR HUMAN CAPITAL | ||
Our most valuable asset is our employee-owners. As of December 31, 2022, we had 5,863 employees, with 5,310 employees in the United States, 528 employees in Canada and the remainder located in Europe. Approximately 98% of our team is full-time employees, with 59% representing non-exempt roles working in production, processing or call center functions. We are proud of our strong history of positive, productive employee relations. None of our employees are currently represented by labor unions.
The foundation of our continuing success as a Trusted Payments and DataTM company is our ability to attract and retain diverse, exceptional and motivated talent. We accomplish this by providing a culture of inclusion, diversity, equity, development, opportunity and empowerment.
Results-Driven, Community-Focused, Collaborative Culture
We focus on creating an environment where our employee-owners, also known as Deluxers, feel respected and valued, and where they can contribute to their full potential. To this end, an important component of our strategy is that all North American employees are granted restricted stock unit awards. Our heritage also reflects deep-seated roots in community support and volunteerism, which is reflected in our purpose statement: “Champions for business so communities thrive.” Additionally, our values focus on delivering results:
•Customers First
•Earn Trust
•Innovation
•Grit and Perseverance
•Power of One
In an effort to continue to improve our culture and engagement, we provide learning and development at all levels of the organization on a variety of topics, including, leadership development, mentoring, and diversity, equity and inclusion. We continue to focus on training and development programs and transparent communication channels through change pulse checks, surveys, senior leadership forums and employee resource groups. We also provide a tool that allows for anonymous feedback directly from employees to management on new ideas, concerns and questions.
8
Diversity, Equity and Inclusion
We embrace DEI in our workforce, customers and partners, valuing their unique backgrounds, experiences, thoughts and talents. Our mission is to empower all employees to bring their full authentic selves to work and to foster an environment that reflects the diverse communities we serve. We strive to cultivate a culture and vision that supports and enhances our ability to recruit, develop and retain diverse talent at every level. We provide our customers, partners, and shareholders information about our DEI program and our activities supporting social justice within the communities we serve. In addition, we are focused on furthering our DEI initiatives throughout our business and have, among other things, created a DEI council that is sponsored by our Chief Human Resources Officer. This council is comprised of employee-owners across multiple functions and business segments. Its top priorities include implementing a comprehensive DEI learning and development plan to build awareness and drive inclusive behaviors; further developing our diversity pipeline through hiring, mentoring and coaching; and establishing goals and metrics to ensure progress.
As of December 31, 2022, our total workforce was approximately 56% female and 44% male. Our team members located in the United States were comprised of approximately 55% white, 16% Black or African American, 11% Hispanic or Latino, 10% Asian American and 8% other. We continue to focus our development and DEI programs on growing the number of female and minorities represented in leadership roles.
Under the board’s oversight and guidance, we have taken significant actions to enhance our diverse and inclusive culture, protect and train our employees, and maintain our reputation as a great place to work. We continually strive to improve the attraction, retention, and advancement of diverse employees to grow and retain talent that represents the communities in which we operate. Below are some recent examples of our commitment to DEI.
•33% of our directors identify as from diverse backgrounds, including the independent chair of our board, who is a woman of color.
•In 2020, we formed our employee resource committee and established 4 employee resource groups ("ERGs") dedicated to fostering inclusion and diversity. Since 2020, we have grown our programs and now offer 9 ERGs, including African American, Pacific Islander Middle Eastern Asian, disabled, Hispanic and Latino, veteran, LGBTQ+, parent and women.
•In 2022, we earned the honor of becoming a Yellow Ribbon Company, a designation awarded by the state of Minnesota to those companies meeting the top criteria for supporting veterans and their families.
•In 2022, we earned a top score of 100 on the Disability Equality Index and were named a “Best Place to Work for Disability Inclusion” for the third year in a row.
•In 2022, The Human Rights Campaign Foundation’s Corporate Equality Index recognized us as a Best Place to Work for the LGBTQ+ Equality.
Health, Wellness and Safety
Creating a culture where all employee-owners feel supported and valued is paramount to our strategy. We continue to monitor developments related to COVID-19 and its variants, and we continue to take steps to ensure the safety of our employees and business partners. We also continue to provide a competitive benefits package focused on fostering work/life integration. Well-being in our organization is about having a holistic commitment to provide resources and support for our employees so that they can deliver for customers and shareholders. We offer several programs to benefit our employees and support work environments that encourage growth, innovation, and productivity. These benefits range from standard medical, dental, life and disability insurance to programs that provide additional support for our employees' mental, physical, financial and social wellbeing. We provide paid parental leave and infertility, adoption and surrogacy assistance. We partner with Care.com® to offer services for employees to find tutors, nannies, children’s daycare and eldercare, and we offer an employee assistance program that provides employees with confidential counseling. We also offer employees tuition and travel assistance, and qualified long-term employees have the opportunity to take a sabbatical. Beginning in 2023, we began offering unlimited flexible time off to our salaried employees. By enabling our employees to thrive in their personal lives, we provide tools for our employees to best deliver for customers and shareholders while at work.
Community Engagement
Our employee-owners believe in the power of connection, of activity and of giving back to the communities we serve. Our partnerships and charitable work in the communities we serve are an integral part of our core values. This spirit of community is felt throughout our organization and is fostered by our paid volunteer time off (VTO) program for employees, which provides three paid VTO days per year. It is also reflected in our partnership with the Deluxe Foundation, which enables employees to donate to not-for-profit organizations of their choosing and receive a matching donation, dollar for dollar, up to $2,000 per year. Our commitments go beyond monetary donations. Several of our top executives serve on boards for major not-for-profit organizations and other community organizations that align with our company values of diversity initiatives, rebuilding communities and education.
9
We continue our commitment to enriching our communities in the following ways:
•Since 1992, we have partnered with Junior Achievement USA® chapters in our local communities to inspire and prepare young people to succeed. We support Junior Achievement’s mission through foundation grants, awareness and employee volunteers.
•We have partnered with the American Red Cross® for decades, organizing blood drives at our locations and hosting fundraisers and bake sales to help fund the American Red Cross mission of preventing and alleviating human suffering in the face of emergencies.
•In 2022, in partnership with Habitat for Humanity®, we helped build new homes across the country, including inviting our technology partners to join us on a two day build in Chaska, Minnesota.
•For Black History Month in 2022, we partnered with the Minnesota Timberwolves and Minnesota Lynx to film an original YouTubeTM series called “The Come Up,” that focused on highlighting the significance of black excellence and the importance of uplifting the black community.
•Our employees pledged $133,000 in donations under our 2022 employee giving campaign.
•In 2022, our employees contributed more than 22,500 hours to our local communities through our VTO program.
| SEASONALITY | ||
Historically, we have experienced seasonal trends with some of our products and services. For example, Promotional Solutions holiday card and revenues from certain marketing services in Data Solutions are typically stronger in the fourth quarter of the year due to the holiday season, while sales of Promotional Solutions tax forms are stronger in the first and fourth quarters of the year. Our customers' marketing campaign cycles may also result in some revenue fluctuations for these segments.
| GOVERNMENT REGULATION | ||
We are subject to numerous international, federal, state and local laws and regulations that affect our business activities in several areas, including, but not limited to, labor, advertising, taxation, data privacy and security, digital content, consumer reports, consumer protection, merchant processing, online payment services, real estate, e-commerce, intellectual property, health care, environmental matters, and workplace health and safety. The complexity of complying with existing and new laws and regulations is significant, and regulators may adopt new laws or regulations at any time.
For more specific information about the effects of government regulation on our business, see Item 1A, "Legal and Compliance Risks – Governmental regulation is continuously evolving and could limit or harm our business." We believe that the impact on our capital expenditures and earnings of complying with government regulations will not be materially different in the upcoming year than it was in 2022.
| AVAILABLE INFORMATION | ||
We make available, without charge, through our investor relations website, www.investors.deluxe.com, our annual reports on Form 10-K, quarterly reports on Form 10-Q, current reports on Form 8-K and amendments to these reports filed or furnished pursuant to section 13(a) or 15(d) of the Securities Exchange Act of 1934, as amended, as soon as reasonably practicable after these items are electronically filed with or furnished to the SEC. These reports can also be accessed via the SEC website, www.sec.gov.
A printed copy of this report may be obtained without charge by calling 651-787-1068, by sending a written request to the attention of Investor Relations, Deluxe Corporation, P.O. Box 818095, Cleveland, Ohio 44181, or by sending an email request to investor.relations@deluxe.com.
Further information about Deluxe Corporation is also available at www.deluxe.com, www.facebook.com/deluxecorp, www.linkedin.com/company/deluxe and www.twitter.com/deluxe. The content of these websites is not incorporated by reference in this Annual Report on Form 10-K or in any other report or document we file with the Securities and Exchange Commission.
| OUR CODE OF ETHICS AND CORPORATE GOVERNANCE GUIDELINES | ||
We have adopted a Code of Ethics that applies to all of our employees and our board of directors. The Code of Ethics is available on our investor relations website, www.investors.deluxe.com, and also can be obtained free of charge upon written request to the attention of Investor Relations, Deluxe Corporation, P.O. Box 818095, Cleveland, Ohio 44181. Any changes or
10
waivers of the Code of Ethics will be disclosed on our website. In addition, our Corporate Governance Guidelines and the charters of the Audit, Compensation, Corporate Governance and Finance Committees of our board of directors are available on our website, www.investors.deluxe.com, or upon written request.
| INFORMATION ABOUT OUR EXECUTIVE OFFICERS | ||
Our executive officers are appointed by the board of directors each year. The following summarizes our executive officers and their positions.
| Name | Age | Present Position | Executive Officer Since | ||||||||
| Barry McCarthy | 59 | President and Chief Executive Officer | 2018 | ||||||||
| William "Chip" Zint | 37 | Senior Vice President, Chief Financial Officer | 2022 | ||||||||
| Garry Capers, Jr. | 46 | Senior Vice President, Division President, Data Solutions and Promotional Solutions | 2019 | ||||||||
| Jeffrey Cotter | 55 | Senior Vice President, Chief Administrative Officer and General Counsel |
2018 | ||||||||
| Tracey Engelhardt | 58 | Senior Vice President, Division President, Checks and Chief of Operations | 2012 | ||||||||
| Jean Herrick | 54 | Senior Vice President, Chief Human Resources Officer | 2022 | ||||||||
| Yogaraj "Yogs" Jayaprakasam | 45 | Senior Vice President, Chief Technology and Digital Officer | 2022 | ||||||||
| Amanda Parrilli | 44 | Senior Vice President, Chief Strategy, Transformation and Business Development Officer | 2019 | ||||||||
| Michael Reed | 51 | Senior Vice President, Division President, Payments | 2019 | ||||||||
Barry McCarthy joined us in November 2018 as President and Chief Executive Officer. Prior to joining us, Mr. McCarthy served in various senior executive positions, most recently, from November 2014 to November 2018, as Executive Vice President and Head of Network and Security Solutions, a segment of publicly traded First Data Corporation, a financial services company, now part of Fiserv, Inc.
Chip Zint joined us in August 2020 as Vice President of Corporate Finance and was named Senior Vice President, Chief Financial Officer in October 2022. Prior to joining us, Mr. Zint held several positions with NCR Corporation, an enterprise technology provider, most recently as Vice President of Finance and Chief Financial Officer of Hardware from January 2019 to July 2020 and Vice President, Corporate Financial Planning and Analysis from May 2017 to January 2019.
Garry Capers, Jr. joined us in September 2019 as Senior Vice President, Division President, Data Solutions, and in November 2021, added the Promotional Solutions segment to his responsibilities. Prior to joining us, Mr. Capers was employed by Automatic Data Processing, Inc., a provider of human resources management software and services, from January 2017 to September 2019, most recently as Senior Vice President, General Manager, National Account Services Comprehensive Outsourcing Services and Operations.
Jeffrey Cotter was named Chief Administrative Officer in January 2019. Mr. Cotter joined us in June 2018 as Senior Vice President, General Counsel. Prior to joining us, Mr. Cotter served as Senior Vice President and General Counsel for Tennant Company, a provider of cleaning products and solutions, from September 2017 to June 2018.
Tracey Engelhardt was named Senior Vice President, Division President, Checks in October 2019 and in May 2022, she added Chief of Operations to her responsibilities. From March 2017 to October 2019, Ms. Engelhardt served as Senior Vice President, Direct-to-Consumer.
Jean Herrick was named Senior Vice President, Chief Human Resources Officer in June 2022. From January 2016 to June 2022, Ms. Herrick served as Vice President, Human Resources.
Yogs Jayaprakasam joined us in May 2022 as Senior Vice President, Chief Technology and Digital Officer. Prior to joining us, Mr. Jayaprakasam held several positions with American Express Company, most recently as Unit Chief Information Officer for the Global and Large Client Group and head of engineering for B2B Digital Payments from June 2021 to May 2022. Mr. Jayaprakasam also served American Express Company as Vice President, Enterprise Platforms for Sales, Marketing and Data Platforms from May 2020 to June 2021, and as Vice President, Enterprise Platforms for Sales and Marketing from November 2017 to May 2020.
Amanda Parrilli was named Senior Vice President, Business Development and Strategy in October 2019, and in June 2020, she added Transformation to her responsibilities. Ms. Parrilli joined us in February 2019 as Vice President, Strategy. Prior
11
to joining us, Ms. Parrilli held several positions at The Home Depot, Inc., most recently as Senior Director, Services Lead Generation from January 2018 to February 2019.
Michael Reed joined us in November 2019 as Senior Vice President, Division President, Payments. Prior to joining us, Mr. Reed served as Managing Director, Global Payments and Product for Barclays Bank Plc in London from September 2018 to November 2019. From January 2015 to August 2018, Mr. Reed served as Managing Director at BofA Merrill Lynch Merchant Services (Europe) Limited, the European subsidiary of Banc of America Merchant Services, LLC.
| ITEM 1A. RISK FACTORS | ||||||||||||||
We routinely encounter and address risks, many of which could cause our future results to be materially different than we currently anticipate. These risks include, but are not limited to, the principal factors listed below and the other matters set forth in this Annual Report on Form 10-K. We place no priority or likelihood based on these descriptions or order of presentation. We are also subject to general risks and uncertainties that affect many other companies, including overall economic, industry and market conditions. Additional risks not presently known to us, or that we currently believe are immaterial, may also adversely affect us. You should carefully consider all of these risks and uncertainties before investing in our common stock.
| STRATEGIC RISKS | ||
If our long-term growth strategy is not successful, our business and financial results would be adversely impacted.
Our vision is to be a trusted technology partner empowering businesses to pay, get paid and grow. Further information about our strategy can be found under the caption "Our Strategy" appearing in Part I, Item 1 of this report. We may not achieve our long-term objectives, and investments in our business may fail to impact our financial results as anticipated. Our strategic plan could fall short of our expectations for many reasons, including, among others:
•our failure to generate profitable revenue growth;
•our inability to acquire new customers, retain our current customers and sell more products and services to current and new customers;
•our failure to fully utilize new sales technology that enables a single view of our customers;
•our inability to implement additional improvements to our technology infrastructure, our digital services offerings and other key assets to increase efficiency, enhance our competitive advantage and scale our operations;
•our failure to develop new products and services;
•our failure to effectively manage the growth, expanding complexity and pace of change of our business and operations;
•our inability to effectively operate, integrate or leverage businesses we acquire;
•the failure of new products and services to achieve widespread customer acceptance;
•our inability to promote, strengthen and protect our brand;
•an unexpected change in demand for checks or other products;
•our failure to attract and retain skilled talent to execute our strategy and sustain our growth;
•unanticipated changes in our business, markets, industry or the competitive landscape; and
•general economic conditions.
We can provide no assurance that our strategy will be successful, either in the short term or in the long term, that it will generate a positive return on our investment or that it will not materially reduce our adjusted earnings before interest, taxes, depreciation and amortization (adjusted EBITDA) margins. If our strategy is not successful, or if there is market perception that our strategy is not successful, our reputation and brand may be damaged and our stock price may fall.
If we are unable to attract and retain customers in a cost-effective manner or effectively operate a multichannel customer experience, our business and results of operations would be adversely affected.
Our success depends on our ability to attract new and returning customers in a cost-effective manner. We use a variety of methods to promote our products and services, including a direct sales force, partner referrals, email marketing, purchased search results from online search engines, direct mail advertising, broadcast media, advertising banners, social media and other online links. Certain of these methods may become less effective or more expensive. For example, response rates for direct mail advertising have been decreasing for some time, internet search engines could modify their algorithms or increase prices for purchased search results or certain partner referrals could decline. Because we offer a diverse portfolio of products and services, we may also face challenges in increasing customer awareness of all of our offerings. Efforts to expand customer awareness of our diverse range of products and services may result in increased marketing expense and may fail to generate additional revenue.
We continually evaluate and modify our marketing and sales efforts to achieve the most effective mix of promotional methods. Competitive pressure may inhibit our ability to reflect increased costs in the prices of our products and services and/or
12
new marketing strategies may not be successful. Either of these occurrences would have an adverse impact on our ability to compete and our results of operations would be adversely affected. In addition, when our check supply contracts expire, customers have the ability to renegotiate their contracts with us or to consider changing suppliers. Failure to achieve favorable contract renewals and/or to obtain new check supply customers would result in decreased revenue.
Additionally, we believe we must maintain a relevant, multichannel experience in order to attract and retain customers. Customers expect to have the ability to choose their method of ordering, whether via the mail, computer, phone or mobile device. Although we are constantly investing in our user experience, we cannot predict the success of these investments. Multichannel marketing is rapidly evolving and we must keep pace with the changing expectations of our customers and new developments by our competitors. If we are unable to implement improvements to our customer-facing technology in a timely manner, or if our customer-facing technology does not function as designed, we could find it increasingly difficult to attract new and returning visitors, which would result in decreased revenue.
We face intense competition from other business enterprises, and we expect that competition will continue to increase.
Competition in the payments industry is intense. We are competing against numerous financial technology (Fintech) companies, including independent payment processors, credit card processing firms and treasury management service providers, as well as financial institution in-house capabilities. Volume is the key to staying cost-competitive, and breadth of services is critical to staying relevant to customers. In addition, although we are a leading check printer in the U.S., we face considerable competition in the check printing portion of the payments industry from another large check printer in our traditional financial institution sales channel, from direct mail and internet-based sellers of personal and business checks, from check printing software vendors, and from certain significant retailers. Pricing continues to be competitive in our financial institution sales channel, as financial institutions seek to maintain their previous levels of profitability, even as check usage declines.
Within our Data Solutions segment, our data-driven marketing services face intense competition from a wide variety of companies in the data solutions space, including advertising agencies, marketing technology firms, data aggregators and brokers, and source data providers. Adapting to new technology is a key challenge in this business, along with hiring and retaining the right people.
Within our Promotional Solutions segment, the markets for business forms and promotional products are intensely competitive and highly fragmented. Current and potential competitors include traditional storefront printing companies, office superstores, wholesale printers, online printing companies, small business product resellers and providers of custom apparel and gifts. The competitive landscape for online suppliers continues to be challenging as new businesses enter the space.
We can provide no assurance that we will be able to compete effectively against current and future competitors. Our competitors may develop better products or technologies and may be able to adapt more quickly to new or emerging technologies and changes in customer requirements. Continued competition could result in price reductions, reduced profit margins and/or loss of customers, all of which would have an adverse effect on our results of operations and cash flows.
If we do not adapt to changes in technology in a timely and cost-effective manner, we could lose clients or have trouble attracting new clients, and our ability to grow may be limited.
Rapid, significant, and disruptive technological changes impact the markets for our products and services, including changes in payment and internet browser technologies and the use of artificial intelligence and machine learning, as well as developments in technologies supporting our regulatory and compliance obligations and in-store, digital, mobile and social commerce. The introduction of competing products and services using new technologies, the evolution of industry standards or the introduction of more attractive products or services, including continued increases in the digitization of payments, could make some of our products and services less desirable, or even obsolete. Our ability to enhance our current products and services and to develop and introduce innovative products and services will significantly affect our future success. The impact is magnified by the intense competition we face. To be successful, our technology-based products and services must keep pace with technological developments and evolving industry standards, address the ever-changing and increasingly sophisticated needs of our customers, and achieve market acceptance. Additionally, we must differentiate our service offerings from those of our competitors and from the in-house capabilities of our customers. We could lose current and potential customers if we are unable to develop products and services that meet changing demands in a timely manner. Additionally, we must continue to develop our skills, tools and capabilities to capitalize on existing and emerging technologies, and this requires significant investment, takes considerable time and ultimately, may not be successful. Any of the foregoing risks could result in harm to our business, results of operations and growth prospects.
We may be unable to successfully identify future acquisitions, integrate past and future acquisitions and realize the anticipated benefits of the transactions.
We have completed many acquisitions during the past several years, including the acquisition of First American in June 2021, which was the largest acquisition in our history. In addition, we purchased the operations of several small business distributors with the intention of growing revenue in our dealer channels. We are currently devoting significant management
13
attention and resources to integrating the business practices and operations of First American and our previous acquisitions. The integration of any acquisition involves numerous risks, including, among others:
•the inability to successfully combine the businesses in a manner that permits us to achieve the revenue synergies and cost savings anticipated to result from the acquisition, which would result in the anticipated benefits of the acquisition not being realized in the anticipated timeframe or at all;
•difficulties and/or delays in assimilating operations and ensuring that a strong system of information security and controls is in place;
•the complexities of integrating a company with different products, services, markets and customers;
•performance shortfalls due to the diversion of management's attention from other business concerns;
•lost sales and customers as a result of certain customers, retail partners, financial institutions or other third parties deciding not to do business with us;
•unanticipated integration costs;
•complexities associated with implementing necessary controls for the acquired business activities to address our requirements as a public company;
•difficulties in identifying and eliminating redundant and underperforming functions and assets;
•the complexities of assimilating the acquired business into our corporate culture and management philosophies;
•unidentified issues not discovered during our due diligence process, including product or service quality issues, intellectual property issues and tax or legal contingencies;
•failure to address legacy distributor account protection rights; and
•loss of key employees.
One or more of these factors could impact our ability to successfully operate, integrate or leverage an acquisition and could materially and adversely affect our business and financial results.
We have indicated that we plan to supplement sales-driven revenue growth with strategically targeted acquisitions over time. The time and expense associated with finding suitable businesses, technologies or services to acquire can be disruptive to our ongoing business and may divert management’s attention. We cannot predict whether suitable acquisition candidates can be identified or acquired on acceptable terms or whether any acquired products, technologies or businesses will contribute to our revenue or earnings to any material extent. We may need to seek additional financing for larger acquisitions, which would increase our debt obligations and may not be available on terms that are favorable to us. Additionally, acquisitions may result in additional contingent liabilities, additional amortization expense, and/or future non-cash asset impairment charges related to acquired intangible assets and goodwill, and thus, could adversely affect our business, results of operations and financial condition.
The use of checks and forms is declining and we may be unable to offset the decline with profitable revenue growth.
Checks continue to be a significant portion of our business, accounting for 32.6% of our consolidated revenue in 2022, and providing a significant amount of the cash flows we invest in our growth businesses, although our Payments segment now rivals our Checks segment in terms of revenue. We sell checks for personal and business use and believe that there will continue to be demand for personal and business checks for the foreseeable future, although the total number of checks written in the U.S. has been in decline since the mid-1990s. We expect that the number of checks written will continue to decline due to the digitization of payments, including debit cards, credit cards, direct deposit, wire transfers, and other payment solutions, such as PayPal®, Apple Pay®, Square®, Zelle®, and Venmo®, as well as cryptocurrencies. In addition, the RTP® system run by The Clearing House Payments Company, LLC is a real-time payments system that currently reaches approximately 60% of U.S. bank accounts. The U.S. Federal Reserve has announced that it plans to develop its own real-time payments system, FedNowSM, with an expected launch in mid-2023.
The rate and the extent to which digital payments will replace checks, whether as a result of legislative developments, changing payment systems, personal preference or otherwise, cannot be predicted with certainty. Increased use of alternative payment methods, or our inability to successfully offset the secular decline in check usage with new check supply clients or other sources of revenue, would have an adverse effect on our business, cash flows and results of operations.
The use of business forms has also been declining. Continual technological improvements, including the lower price and higher performance capabilities of personal computers, printers and mobile devices, have provided small business customers with alternative means to execute and record business transactions. Additionally, electronic transaction systems, off-the-shelf business software applications, web-based solutions and mobile applications have been designed to replace preprinted business forms. Greater acceptance of electronic signatures also has contributed to the overall secular decline in printed products. It is difficult to predict the pace at which these alternative products and services will replace standardized business forms. If small business preferences change rapidly and we are unable to develop new products and services with comparable operating margins, our results of operations would be adversely affected.
14
Our business depends on our strong and trusted brand, and any failure to maintain, protect and enhance our brand would hurt our business.
We have developed a strong and trusted brand that has contributed significantly to the success of our business. We believe that maintaining and promoting our brand in a cost-effective manner is critical to achieving widespread acceptance of our products and services, expanding our base of customers, and attracting and retaining top talent throughout the organization. We believe that the importance of brand recognition and trust is particularly essential for the success of our various service offerings because of the level of competition for these services. Customer awareness of our brand, as well as the perceived value of our brand, depends largely on the success of our marketing efforts, our ability to continue to provide useful, reliable, secure and innovative products and services, and our ability to maintain trust and be a technology leader. If we fail to successfully promote and maintain our brand or if we incur excessive expenses in this effort, our business could be materially and adversely affected. There is also the risk that adverse publicity, whether or not justified, could adversely affect our business. If our business partners or key employees are the subject of adverse news reports or negative publicity, our reputation may be tarnished and our results of operations could be adversely affected.
A component of our brand promotion strategy is building on our relationship of trust with our customers, which we believe can be achieved by providing a high-quality customer experience. We have invested, and will continue to invest, in website development, design and technology, and customer service and production operations. Our ability to provide a high-quality customer experience is also dependent on external factors, including the reliability and performance of our suppliers, telecommunications providers and third-party carriers. Our brand value also depends on our ability to protect and use our customers' data in a manner that meets expectations. The failure of our brand promotion activities to meet our expectations or our failure to provide a high-quality customer experience for any reason could adversely affect our ability to attract new customers and maintain customer relationships, which would adversely harm our business and results of operations.
Our cost reduction initiatives may not be successful.
Intense competition and secular declines in the use of checks and business forms compels us to continually improve our operating efficiency in order to maintain or improve profitability. Cost reduction initiatives have required, and will continue to require, up-front expenditures related to various actions, such as redesigning and streamlining processes, consolidating information technology platforms, standardizing technology applications, further enhancing our strategic supplier sourcing arrangements, improving real estate utilization and funding employee severance benefits. We can provide no assurance that we will achieve future cost reductions or that we will do so without incurring unexpected or greater than anticipated expenditures. Moreover, we may find that we are unable to achieve business simplification and/or cost reduction goals without disrupting our business, negatively impacting efforts to grow our business or reducing the effectiveness of our sustainability practices. As a result, we may choose to delay or forgo certain cost reductions as business conditions require. Failure to continue to improve our operating efficiency and to generate adequate savings to fund necessary investments could adversely affect our business if we are unable to remain competitive.
| OPERATIONAL RISKS | ||
We are unable to predict the extent to which COVID-19 or other outbreaks, epidemics, pandemics, or public health crises may adversely impact our business, financial condition and results of operations.
Although the immediate impacts of the COVID-19 pandemic have declined, the sweeping nature of the pandemic makes it extremely difficult to predict how our business and operations may be affected in the longer term. The extent to which COVID-19 continues to impact our business depends on future developments, many of which are unknown, such as: the severity and duration of the pandemic, including the impact of COVID-19 variants; governmental, business and individuals' actions in response to the pandemic; vaccination rates; and the resulting impact on economic activity and the financial markets. There are no comparable recent events that provide guidance as to the effect the COVID-19 pandemic may have, and, as a result, the ultimate impact of the pandemic is highly uncertain and subject to change.
In addition to the above impacts, at the onset of the COVID-19 pandemic in 2020, all of our employees who had the ability to work from home did so, and the success of our work-from-home model allowed us to accelerate certain site closures. Although our facilities re-opened in late 2021, a portion of our employees now work remotely on a permanent basis and many others work remotely for portions of each work week, which increases our cybersecurity and data security risk. Changes in the scope and severity of the pandemic may cause us to once again close certain of our facilities to protect the health of our employees, as a result of disruptions in the operation of our supply chain, or in response to a prolonged decrease in demand for our products and services. Disruptions caused by future facility closures, along with the subsequent reintroduction of employees back into the workplace, could introduce operational risks, negatively impact productivity or result in claims by employees.
Other cascading effects of the COVID-19 pandemic, along with other outbreaks, epidemics, pandemics or public health crises that are not currently foreseeable, could materially increase our costs, negatively impact our revenue and adversely impact our results of operations and liquidity, possibly to a significant degree. We cannot predict the severity or duration of any
15
such impacts. Such events could have the effect of heightening or exacerbating many of the other risks described in this Risk Factors discussion.
Security breaches, computer malware or other cyberattacks involving the confidential information of our customers, employees or business partners could substantially damage our reputation, subject us to litigation and enforcement actions, and substantially harm our business and results of operations.
Information security risks have increased in recent years, in part because of the proliferation of new technologies and an increase in remote work arrangements, as well as the increased sophistication and activities of hackers, terrorists and activists. In addition, our information security risks have increased with the acquisition of companies with their own technologies, which we continue to integrate into our systems and processes. Until these technologies are integrated, we may experience a period of increased risk. We use internet-based channels that collect customers’ financial account and payment information, as well as other sensitive information, including proprietary business information and personally identifiable information of our customers, employees, contractors, suppliers and business partners. Each year, we process hundreds of millions of records containing data related to individuals and businesses. We also provide services that are instrumental in supporting our customers and their businesses, such as website/email hosting and remittance processing. Cybersecurity is one of the top risks identified by our Enterprise Risk Management Committee, as technology-based organizations such as ours are vulnerable to targeted attacks aimed at exploiting network and system weaknesses.
The secure and uninterrupted operation of our networks and systems, as well as the processing, maintenance and confidentiality of the sensitive information that resides on our systems, is critical to our business operations and strategy. We have a risk-based information/cybersecurity program dedicated to protecting our data and solutions. We employ a defensive in-depth strategy, utilizing the concept of security layers and the CIA (confidential, integrity and availability) triad model. Computer systems and networks are, by nature, vulnerable to unauthorized access. An accidental or willful security breach could result in unauthorized access and/or use of customer information, including consumers' personally identifiable information or, in some cases, the protected health information of certain individuals. Our security measures could be breached by third-party action, computer viruses, accidents, employee or contractor error, or malfeasance by rogue employees. In addition, we depend on a number of third parties, including vendors, developers and partners, that are critical to our business and to which we may grant access to our customer or employee data. While we conduct due diligence on these third parties with respect to their security and business controls, we rely on them to effectively monitor and oversee these control measures. Individuals or third parties may be able to circumvent controls and/or exploit vulnerabilities that may exist, resulting in the disclosure or misuse of sensitive business and personal customer or employee information and data.
We utilize third-party providers to help support and provide our services to customers. We have established a vendor security program that assesses the risk of these partners, and certain of our third-party relationships are subject to security requirements as specified in written contracts. However, we cannot control the actions of our third-party providers, and any cyberattacks or security breaches they experience could adversely affect our ability to service our customers or otherwise conduct our business.
Because techniques used to obtain unauthorized access, disable or degrade service, or sabotage computer systems change frequently, may be difficult to detect immediately, and generally are not recognized until they are launched against a target, we may be unable to implement adequate preventive measures. Unauthorized parties may also attempt to gain access to our systems or facilities through various means, including hacking into our systems or facilities, fraud, trickery or other means of deceiving employees and contractors. We have experienced external internet-based attacks by threat actors aimed at disrupting internet traffic and/or attempting to place illegal or abusive content on our or our customers’ websites. Additionally, our customers and employees have been and will continue to be targeted by threat actors using social engineering techniques to obtain confidential information or using fraudulent "phishing" emails to introduce malware into the environment. To-date, these various threats and incidents have not materially impacted our customers, our business or our financial results. However, our technologies, systems and networks are likely to be the target of future attacks due to the increasing threat landscape for all technology businesses, and we can provide no assurance that future incidents will not be material.
Despite our significant cybersecurity systems and processes, a party that circumvents our security measures could misappropriate our own, our customers' or our partners' personal or proprietary information, cause interruption in our operations, damage our computers or those of our users, or otherwise damage our reputation, all of which could deter clients and consumers from ordering our products and services and result in the termination of client contracts. Additionally, it is possible that there could be vulnerabilities that impact large segments of mobile, computer or server architecture. Any of these events would adversely affect our business, financial condition and results of operations.
In addition, if we were to experience a material information security breach, we may be required to expend significant amounts of management time and financial resources to remedy, protect against or mitigate the effects of the breach, and we may not be able to remedy the situation in a timely manner, or at all. Furthermore, under payment card association rules and our contracts with debit and credit card processors, if there is a breach of payment card information that we store or that is stored by third parties with which we do business, we could be liable to the payment card issuing banks for their cost of issuing new cards and other related expenses. We could also lose our ability to accept and process credit and debit card payments, which would likely result in the loss of customers and the inability to attract new customers. We could also be exposed to time-consuming and
16
expensive litigation, government inquiries and/or enforcement actions. If we are unsuccessful in defending a claim regarding information security breaches, we may be forced to pay damages, penalties and fines, and our insurance coverage may not be adequate to compensate us fully for any losses that may occur. Contractual provisions with third parties, including cloud service providers, may limit our ability to recover losses resulting from the security breach of a business partner.
There are international, federal and state laws and regulations requiring companies to notify individuals of information security breaches involving their personal data, the cost of which would negatively affect our financial results. These mandatory disclosures regarding an information security breach often lead to widespread negative publicity. If we were required to make such a disclosure, it may cause our clients and customers to lose confidence in the effectiveness of our information security measures. Likewise, general publicity regarding information security breaches at other companies could lead to the perception among the general public that e-commerce is not secure. This could decrease traffic to our websites, negatively affect our financial results and limit future business opportunities.
Interruptions to our website operations or information technology systems, failure to maintain our information technology platforms, or failure to successfully implement our new enterprise resource planning (ERP) system could damage our reputation and harm our business.
The satisfactory performance, reliability and availability of our information technology systems, and those of our third-party service providers, is critical to our reputation and our ability to attract and retain customers. We could experience temporary interruptions in our websites, transaction and payment processing systems, network infrastructure, service technologies, printing production facilities or customer service operations for a variety of reasons, including, among others, human error, software errors or design faults, security breaches, power loss, telecommunications failures, equipment failures, electrical disruptions, labor issues, vandalism, fire, flood, extreme weather, terrorism and other events beyond our control.
We have invested, and will continue to invest, significant resources to build out, maintain and improve our technology platforms and to integrate our various businesses. We are in the process of converting to a new ERP system. Any disruptions, delays or deficiencies in the design, implementation or operation of our systems, particularly any disruptions, delays or deficiencies that impact our operations, including smoothly executing the implementation of our ERP system, could adversely affect our ability to effectively run and manage our business. Frequent or persistent interruptions in our operations could cause customers to believe that our products and services are unreliable, leading them to switch to our competitors or to avoid our products and services.
In recent years, we shifted a substantial portion of our applications to a cloud-based environment. While we maintain redundant systems and backup databases and applications software designed to provide continuous access to cloud services, it is possible that access to our software capabilities could be interrupted and our disaster recovery planning may not account for all eventualities. The failure of our systems could interfere with the delivery of products and services to our customers, impede our customers' ability to do business and result in the loss or corruption of critical data. In addition to the potential loss of customers, we may be required to incur additional development costs and divert technical and other resources, and we may be the subject of negative publicity and/or liability claims.
If any of our significant information technology systems suffer severe damage, disruption or shutdown, and our disaster recovery and business continuity plans do not effectively resolve the issue in a timely manner, our results of operations would be adversely affected, and our business interruption insurance coverage may not be adequate to compensate us fully for any losses we may incur. Moreover, to the extent that any system failure or similar event results in damages to our customers or contractual counterparties, these customers and contractual counterparties could seek compensation from us for their losses, and those claims, even if unsuccessful, would likely be time-consuming and costly for us to address.
We rely on third parties and their systems for a variety of services, including significant information technology services, and the failure of these third parties to provide these services could disrupt our business.
We have entered into agreements with third-party providers for information technology services, including telecommunications, network server, cloud computing and transaction processing services. In addition, we have agreements with companies to provide services related to our online payment solutions, including financial institutions that provide clearing services in connection with our merchant services settlement activities, and we have outsourced certain activities, including portions of our finance and procurement functions. A service provider's ability to provide services could be disrupted for a variety of reasons, including, among others, human error, software errors or design faults, security breaches, power loss, telecommunications failures, equipment failures, electrical disruptions, labor issues, vandalism, fire, flood, extreme weather, terrorism and other events beyond their control. In the event that one or more of our service providers is unable to provide adequate or timely services, our ability to deliver products and services to our customers could be adversely affected. Although we believe we have taken reasonable steps to protect our business through contractual arrangements with our service providers, we cannot completely eliminate the risk of disruption in service. Any significant disruption could harm our business, including damage to our brand and loss of customers. Additionally, although we believe that most of these services are available from numerous sources, a failure to perform by one or more of our service providers could cause a material disruption in our business while we obtain an alternative service provider. The use of substitute third-party providers could also result in increased expense. Additionally, while we have policies and procedures for managing these relationships, they inherently involve a lesser degree of
17
control over business operations, governance and compliance, thereby potentially increasing our financial, legal, reputational and operational risk.
If we are unable to attract, motivate and retain key personnel and other qualified employees, our business and results of operations could be adversely impacted.
We operate in a rapidly changing technological environment that requires a wide ranging set of expertise and intellectual capital. To successfully compete and grow, we must recruit, develop, motivate and retain personnel who can provide the needed expertise across the organization. In addition, we must develop our personnel to fulfill succession plans capable of maintaining continuity in the midst of the inevitable unpredictability of human capital.
Competition for employees is intense, even more so in the current challenging labor market. We have implemented various human capital initiatives, including employee wellness initiatives, the introduction of employee resource groups and a revised performance management process, to make Deluxe an attractive place to work. As a result of the COVID-19 pandemic, remote working arrangements became more widely accepted and it is more challenging for us to maintain and enhance our corporate culture and to navigate the flexible working arrangements that employees may demand. Our work environment may not meet the needs or expectations of our employees or may be perceived as less favorable compared to other companies' polices, which could negatively impact our ability to hire and retain qualified personnel. We can provide no assurance that key personnel, including our executive officers, will continue to be employed, or that in the event we have to replace key employees, that labor costs will not increase. Failure to retain or attract key personnel could have a material adverse effect on our business, financial condition and results of operations.
Increases in prices and declines in the availability of materials and other services have adversely affected, and could continue to adversely affect, our operating results.
We are subject to risks associated with the cost and availability of paper, plastics, ink, promotional materials, merchant services point-of-sale equipment and other raw materials, as well as various third-party services we utilize, including delivery services. In addition, from time-to-time, the card networks, including Visa® and Mastercard®, increase the fees that they charge processors. Increased levels of inflation during the past 2 years have resulted in cost increases for certain of the materials and services we utilize. We expect inflationary pressures to continue into fiscal 2023, and this trend could have a material adverse impact if inflation rates significantly exceed our ability to continue to achieve price increases or if such price increases adversely impact demand for our products. Emerging from the COVID-19 pandemic, we have experienced supply chain disruptions, including impacts on the supply of certain higher margin printed products in our Promotional Solutions segment, and the continuing Russia-Ukraine dispute could cause further disruption in the global supply chain. We continue to closely monitor our supply chain to promptly address any further delays or disruptions, but we can provide no assurance that our ability to provide products to our customers will not be adversely impacted if our supply chain is compromised.
Paper costs represent a significant portion of our materials expense. Paper is a commodity and its price has been subject to volatility due to supply and demand in the marketplace, as well as volatility in the raw material and other costs incurred by paper suppliers. There are also relatively few paper suppliers and these suppliers are under financial pressure as paper use declines. As such, when our suppliers increase paper prices, we may not be able to obtain better pricing from alternative suppliers.
We depend upon third-party providers for delivery services and for certain outsourced products. Events resulting in the inability of these third parties to perform their obligations, such as work slowdowns, extended labor strikes, labor shortages or inclement weather, could adversely impact our results of operations by requiring us to secure alternate providers at higher costs. Postal rates are dependent on the operating efficiency of the U.S. Postal Service (USPS) and on legislative mandates imposed upon the USPS. Postal rates have increased in recent years and the USPS has incurred significant financial losses. This may result in continued changes to the breadth and/or frequency of USPS mail delivery services. In addition, fuel costs have fluctuated over the past several years. Increases in fuel costs increase the costs we incur to deliver products to our customers, as well as the price we pay for outsourced products.
Competitive pressures and/or contractual arrangements may inhibit our ability to reflect increased costs in the price of our products and services. Any of the foregoing risks could result in harm to our business and results of operations.
We are subject to customer payment-related risks and payment card network rules, which could adversely affect our business and financial results.
We may be liable for fraudulent transactions conducted on our websites, such as the use of stolen credit card numbers, and we have potential liability for fraudulent electronic payment transactions or credits initiated by merchants or others. While we do have safeguards in place, we cannot prevent all fraudulent transactions. To date, we have not incurred significant losses from payment-related fraud. However, such transactions negatively impact our results of operations and could subject us to penalties from payment card networks for inadequate fraud protection.
18
In addition, changes to the payment card networks' rules or how they are interpreted could have a significant impact on our business and financial results. For example, changes in the rules regarding chargebacks may affect our ability to dispute chargebacks and the amount of losses we incur from chargebacks. Changes in network rules may also increase the cost of, impose restrictions on, or otherwise impact the development of, our retail point-of-sale solutions, which may negatively affect their deployment and adoption. Any changes to or interpretations of the network rules that are inconsistent with the way we currently operate may require us to make changes to our business that could be costly or difficult to implement and that could adversely affect our results of operations.
Revenue from the sale of services to merchants that accept Visa and Mastercard are dependent upon our continued Visa and Mastercard registrations, financial institution sponsorship and, in some cases, continued membership in certain card networks.
In order to provide our Visa and Mastercard transaction processing services, we must be either a direct member or be registered as a merchant processor or service provider of Visa and Mastercard. Registration as a merchant processor or service provider is dependent upon our being sponsored by members of each organization in certain jurisdictions. If our sponsor financial institution in any market should stop providing sponsorship for us, we would need to find another financial institution to provide those services or we would need to attain direct membership with the card networks, either of which could prove to be difficult and expensive. If we are unable to find a replacement financial institution to provide sponsorship or attain direct membership, we may no longer be able to provide processing services to affected customers, which would negatively affect our business and results of operations. In addition, some agreements with our financial institution sponsors give them substantial discretion in approving certain aspects of our business practices, including our solicitation, application and qualification procedures for merchants and the terms of our agreements with merchants. Our sponsors' discretionary actions under these agreements could have a material adverse effect on our business and results of operations.
If we fail to comply with the applicable requirements of the card networks, the card networks could seek to fine us, suspend us or terminate our registrations or membership. The termination of our registrations or our membership or our status as a service provider or a merchant processor would have a material adverse effect on our business, financial condition and results of operations. If a merchant or an independent sales organization (ISO) customer fails to comply with the applicable requirements of the card associations and networks, we or the merchant or ISO could be subject to a variety of fines or penalties that may be levied by the card associations or networks. If we cannot collect or pursue collection of such amounts from the applicable merchant or ISO, we may have to bear the cost of such fines or penalties, negatively impacting our results of operations.
| LEGAL AND COMPLIANCE RISKS | ||
Governmental regulation is continuously evolving and could limit or harm our business.
We are subject to numerous international, federal, state and local laws and regulations that affect our business activities in several areas, including, but not limited to, labor, advertising, taxation, data privacy and security, digital content, consumer reports, consumer protection, merchant processing, online payment services, real estate, e-commerce, intellectual property, health care, environmental matters, and workplace health and safety. In addition, legal or regulatory measures to address climate change may impact us in the near future. The complexity of complying with existing and new laws and regulations is significant, and regulators may adopt new laws or regulations at any time.
The various regulatory requirements to which we are subject could impose significant limitations on our business activities, require changes to our business, restrict our use or storage of personal information, or cause changes in our customers' purchasing behavior, which may make our business more costly and/or less efficient and may require us to modify our current or future products, services, systems or processes. We cannot quantify or predict with any certainty the likely impact of such changes on our business, prospects, financial condition or results of operations.
Portions of our business operate within highly regulated industries and our business results could be significantly affected by the laws and regulations to which we are subject. For example, international, federal and state laws and regulations regarding the protection of certain consumer information require us to develop, implement and maintain policies and procedures to protect the security and confidentiality of consumers' personal information. Portions of our business are subject to regulations affecting payment processing, including merchant processing, ACH, remote deposit capture and lockbox services. These laws and regulations require us to develop, implement, and maintain certain policies and procedures related to payments. We are also subject to additional requirements in certain of our contracts with financial institution clients and communications service providers, which are often more restrictive than the regulations, as well as confidentiality clauses in certain of our contracts related to small businesses’ customer information. These regulations and agreements typically limit our ability to use or disclose personal information for other than the purposes originally intended, which could limit business opportunities. Proposed privacy and cybersecurity regulations may also increase the cost of compliance for the protection of collected data. The complexity of compliance with these various regulations may increase our cost of doing business and may affect our clients, reducing their discretionary spending and thus, reducing their capacity to purchase our products and services.
19
Due to our increased use of the internet for sales and marketing, laws specifically governing digital commerce, the internet, mobile applications, search engine optimization, behavioral advertising, privacy and email marketing may have an impact on our business. Existing and future laws governing issues such as digital and social marketing, privacy, consumer protection or commercial email may limit our ability to market and provide our products and services. Changing data protection regulations may increase the cost of compliance in servicing domestic and international markets for our wholesale and retail business services channels. More restrictive rules, such as new privacy laws, consumer protection “dark patterns” restrictions, search engine marketing restrictions, “anti-spam” regulations or email privacy rules, could decrease marketing opportunities, decrease traffic to our websites and/or increase the cost of obtaining new customers.
Because of additional regulatory costs, financial institutions may continue to put significant pricing pressure on their suppliers, including their check and service providers. The increase in cost and profit pressure may also lead to further consolidation of financial institutions. Additionally, some financial institutions do not permit offers of add-on services, such as bundled products, fraud/identity protection or expedited check delivery, to their customers. It would have an adverse impact on our results of operations if we were unable to market such services to consumers or small businesses through the majority of our financial institution clients. Additionally, as our product and service offerings become more technologically focused, and with expanded regulatory expectations for supervision of third-party service providers, additional portions of our business could become subject to direct federal regulation and/or examination. This would increase our cost of doing business and could slow our ability to introduce new products and services and otherwise adapt to a rapidly changing business environment.
Third-party claims could result in costly and distracting litigation and, in the event of an unfavorable outcome, could have an adverse effect on our business, financial condition and results of operations.
From time to time, we are involved in claims, litigation and other proceedings related to the conduct of our business, including purported class action litigation. Such legal proceedings may include claims related to our employment practices; claims alleging breach of contractual obligations; claims asserting deceptive, unfair or illegal business practices; claims alleging violations of consumer protection-oriented laws; claims related to legacy distributor account protection rights; or claims related to environmental matters. In addition, third parties may assert patent and other intellectual property infringement claims against us and/or our clients, which could include aggressive and opportunistic enforcement of patents by non-practicing entities. Any such claims could result in litigation against us and could also result in proceedings being brought against us by various federal and state agencies that regulate our businesses. The number and significance of these claims and proceedings has increased as our businesses have evolved and expanded in scope. These claims, whether successful or not, could divert management's attention, result in costly and time-consuming litigation, or both. Accruals for identified claims or lawsuits are established based on our best estimates of the probable liability. However, we cannot accurately predict the ultimate outcome of any such proceedings due to the inherent uncertainties of litigation and other dispute resolution mechanisms. Any unfavorable outcome of a material claim or material litigation could require the payment of monetary damages or fines, attorneys' fees or costly and undesirable changes to our products, features or business practices, which would result in a material adverse effect on our business, financial condition and results of operations.
We may be unable to protect our rights in intellectual property, which could harm our business and ability to compete.
We rely on a combination of trademark and copyright laws, trade secret and patent protection, and confidentiality and license agreements to protect our trademarks, software and other intellectual property. These protective measures afford only limited protection. Despite our efforts to protect our intellectual property, third parties may infringe or misappropriate our intellectual property or otherwise independently develop substantially equivalent products or services that do not infringe on our intellectual property rights. Policing unauthorized use of our intellectual property is difficult. We may be required to spend significant resources to protect our trade secrets and to monitor and police our intellectual property rights. The loss of intellectual property protection or the inability to secure or enforce intellectual property protection could harm our business and ability to compete.
Activities of our customers or the content of their websites could damage our reputation and/or adversely affect our financial results.
As a provider of domain name registration, web hosting services and customized business products, we may be subject to potential liability for the activities of our customers on or in connection with their domain names or websites, for the data they store on our servers, including information accessible through the "dark web," or for images or content that we produce on their behalf. Customers may also launch distributed denial of service attacks or malicious executables, such as viruses, worms or trojan horses, from our servers. Although our agreements with our customers prohibit illegal use of our products and services and permit us to take appropriate action for such use, customers may nonetheless engage in prohibited activities or upload or store content with us in violation of applicable law. Our reputation may be negatively impacted by the actions of customers that are deemed to be hostile, offensive or inappropriate, or that infringe the copyright or trademark of another party. The safeguards we have established may not be sufficient to avoid harm to our reputation, especially if the inappropriate activities are high profile.
Laws relating to the liability of online services companies for information, such as online content disseminated through their services, are subject to frequent challenges. Claims may be made against online services companies by parties who
20
disagree with the content. Where the online content is accessed on the internet outside of the U.S., challenges may be brought under foreign laws that do not provide the same protections for online services companies as in the U.S. These challenges in either U.S. or foreign jurisdictions may give rise to legal claims alleging defamation, libel, invasion of privacy, negligence or copyright or trademark infringement, based on the nature and content of the materials disseminated through our services. Certain of our products and services include content generated by users of our online services. Although this content is not generated by us, claims of defamation or other injury may be made against us for that content. If such claims are successful, our financial results would be adversely affected. Even if the claims do not result in litigation or are resolved in our favor, the time and resources necessary to resolve them could divert management’s attention and adversely affect our business and financial results.
| FINANCIAL RISKS | ||
Economic conditions may adversely affect trends in business and consumer spending, which may adversely impact demand for our products and services.
Economic conditions have affected, and will continue to affect, our results of operations and financial position. Current and future economic conditions that affect inflation, business and consumer spending, including levels of business and consumer confidence, unemployment levels, consumer spending and the availability of credit, as well as uncertainty or volatility in our customers' businesses, may adversely affect our business and results of operations. A challenging economic environment could cause existing and potential customers to not purchase or to delay purchasing our products and services. Continued inflationary pressures could negatively impact our customers' ability to purchase our products and services, thereby negatively impacting our revenue and results of operations.
A significant portion of our business relies on small business spending. We believe that small businesses are more likely to be significantly affected by economic conditions than larger, more established companies. During a sluggish economy, it may be more difficult for small businesses to obtain credit and they may choose to spend their limited funds on items other than our products and services. As such, the level of small business confidence, the rate of small business formations and closures, and the availability of credit to small businesses all impact our business.
A significant portion of our business also relies upon the health of the financial services industry. As a result of global economic conditions in past years, a number of financial institutions sought additional capital, merged with other financial institutions and, in some cases, failed. The failure of one or more of our larger financial institution clients, or large portions of our customer base, could adversely affect our operating results. In addition to the possibility of losing a significant client, the inability to recover prepaid product discount payments made to one or more of our larger financial institution clients, or the inability to collect accounts receivable or contractually required contract termination payments, could have a significant negative impact on our results of operations.
There may also be an increase in financial institution mergers and acquisitions during periods of economic uncertainty or as a result of other factors affecting the financial services industry. Such an increase could adversely affect our operating results. Often the newly combined entity seeks to reduce costs by leveraging economies of scale in purchasing, including its check supply and business services contracts. This results in providers competing intensely on price in order to retain not only their previous business with one of the financial institutions, but also to gain the business of the other party in the combined entity. Although we devote considerable effort toward the development of a competitively-priced, high-quality selection of products and services for the financial services industry, there can be no assurance that significant financial institution clients will be retained or that the impact of the loss of a significant client can be offset through the addition of new clients or by expanded sales to our remaining clients.
Global events, such as the COVID-19 pandemic and the actions taken in response to it, as well as the Russia-Ukraine dispute, significantly increase economic uncertainty. Given the ongoing and dynamic nature of these events, we cannot predict the impact on our business, financial position or results of operations. Even after such impacts subside, the U.S. economy may experience a recession, and our business could be adversely affected by a prolonged recession.
Asset impairment charges would have a negative impact on our results of operations.
Goodwill represented 46.5% of our total assets as of December 31, 2022. On at least an annual basis, we assess whether the carrying value of goodwill is impaired. This analysis considers several factors, including economic, market and industry conditions. Circumstances that could indicate a decline in the fair value of one or more of our reporting units include, but are not limited to, the following:
•a downturn in economic conditions that negatively affects our actual and forecasted operating results;
•changes in our business strategy, structure and/or the allocation of resources;
•the failure of our growth strategy;
•the inability of our acquisitions to achieve expected operating results;
•changes in market conditions, including increased competition;
21
•the loss of significant customers;
•a decline in our stock price for a sustained period; or
•a material acceleration of order volume declines for checks and business forms.
Such situations may require us to record an impairment charge for a portion of goodwill. We are also required to assess the carrying value of other long-lived assets, including intangible assets. Information regarding our 2022 impairment analyses can be found under the caption "Note 8: Fair Value Measurements" in the Notes to Consolidated Financial Statements appearing in Part II, Item 8 of this report. We have, in the past, and may again in the future, be required to write-down the value of some of our assets, and these write-downs have been, and could in the future be, material to our results of operations. If we are required to record additional asset impairment charges for any reason, our consolidated results of operations would be adversely affected.
Our variable-rate indebtedness exposes us to interest rate risk.
Borrowings under our credit facility, including our secured term loan facility, are subject to variable rates of interest and expose us to interest rate risk. If interest rates were to continue to increase, our interest expense would increase, negatively affecting earnings and reducing cash flows available for working capital, capital expenditures and other investments. To address the risk associated with variable-rate debt, we entered into interest rate swaps to convert $500.0 million of our variable-rate debt to a fixed rate. As of December 31, 2022, $684.4 million of our outstanding debt was subject to variable interest rates.
| ITEM 1B. UNRESOLVED STAFF COMMENTS | ||
None.
| ITEM 2. PROPERTIES | ||
As of December 31, 2022, we occupied 46 facilities throughout the U.S., 5 facilities in Canada and 2 facilities in Europe, where we conduct printing and fulfillment, payment processing, call center, data center and administrative functions. Because of our shared services approach to most of our business functions, many of our facilities are utilized for the benefit of more than one of our business segments. Approximately 20% of our facilities are owned, while the remaining 80% are leased. Our facilities have a combined floor space of approximately 2 million square feet. None of our owned properties are mortgaged or held subject to any significant encumbrance. We believe that existing leases will be renegotiated as they expire or that suitable alternative properties will be leased on acceptable terms. We also believe that our properties are sufficiently maintained and are adequate and suitable for our business needs as presently conducted. We closed 6 facilities during 2022, as we continued to assess our real estate footprint.
| ITEM 3. LEGAL PROCEEDINGS | ||
We record provisions with respect to identified claims or lawsuits when it is probable that a liability has been incurred and the amount of the loss can be reasonably estimated. Claims and lawsuits are reviewed quarterly and provisions are taken or adjusted to reflect the status of a particular matter. We believe the recorded reserves in our consolidated financial statements are adequate in light of the probable and estimable outcomes. Recorded liabilities were not material to our financial position, results of operations or liquidity, and we do not believe that any of the currently identified claims or litigation will materially affect our financial position, results of operations or liquidity upon resolution. However, litigation is subject to inherent uncertainties, and unfavorable rulings could occur. If an unfavorable ruling were to occur, it may cause a material adverse impact on our financial position, results of operations or liquidity in the period in which the ruling occurs or in future periods.
| ITEM 4. MINE SAFETY DISCLOSURES | ||
Not applicable.
22
PART II
| ITEM 5. MARKET FOR REGISTRANT'S COMMON EQUITY, RELATED STOCKHOLDER MATTERS AND ISSUER PURCHASES OF EQUITY SECURITIES | ||
Our common stock is traded on the New York Stock Exchange under the symbol DLX. Dividends are declared by our board of directors on a quarterly basis, and therefore, are subject to change. As of December 31, 2022, the number of shareholders of record was 5,073, excluding shareholders whose shares are held in the name of various dealers, clearing agencies, banks, brokers and other fiduciaries.
The following table shows purchases of our common stock that were completed during the fourth quarter of 2022:
| Period |
Total number of shares purchased(1)
|
Average price paid per share(1)
|
Total number of shares purchased as part of publicly announced plans or programs |
Maximum number (or approximate dollar value) of shares that may yet be purchased under the plans or programs(2)
|
||||||||||||||||||||||
|
October 1, 2022 –
October 31, 2022
|
371 | $ | 16.91 | — | 287,452,394 | |||||||||||||||||||||
| November 1, 2022 – November 30, 2022 |
7,957 | 19.41 | — | 287,452,394 | ||||||||||||||||||||||
| December 1, 2022 – December 31, 2022 |
192 | 16.52 | — | 287,452,394 | ||||||||||||||||||||||
| Total | 8,520 | 19.24 | — | 287,452,394 | ||||||||||||||||||||||
(1) Under the terms of our 2022 Stock Incentive Plan, as well as our previous long-term incentive plans, participants may surrender shares that would otherwise be issued under equity-based awards to cover the withholding taxes due as a result of the exercise or vesting of such awards. During the fourth quarter of 2022, we withheld 8,520 shares in conjunction with the vesting and exercise of equity-based awards.
(2) In October 2018, our board of directors authorized the repurchase of up to $500.0 million of our common stock. This authorization has no expiration date. No shares were repurchased under this authorization during the fourth quarter of 2022 and $287.5 million remained available for repurchase as of December 31, 2022.
23
The table below compares the cumulative total shareholder return on our common stock for the last five fiscal years with the cumulative total return of the S&P MidCap 400 Index and the Dow Jones U.S. Support Services (DJUSIS) Index.
| COMPARISON OF FIVE-YEAR CUMULATIVE TOTAL RETURN | ||
| ASSUMES INITIAL INVESTMENT OF $100 | ||
| DECEMBER 2022 | ||
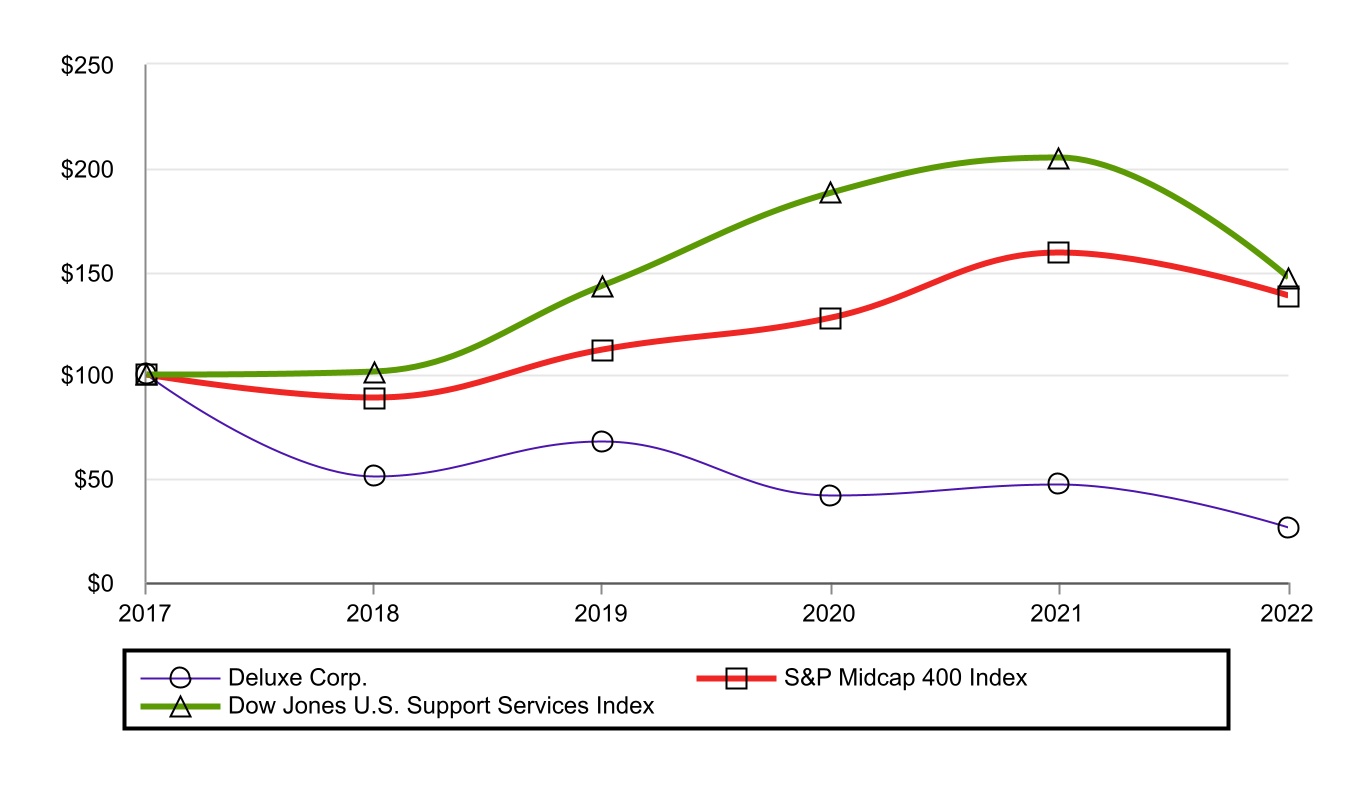
The graph assumes that $100 was invested on December 31, 2017 in each of Deluxe common stock, the S&P MidCap 400 Index and the DJUSIS Index, and that all dividends were reinvested.
Prepared by: Zack's Investment Research, Inc. Used with permission. All rights reserved. Copyright 1980-2023.
Index Data: Copyright Standard and Poor's, Inc. Used with permission. All rights reserved.
Index Data: Copyright Dow Jones, Inc. Used with permission. All rights reserved.
| ITEM 6. [RESERVED] | ||
ITEM 7. MANAGEMENT'S DISCUSSION AND ANALYSIS OF FINANCIAL CONDITION AND RESULTS OF OPERATIONS
| ||
Management's Discussion and Analysis of Financial Condition and Results of Operations (MD&A) includes the following sections:
•Executive Overview that discusses what we do, our operating results at a high level and our financial outlook for the upcoming year;
•Consolidated Results of Operations; Restructuring and Integration Costs; and Segment Results that includes a more detailed discussion of our revenue and expenses;
•Cash Flows and Liquidity, Capital Resources and Other Financial Position Information that discusses key aspects of our cash flows, financial commitments, capital structure and financial position; and
•Critical Accounting Estimates that discusses the estimates that involve a significant level of uncertainty and have had or are reasonably likely to have a material impact on our financial condition or results of operations.
Please note that this MD&A discussion contains forward-looking statements that involve risks and uncertainties. Part I, Item 1A of this report outlines known material risks and important information to consider when evaluating our forward-looking statements. The Private Securities Litigation Reform Act of 1995 (the "Reform Act") provides a “safe harbor” for forward-looking
24
statements to encourage companies to provide prospective information. When we use the words or phrases “should result,” “believe,” “intend,” “plan,” “are expected to,” “targeted,” “will continue,” “will approximate,” “is anticipated,” “estimate,” “project,” “outlook,” "forecast" or similar expressions in this Annual Report on Form 10-K, in future filings with the Securities and Exchange Commission, in our press releases, investor presentations and in oral statements made by our representatives, they indicate forward-looking statements within the meaning of the Reform Act.
This MD&A includes financial information prepared in accordance with accounting principles generally accepted in the U.S. ("GAAP"). In addition, we discuss free cash flow, net debt, liquidity, adjusted diluted earnings per share ("EPS"), consolidated adjusted earnings before interest, taxes, depreciation and amortization ("adjusted EBITDA") and consolidated adjusted EBITDA margin, all of which are non-GAAP financial measures. We believe that these non-GAAP financial measures, when reviewed in conjunction with GAAP financial measures, can provide useful information to assist investors in analyzing our current period operating performance and in assessing our future operating performance. For this reason, our internal management reporting also includes these financial measures, which should be considered in addition to, and not as superior to or as a substitute for, GAAP financial measures. We strongly encourage investors and shareholders to review our financial statements and publicly-filed reports in their entirety and not to rely on any single financial measure. Our non-GAAP financial measures may not be comparable to similarly titled measures used by other companies and therefore, may not result in useful comparisons. The reconciliation of our non-GAAP financial measures to the most directly comparable GAAP financial measures can be found in Consolidated Results of Operations.
The following discussion and analysis provides information we believe to be relevant to understanding our financial condition and results of operations. This discussion focuses on our financial results for the years ended December 31, 2022 and December 31, 2021. A discussion of our results of operations for the year ended December 31, 2021, as compared to the year ended December 31, 2020, is included in Part II, Item 7 of our Annual Report on Form 10-K for the year ended December 31, 2021 ("the 2021 Form 10-K"), filed with the SEC on February 28, 2022, and is incorporated by reference into this Form 10-K. You should read the following discussion and analysis in conjunction with our consolidated financial statements and related notes presented in Part II, Item 8 of this report.
| EXECUTIVE OVERVIEW | ||
We help businesses deepen customer relationships through trusted, technology-enabled solutions that help businesses pay and get paid, accelerate growth and operate more efficiently. Our solutions include merchant services, marketing services and data analytics, treasury management solutions, promotional products, and fraud and payroll solutions, as well as customized checks and business forms. We support millions of small businesses, thousands of financial institutions and hundreds of the world’s largest consumer brands, while processing approximately $3 trillion in annual payment volume. Our reach, scale and distribution channels position us to be a trusted business partner for our customers.
Acquisition – On June 1, 2021, we acquired all of the equity of First American Payment Systems, L.P. ("First American") in a cash transaction for $958.5 million, net of cash, cash equivalents, restricted cash and restricted cash equivalents acquired. First American is a large-scale payments technology company that provides partners and merchants with comprehensive in-store, online and mobile payment solutions. The results of First American are included in our Payments segment and contributed incremental revenue of $144.2 million and incremental adjusted EBITDA of $30.2 million in 2022. The acquisition was funded with cash on hand and proceeds from new debt. Further information regarding the acquisition can be found under the caption "Note 6: Acquisition and Divestitures" and further information regarding our debt can be found under the caption "Note 13: Debt," both of which appear in the Notes to Consolidated Financial Statements appearing in Part II, Item 8 of this report.
Recent market conditions – The impact of the global coronavirus ("COVID-19") pandemic on our business and results of operations for the years ended December 31, 2021 and 2020 can be found in the Executive Overview section appearing in Part II, Item 7 of the 2021 Form 10-K. The environment surrounding COVID-19 and any countermeasures taken to reduce its spread may impact our future performance and remains difficult to predict.
During 2021, we began experiencing increased inflationary pressures on our labor, delivery and material costs. In response to the inflationary environment, we began implementing targeted price increases in all of our segments in late 2021. Despite the price changes, we continued to experience strong revenue volumes throughout 2022, demonstrating the strength of our business and the continued strong demand for our products. During the first half of 2022, we began experiencing some supply disruptions impacting certain higher margin printed products in our Promotional Solutions segment. We continue to closely monitor our supply chain to promptly address any further delays or disruptions, and we did see some improvement in the second half of 2022. We have also been experiencing labor supply issues in certain portions of our business. It remains difficult to estimate the severity and duration of the current inflationary environment or supply chain and labor issues on our business, financial position or results of operations.
In 2022, our interest expense began increasing as a result of the rising interest rate environment. We executed an interest rate swap during the third quarter of 2022 to effectively convert an additional $300.0 million of our variable-rate debt to a fixed rate. As of December 31, 2022, 59% of our debt was effectively fixed rate, which will partially insulate us from future interest rate increases.
25
Cash flows and liquidity – Cash provided by operating activities for 2022 decreased $19.3 million as compared to 2021. The decrease reflects a $40.5 million increase in interest payments as a result of rising interest rates in 2022 and debt issued to complete the First American acquisition in 2021, as well as a $22.8 million increase in employee cash bonus payments related to our 2021 operating performance. During 2021, a portion of our cash bonuses was paid in the form of restricted stock units and the bonus payments in 2021 were unusually low because of the impact of the COVID-19 pandemic on our 2020 performance. Operating cash flow was also negatively impacted by a $19.9 million increase in income tax payments, as well as inflationary pressures, supply chain disruptions in our Promotional Solutions segment, and the continuing secular decline in checks, business forms and some business accessories. The increase in income tax payments was primarily driven by the provisions of the Tax Cuts and Jobs Act of 2017 that became effective in 2022 and that require the capitalization of research and development and cloud computing arrangement expenditures for income tax purposes. We were able to substantially offset these decreases in operating cash flow through the incremental contribution of the First American acquisition, price increases in response to the current inflationary environment, continued cost saving actions, a $22.9 million decrease in payments for cloud computing arrangements, primarily related to our sales and finance technology infrastructure, and revenue growth from new business and strong demand for our products. In addition, we incurred acquisition transaction costs of $18.9 million in 2021 related to the First American acquisition that did not recur in 2022. Free cash flow decreased $14.7 million for 2022, as compared to 2021. Total debt was $1.64 billion and net debt was $1.60 billion as of December 31, 2022. During the third quarter of 2022, we retired $25.0 million of our $500.0 million senior, unsecured notes, realizing a pretax gain of $1.7 million. We held cash and cash equivalents of $40.4 million as of December 31, 2022, and liquidity was $335.6 million. Our capital allocation priorities are to responsibly invest in growth, pay our dividend, reduce debt and return value to our shareholders.
2022 results vs. 2021 – Multiple factors drove the increase in net income for 2022, as compared to 2021, including:
•price increases in response to the current inflationary environment;
•actions taken to reduce costs as we continually evaluate our cost structure, including workforce adjustments, real estate rationalization and marketing optimization;
•pretax gains of $19.3 million from the sale of businesses and a facility during 2022;
•acquisition transaction costs of $18.9 million in 2021 related to the First American acquisition that did not recur in 2022; and
•revenue growth from new business in all of our segments and strong ongoing demand for our products, reflecting the continued success of our One Deluxe strategy.
Partially offsetting these increases in net income were the following factors:
•a $38.9 million increase in interest expense resulting from the effect of increasing interest rates on our variable-rate debt and the additional debt issued in June 2021 to complete the First American acquisition;
•increased transformational investments, primarily costs related to our technology infrastructure;
•inflationary pressures on hourly wages, materials and delivery and supply chain disruptions within the Promotional Solutions segment that impacted certain of our higher margin printed products during the first half of 2022;
•the continuing secular decline in checks, business forms and some Promotional Solutions business accessories; and
•a $7.7 million increase in acquisition amortization, driven, in part, by the First American acquisition.
Diluted EPS of $1.50 for 2022, as compared to $1.45 for 2021, reflects the increase in net income as described in the preceding paragraphs. Adjusted diluted EPS for 2022 was $4.08 compared to $4.88 for 2021, and excludes the impact of non-cash items or items that we believe are not indicative of our current period operating performance. The decrease in adjusted diluted EPS was driven by the increase in interest expense resulting from the effect of increasing interest rates on our variable-rate debt and the debt issued in June 2021 to complete the First American acquisition, increased transformational investments, inflationary pressures on our cost structure, Promotional Solutions supply chain disruptions and the continuing secular decline in checks, business forms and some business accessories. These decreases in adjusted EPS were partially offset by price increases in response to the current inflationary environment and the contribution from First American, as adjusted EPS excludes the associated acquisition amortization. In addition, adjusted diluted EPS benefited from various cost saving actions across
26
functional areas, as well as revenue growth from new business in all of our segments and strong ongoing demand for our products. A reconciliation of diluted EPS to adjusted diluted EPS can be found in Consolidated Results of Operations.
"One Deluxe" Strategy
As a result of our transformational strategy, we have realized the benefit of significant new client wins in all of our segments, and in 2022, we generated consolidated sales-driven revenue growth for the second consecutive year. We also completed the acquisition of First American in June 2021. The acquisition enables us to expand significantly in the fast-growing payments sector, a sector known for generating significant recurring revenues and cash flows, and revenue from our growing Payments segment is expected to surpass that of our Checks segment during the first half of 2023. We now have an even stronger foundation from which to pursue future acquisitions that will allow us to potentially realize significant revenue synergies, and we believe that our scaled back-end processing will readily support incremental volume. Further information regarding our strategy can be found in Part I, Item 1 of this report.
Divestitures – In May 2022, we completed the sale of our Australian web hosting business for cash proceeds of $17.6 million, net of costs of the sale. This business generated annual revenue in our Data Solutions segment of $23.8 million during 2021, and we recognized a pretax gain of $15.2 million on this sale during the second quarter of 2022. The assets and liabilities sold were not significant to our consolidated balance sheet.
In April 2022, we sold the assets of our Promotional Solutions strategic sourcing business and in August 2022, we sold the assets of our Promotional Solutions retail packaging business. These businesses generated annual revenue of approximately $29 million during 2021. Neither the gain on these sales, nor the assets and liabilities sold, were significant to our consolidated financial statements.
In January 2023, we entered into an agreement for the sale of our North American web hosting and logo businesses for an aggregate sales price of $42.0 million, plus up to $10.0 million of additional proceeds contingent upon performance against certain conditions following the closing. We anticipate that the sale will close by March 31, 2023 and that we will recognize a gain on the sale. In conjunction with this anticipated sale, we changed the name of our Cloud Solutions segment to Data Solutions. These businesses generated annual revenue of approximately $66 million during 2022, primarily in our Data Solutions segment.
We believe that the sale of these businesses allows us to focus our resources on the key growth areas of payments and data, while allowing us to optimize our operations.
Outlook for 2023
We expect that revenue for 2023 will be between $2.145 billion and $2.210 billion, as compared to 2022 revenue of $2.238 billion. The 2022 amount included revenue of approximately $69 million that will not recur in 2023 due to our divestitures. We expect that adjusted EBITDA for 2023 will be between $390 million and $405 million, as compared to $418 million for 2022. The 2022 amount included adjusted EBITDA of approximately $21 million that will not recur in 2023 due to our divestitures. These estimates are subject to, among other things, completion of the sale of the remaining web hosting and logo design businesses by March 31, 2023, prevailing macroeconomic conditions, labor supply issues, inflation and the impact of other divestitures.
As of December 31, 2022, we held cash and cash equivalents of $40.4 million and $295.2 million was available for borrowing under our revolving credit facility. We anticipate that capital expenditures will be approximately $100 million in 2023, as compared to $104.6 million for 2022, as we continue with important innovation investments and building scale across our product categories. We also expect that we will continue to pay our regular quarterly dividend. However, dividends are approved by our board of directors each quarter and thus, are subject to change. We anticipate that net cash generated by operations, along with cash and cash equivalents on hand and availability under our credit facility, will be sufficient to support our operations, including our contractual obligations and debt service requirements, for the next 12 months, as well as our long-term capital requirements. We were in compliance with our debt covenants as of December 31, 2022, and we anticipate that we will remain in compliance with our debt covenants throughout 2023.
| CONSOLIDATED RESULTS OF OPERATIONS | ||
Consolidated Revenue
| (in thousands) | 2022 | 2021 | Change | |||||||||||||||||
| Total revenue | $ | 2,238,010 | $ | 2,022,197 | 10.7% | |||||||||||||||
The increase in total revenue for 2022, as compared to 2021, was driven primarily by revenue growth from new business in all of our segments and strong ongoing demand for our products, reflecting the success of our One Deluxe strategy. Price increases in response to the current inflationary environment also contributed to the revenue increase, primarily in our Checks and Promotional Solutions segments. The revenue increase also reflected the acquisition and strong performance of First
27
American, which contributed incremental revenue of $144.2 million in 2022. Partially offsetting these increases in revenue was the continuing secular decline in order volume for checks, business forms and some Promotional Solutions business accessories, as well as the divestitures discussed in Executive Overview, which resulted in a decrease in revenue of approximately $32 million for 2022, as compared to 2021.
We do not manage our business based on product versus service revenue. Instead, we analyze our revenue based on the product and service offerings shown under the caption "Note 17: Business Segment Information" in the Notes to Consolidated Financial Statements appearing in Part II, Item 8 of this report. Our revenue mix by business segment was as follows:
| 2022 | 2021 | |||||||||||||
| Payments | 30.3 | % | 25.2 | % | ||||||||||
| Data Solutions | 11.9 | % | 13.0 | % | ||||||||||
| Promotional Solutions | 25.2 | % | 27.0 | % | ||||||||||
| Checks | 32.6 | % | 34.8 | % | ||||||||||
Total revenue |
100.0 | % | 100.0 | % | ||||||||||
Consolidated Cost of Revenue
| (in thousands) | 2022 | 2021 | Change | |||||||||||||||||
| Total cost of revenue | $ | 1,032,116 | $ | 884,270 | 16.7% | |||||||||||||||
| Total cost of revenue as a percentage of total revenue | 46.1 | % | 43.7 | % | 2.4 pt. | |||||||||||||||
Cost of revenue consists primarily of raw materials used to manufacture our products, shipping and handling costs, third-party costs for outsourced products and services, payroll and related expenses, information technology costs, depreciation and amortization of assets used in the production process and in support of digital service offerings, and related overhead.
The increase in total cost of revenue for 2022, as compared to 2021, was primarily attributable to the revenue growth noted above, and we experienced some inflationary pressures on hourly wages, materials and delivery. The increase in total cost of revenue also reflected incremental costs resulting from the First American acquisition of $88.7 million, including acquisition amortization. Partially offsetting these increases in total cost of revenue was reduced revenue volume from the continuing secular decline in checks, business forms and some Promotional Solutions business accessories, and Promotional Solutions was impacted by supply chain disruptions for certain higher margin printed products in the first half of 2022.
Consolidated Selling, General & Administrative (SG&A) Expense
| (in thousands) | 2022 | 2021 | Change | |||||||||||||||||
| SG&A expense | $ | 993,250 | $ | 941,023 | 5.6% | |||||||||||||||
| SG&A expense as a percentage of total revenue | 44.4 | % | 46.5 | % | (2.1) pt. | |||||||||||||||
The increase in SG&A expense for 2022, as compared to 2021, was driven, in part, by increased costs related to our continued transformational investments, primarily investments in our technology infrastructure, including sales and financial management tools, and commission expense increased, primarily as a result of increased volume from new clients in our Checks segment. The increase in SG&A expense also reflected the incremental operating costs of First American of $30.6 million. The First American acquisition also drove an increase in acquisition amortization of $10.2 million for 2022, as compared to 2021, and bad debt expense increased $6.3 million for 2022, driven by reserve reversals in 2021 as the impact of the COVID-19 pandemic lessened. Partially offsetting these increases in SG&A expense were various cost reduction actions, including workforce adjustments, real estate rationalization and marketing optimization, and during 2021, we incurred acquisition transaction costs of $18.9 million that did not recur in 2022.
Restructuring and Integration Expense
| (in thousands) | 2022 | 2021 | Change | |||||||||||||||||
| Restructuring and integration expense | $ | 62,529 | $ | 54,750 | $ | 7,779 | ||||||||||||||
We continue to pursue several initiatives designed to focus our business behind our growth strategy, to increase our efficiency and to integrate acquired businesses. The amount of restructuring and integration expense is expected to vary from period to period as we execute these initiatives. Further information regarding these costs can be found in Restructuring and Integration Costs in this MD&A discussion.
28
Gain on Sale of Businesses and Facility
| (in thousands) | 2022 | 2021 | Change | |||||||||||||||||
| Gain on sale of businesses and facility | $ | 19,331 | $ | — | $ | 19,331 | ||||||||||||||
As discussed in Executive Overview, during the third quarter of 2022, we sold the assets of our Promotional Solutions retail packaging business, and during the second quarter of 2022, we completed the sale of our Australian web hosting business, our Promotional Solutions strategic sourcing business and a former facility. Net cash proceeds from these sales were $25.2 million during 2022.
Interest Expense
| (in thousands) | 2022 | 2021 | Change | |||||||||||||||||
| Interest expense | $ | 94,454 | $ | 55,554 | 70.0% | |||||||||||||||
| Weighted-average debt outstanding | 1,682,676 | 1,402,970 | 19.9% | |||||||||||||||||
| Weighted-average interest rate | 5.19 | % | 3.60 | % | 1.59 pt. | |||||||||||||||
The increase in interest expense for 2022, as compared to 2021, was due primarily to the increase in our weighted-average interest rate driven by the rising interest rate environment and the $500.0 million notes we issued in June 2021 to fund the First American acquisition with an interest rate of 8.0%. Based on the daily average amount of variable-rate debt outstanding during 2022, a one percentage point change in the weighted-average interest rate would have resulted in a $9.1 million change in interest expense. Also negatively impacting interest expense for 2022 was the increase in our weighted-average debt outstanding driven by the issuance of debt to fund the First American acquisition in June 2021. Further information regarding our debt can be found under the caption "Note 13: Debt" in the Notes to Consolidated Financial Statements appearing in Part II, Item 8 of this report.
Income Tax Provision
| (in thousands) | 2022 | 2021 | Change | |||||||||||||||||
| Income tax provision | $ | 18,848 | $ | 31,031 | (39.3%) | |||||||||||||||
| Effective tax rate | 22.3 | % | 33.1 | % | (10.8) pt. | |||||||||||||||
The decrease in our effective income tax rate for 2022, as compared to 2021, was driven primarily by the impact of the sale of our Australian web hosting business. For tax purposes, we recognized a capital loss on the transaction, and we recorded a valuation allowance for the portion of the capital loss carryover we do not currently expect to realize. These impacts reduced income tax expense $7.1 million in 2022, reducing our effective income tax rate by 8.4 points. In addition, the impact of the repatriation of Canadian earnings drove a 2.7 point decrease in the effective income tax rate. Information regarding other factors that impacted our effective income tax rates can be found under the caption "Note 10: Income Tax Provision" in the Notes to Consolidated Financial Statements appearing in Part II, Item 8 of this report.
Net Income / Diluted Earnings per Share
| (in thousands, except per share amounts) | 2022 | 2021 | Change | |||||||||||||||||
| Net income | $ | 65,530 | $ | 62,772 | 4.4 | % | ||||||||||||||
| Diluted earnings per share | 1.50 | 1.45 | 3.4 | % | ||||||||||||||||
Adjusted diluted EPS(1)
|
4.08 | 4.88 | (16.4 | %) | ||||||||||||||||
(1) Information regarding the calculation of adjusted diluted EPS can be found in the following section entitled Reconciliation of Non-GAAP Financial Measures.
The increases in net income and diluted EPS and the decrease in adjusted diluted EPS for 2022, as compared to 2021, were driven by the factors outlined in Executive Overview – 2022 results vs. 2021.
Adjusted EBITDA
| (in thousands) | 2022 | 2021 | Change | |||||||||||||||||
| Adjusted EBITDA | $ | 418,130 | $ | 407,765 | 2.5% | |||||||||||||||
| Adjusted EBITDA as a percentage of total revenue (adjusted EBITDA margin) | 18.7 | % | 20.2 | % | (1.5) pt. | |||||||||||||||
The increase in adjusted EBITDA for 2022, as compared to 2021, was driven by price increases, actions taken to reduce costs as we continually evaluate our cost structure, and revenue growth from new business in all of our segments and strong ongoing demand for our products. In addition, the increase in adjusted EBITDA also reflected the incremental contribution from
29
the First American acquisition of $30.2 million. Partially offsetting these increases in adjusted EBITDA were increased costs related to our continued transformational investments, primarily investments in our technology infrastructure, including sales and financial management tools; inflationary pressures on hourly wages, materials and delivery; an unfavorable change in product mix driven by the impact of Promotional Solutions supply chain disruptions for certain higher margin printed products and growth in Data Solutions's data-driven marketing revenue combined with declines in the higher margin web hosting business; and the continuing secular decline in checks, business forms and some business accessories.
Adjusted EBITDA margin decreased for 2022, as compared to 2021, driven by planned technology investments, inflationary pressures and the unfavorable product mix. These decreases in adjusted EBITDA margin were partially offset by price increases, cost saving actions and operating leverage from the revenue growth.
Reconciliation of Non-GAAP Financial Measures
Free cash flow – We define free cash flow as net cash provided by operating activities less purchases of capital assets. We believe that free cash flow is an important indicator of cash available for debt service and for shareholders, after making capital investments to maintain or expand our asset base. A limitation of using the free cash flow measure is that not all of our free cash flow is available for discretionary spending, as we may have mandatory debt payments and other cash requirements that must be deducted from our cash available for future use. We believe that the measure of free cash flow provides an additional metric to compare cash generated by operations on a consistent basis and to provide insight into the cash flow available to fund items such as dividends, mandatory and discretionary debt reduction, acquisitions or other strategic investments, and share repurchases.
Net cash provided by operating activities for the years ended December 31 reconciles to free cash flow as follows:
| (in thousands) | 2022 | 2021 | ||||||||||||
| Net cash provided by operating activities | $ | 191,531 | $ | 210,821 | ||||||||||
| Purchases of capital assets | (104,598) | (109,140) | ||||||||||||
| Free cash flow | $ | 86,933 | $ | 101,681 | ||||||||||
Net debt – Management believes that net debt is an important measure to monitor leverage and to evaluate the balance sheet. In calculating net debt, cash and cash equivalents are subtracted from total debt because they could be used to reduce our debt obligations. A limitation associated with using net debt is that it subtracts cash and cash equivalents, and therefore, may imply that management intends to use cash and cash equivalents to reduce outstanding debt. In addition, net debt suggests that our debt obligations are less than the most comparable GAAP measure indicates.
Total debt reconciles to net debt as follows as of December 31:
| (in thousands) | 2022 | 2021 | ||||||||||||
| Total debt | $ | 1,644,276 | $ | 1,682,949 | ||||||||||
| Cash and cash equivalents | (40,435) | (41,231) | ||||||||||||
| Net debt | $ | 1,603,841 | $ | 1,641,718 | ||||||||||
Liquidity – We define liquidity as cash and cash equivalents plus the amount available for borrowing under our revolving credit facility. We consider liquidity to be an important metric for demonstrating the amount of cash that is available or that could be available on short notice. This financial measure is not a substitute for GAAP liquidity measures. Instead, we believe that this measurement enhances investors' understanding of the funds that are currently available.
Liquidity was as follows as of December 31:
| (in thousands) | 2022 | 2021 | |||||||||
| Cash and cash equivalents | $ | 40,435 | $ | 41,231 | |||||||
| Amount available for borrowing under revolving credit facility | 295,177 | 362,619 | |||||||||
| Liquidity | $ | 335,612 | $ | 403,850 | |||||||
Adjusted diluted EPS – By excluding the impact of non-cash items or items that we believe are not indicative of current period operating performance, we believe that adjusted diluted EPS provides useful comparable information to assist in analyzing our current period operating performance and in assessing our future operating performance. As such, adjusted diluted EPS is one of the key financial performance metrics we use to assess the operating results and performance of the business and to identify strategies to improve performance. It is reasonable to expect that one or more of the excluded items will occur in future periods, but the amounts recognized may vary significantly.
30
Diluted earnings per share for the years ended December 31 reconciles to adjusted diluted EPS as follows:
| (in thousands, except per share amounts) | 2022 | 2021 | ||||||||||||
| Net income | $ | 65,530 | $ | 62,772 | ||||||||||
| Net income attributable to non-controlling interest | (135) | (139) | ||||||||||||
| Net income attributable to Deluxe | 65,395 | 62,633 | ||||||||||||
| Acquisition amortization | 90,588 | 82,915 | ||||||||||||
| Restructuring and integration costs | 63,136 | 58,947 | ||||||||||||
| Share-based compensation expense | 23,676 | 29,477 | ||||||||||||
| Acquisition transaction costs | 130 | 18,913 | ||||||||||||
| Certain legal-related (benefit) expense | (730) | 2,443 | ||||||||||||
| Gain on sales of businesses and facility | (19,331) | — | ||||||||||||
| Gain on debt retirements | (1,726) | — | ||||||||||||
| Adjustments, pretax | 155,743 | 192,695 | ||||||||||||
Income tax provision impact of pretax adjustments(1)
|
(43,854) | (45,783) | ||||||||||||
| Adjustments, net of tax | 111,889 | 146,912 | ||||||||||||
| Adjusted net income attributable to Deluxe | 177,284 | 209,545 | ||||||||||||
| Income allocated to participating securities | (98) | (156) | ||||||||||||
| Re-measurement of share-based awards classified as liabilities | (512) | (448) | ||||||||||||
| Adjusted income attributable to Deluxe available to common shareholders | $ | 176,674 | $ | 208,941 | ||||||||||
| Weighted-average shares and potential common shares outstanding | 43,310 | 42,827 | ||||||||||||
Adjustment(2)
|
— | (16) | ||||||||||||
| Adjusted weighted-average shares and potential common shares outstanding | 43,310 | 42,811 | ||||||||||||
| GAAP diluted earnings per share | $ | 1.50 | $ | 1.45 | ||||||||||
| Adjustments, net of tax | 2.58 | 3.43 | ||||||||||||
| Adjusted diluted EPS | $ | 4.08 | $ | 4.88 | ||||||||||
(1) The tax effect of the pretax adjustments considers the tax treatment and related tax rate(s) that apply to each adjustment in the applicable tax jurisdiction(s). Generally, this results in a tax impact that approximates the U.S. effective tax rate for each adjustment. However, the tax impact of certain adjustments, such as share-based compensation expense and gains on sales of businesses, depends on whether the amounts are deductible in the respective tax jurisdictions and the applicable effective tax rate(s) in those jurisdictions.
(2) The total of weighted-average shares and potential common shares outstanding used in the calculation of adjusted diluted EPS differs from the GAAP calculation due to differences in the amount of dilutive securities in each calculation.
Adjusted EBITDA and adjusted EBITDA margin – We believe that adjusted EBITDA and adjusted EBITDA margin are useful in evaluating our operating performance, as they eliminate the effect of interest expense, income taxes, the accounting effects of capital investments (i.e., depreciation and amortization) and certain items, as presented below, that may vary for reasons unrelated to current period operating performance. In addition, management utilizes these measures to assess the operating results and performance of the business, to perform analytical comparisons and to identify strategies to improve performance. We also believe that an increasing adjusted EBITDA and adjusted EBITDA margin depict an increase in the value of the company. We do not consider adjusted EBITDA to be a measure of cash flow, as it does not consider certain cash requirements such as interest, income taxes, debt service payments or capital investments.
We have not reconciled our adjusted EBITDA outlook for 2023 to the directly comparable GAAP financial measure because we do not provide outlook guidance for net income or the reconciling items between net income and adjusted EBITDA. Because of the substantial uncertainty and variability surrounding certain of these forward-looking reconciling items, including asset impairment charges; restructuring and integration costs; gains and losses on sales of businesses and facilities; and certain legal-related expenses, a reconciliation of the non-GAAP financial measure outlook guidance to the corresponding GAAP measure is not available without unreasonable effort. The probable significance of certain of these reconciling items is high and, based on historical experience, could be material.
31
Net income for the years ended December 31 reconciles to adjusted EBITDA and adjusted EBITDA margin as follows:
| (in thousands) | 2022 | 2021 | ||||||||||||
| Net income | $ | 65,530 | $ | 62,772 | ||||||||||
| Non-controlling interest | (135) | (139) | ||||||||||||
| Depreciation and amortization expense | 172,552 | 148,767 | ||||||||||||
| Interest expense | 94,454 | 55,554 | ||||||||||||
| Income tax provision | 18,848 | 31,031 | ||||||||||||
| Restructuring and integration costs | 63,136 | 58,947 | ||||||||||||
| Share-based compensation expense | 23,676 | 29,477 | ||||||||||||
| Acquisition transaction costs | 130 | 18,913 | ||||||||||||
| Certain legal-related (benefit) expense | (730) | 2,443 | ||||||||||||
| Gain on sales of businesses and facility | (19,331) | — | ||||||||||||
| Adjusted EBITDA | $ | 418,130 | $ | 407,765 | ||||||||||
| Adjusted EBITDA margin | 18.7 | % | 20.2 | % | ||||||||||
| RESTRUCTURING AND INTEGRATION COSTS | ||
Restructuring and integration expense consists of costs related to the consolidation and migration of certain applications and processes, including our financial and sales management systems. It also includes costs related to the integration of acquired businesses into our systems and processes. These costs consist primarily of information technology consulting, project management services and internal labor, as well as other costs associated with our initiatives, such as training, travel, relocation and costs associated with facility closures. In addition, we recorded employee severance costs related to these initiatives, as well as our ongoing cost reduction initiatives across functional areas. Further information regarding restructuring and integration expense can be found under the caption "Note 9: Restructuring and Integration Expense" in the Notes to Consolidated Financial Statements appearing in Part II, Item 8 of this report.
The majority of the employee reductions included in our restructuring and integration accruals as of December 31, 2022, as well as the related severance payments, are expected to be completed by mid-2023. As a result of our employee reductions, we realized cost savings of approximately $20 million in SG&A expense, in comparison to our 2021 results of operations. For those employee reductions included in our restructuring and integration accruals through December 31, 2022, we expect to realize cost savings of approximately $25 million in SG&A expense in 2023, in comparison to our 2022 results of operations. In addition, we realized cost savings from facility closures of approximately $4 million in 2022, in comparison to our 2021 results of operations, and we continue to evaluate our real estate footprint. Note that these savings were, and will continue to be, partially offset by increased labor and other costs, including costs associated with new employees as we restructure certain activities and strive for the optimal mix of employee skill sets that will support our growth strategy.
| SEGMENT RESULTS | ||
We operate 4 reportable business segments: Payments, Data Solutions, Promotional Solutions and Checks. These segments are generally organized by product type and reflect the way we manage the company. In conjunction with the anticipated sale of our North American web hosting and logo businesses in 2023, as discussed in Executive Overview, we changed the name of our Cloud Solutions segment to Data Solutions. The financial information presented below for our reportable business segments is consistent with that presented under the caption “Note 17: Business Segment Information” in the Notes to Consolidated Financial Statements appearing in Part II, Item 8 of this report, where information regarding revenue for our product and service offerings can also be found.
Payments
Results for our Payments segment were as follows:
| (in thousands) | 2022 | 2021 | Change | |||||||||||||||||
| Total revenue | $ | 678,580 | $ | 510,359 | 33.0% | |||||||||||||||
| Adjusted EBITDA | 144,605 | 105,576 | 37.0% | |||||||||||||||||
| Adjusted EBITDA margin | 21.3 | % | 20.7 | % | 0.6 pt. | |||||||||||||||
32
The increase in total revenue for 2022, as compared to 2021, was driven, in part, by volume increases in our major payments products, primarily lockbox processing services and digital payments, as well as growth in merchant services. Revenue also benefited from price increases in response to the current inflationary environment. The revenue increase also reflected the acquisition and strong performance of First American, which contributed incremental revenue of $144.2 million for 2022. In 2023, we expect mid-single digit percentage revenue growth for this segment.
The increase in adjusted EBITDA for 2022, as compared to 2021, was driven, in part, by price increases and the revenue growth in our payments and merchant services businesses. In addition, adjusted EBITDA benefited from the incremental contribution of the First American acquisition of $30.2 million. These increases in adjusted EBITDA were partially offset by continued sales and information technology investments and inflationary pressures on our cost structure, primarily labor costs in our lockbox processing business. Adjusted EBITDA margin increased for 2022, as compared to 2021, as the benefit of the revenue increases exceeded the impact of the investments in the business and the inflationary pressures. In 2023, we expect adjusted EBITDA margins will be in the low-to-mid 20% range.
Data Solutions
Results for our Data Solutions segment were as follows:
| (in thousands) | 2022 | 2021 | Change | |||||||||||||||||
| Total revenue | $ | 267,525 | $ | 262,310 | 2.0% | |||||||||||||||
| Adjusted EBITDA | 68,214 | 70,172 | (2.8%) | |||||||||||||||||
| Adjusted EBITDA margin | 25.5 | % | 26.8 | % | (1.3) pt. | |||||||||||||||
The increase in total revenue for 2022, as compared to 2021, was driven by growth in data-driven marketing of $26.8 million for 2022, resulting from relationship expansion with key clients, sales wins and increased marketing spend by our customers. Partially offsetting the revenue increases was the sale of our Australian web hosting business, which resulted in a $16.0 million revenue reduction for 2022, and customer churn in our North American web hosting business. In 2023, we expect that revenue will decline approximately $57 million as a result of the sale of our North American web hosting and logo design businesses, as discussed in Executive Overview, and that the remainder of the business will deliver low single-digit percentage revenue growth.
The decrease in adjusted EBITDA for 2022, as compared to 2021, was driven by the sale of the Australian web hosting business, which reduced adjusted EBITDA by approximately $3 million for 2022, and investments in our data-driven marketing platform, partially offset by the growth in data-driven marketing revenue. Adjusted EBITDA margin decreased, as compared to 2021, driven by changes in product mix resulting from growth in data-driven marketing combined with declines in the higher margin web hosting business, as well as the platform investments in the data-driven marketing business. In 2023, we expect that adjusted EBITDA will decline approximately $20 million as a result of the sale of our North American web hosting and logo design businesses, as discussed in Executive Overview, and that the remainder of the business will deliver adjusted EBITDA margins in the low 20% range.
Promotional Solutions
Results for our Promotional Solutions segment were as follows:
| (in thousands) | 2022 | 2021 | Change | |||||||||||||||||
| Total revenue | $ | 562,917 | $ | 546,473 | 3.0% | |||||||||||||||
| Adjusted EBITDA | 79,549 | 85,384 | (6.8%) | |||||||||||||||||
| Adjusted EBITDA margin | 14.1 | % | 15.6 | % | (1.5) pt. | |||||||||||||||
The increase in total revenue for 2022, as compared to 2021, was driven primarily by the impact of new clients, relationship expansion with existing clients, price increases in response to the current inflationary environment, and strong ongoing demand for our promotional and apparel products. Partially offsetting these revenue increases were lower sales of certain printed products due to supply chain disruptions in the first half of the year, as well as the continuing secular decline in business forms and some accessories. As discussed in Executive Overview, we sold our strategic sourcing business during the second quarter of 2022 and our retail packaging business during the third quarter of 2022. These divestitures resulted in a revenue decline of $16.2 million for 2022. In 2023, we expect that revenue will decline approximately $12 million as a result of business exits, and that the remainder of the business will deliver low single-digit percentage revenue growth.
The decrease in adjusted EBITDA for 2022, as compared to 2021, was driven by inflationary pressures on materials and delivery and supply chain disruptions for certain printed products during the first half of the year, partially offset by price increases in response to the current inflationary environment and the revenue growth noted above. Adjusted EBITDA margin decreased for 2022, as compared to 2021, as the impact of inflation and supply chain disruptions for certain higher margin printed products
33
exceeded the impact of the price increases and revenue growth. In 2023, we expect adjusted EBITDA margin percentages will be in the mid-teens.
Checks
Results for our Checks segment were as follows:
| (in thousands) | 2022 | 2021 | Change | |||||||||||||||||
| Total revenue | $ | 728,988 | $ | 703,055 | 3.7% | |||||||||||||||
| Adjusted EBITDA | 320,498 | 324,224 | (1.1%) | |||||||||||||||||
| Adjusted EBITDA margin | 44.0 | % | 46.1 | % | (2.1) pt. | |||||||||||||||
The increase in total revenue for 2022, as compared to 2021, was driven primarily by the impact of new client wins, price increases and strong demand for business checks. These increases in revenue were partially offset by the continuing secular decline in overall check volumes. In 2023, we are expecting mid-single digit percentage revenue declines.
The decrease in adjusted EBITDA for 2022, as compared to 2021, was driven by inflationary pressures on delivery and materials and the secular decline in overall check volumes, partially offset by price increases, cost saving actions, the impact of new clients and strong demand for business checks. Adjusted EBITDA margin decreased for 2022, as compared to 2021, as inflationary cost pressures and the addition of lower margin new clients exceeded the benefit of the pricing and cost savings actions. In 2023, we expect adjusted EBITDA margins will be in the mid-40% range.
| CASH FLOWS AND LIQUIDITY | ||
As of December 31, 2022, we held cash and cash equivalents of $40.4 million, as well as restricted cash and restricted cash equivalents included in funds held for customers and in other non-current assets of $297.0 million. The following table should be read in conjunction with the consolidated statements of cash flows appearing in Part II, Item 8 of this report.
| (in thousands) | 2022 | 2021 | Change | |||||||||||||||||
Net cash provided by operating activities |
$ | 191,531 | $ | 210,821 | $ | (19,290) | ||||||||||||||
Net cash used by investing activities |
(80,325) | (1,066,601) | 986,276 | |||||||||||||||||
Net cash (used) provided by financing activities |
(48,601) | 912,961 | (961,562) | |||||||||||||||||
Effect of exchange rate change on cash, cash equivalents, restricted cash and restricted cash equivalents |
(10,681) | (1,099) | (9,582) | |||||||||||||||||
Net change in cash, cash equivalents, restricted cash and restricted cash equivalents |
$ | 51,924 | $ | 56,082 | $ | (4,158) | ||||||||||||||
Free cash flow(1)
|
$ | 86,933 | $ | 101,681 | $ | (14,748) | ||||||||||||||
(1) See Reconciliation of Non-GAAP Financial Measures within the Consolidated Results of Operations section, which defines and illustrates how we calculate free cash flow.
Net cash provided by operating activities decreased $19.3 million for 2022, as compared to 2021, driven by a $40.5 million increase in interest payments as a result of rising interest rates and debt issued to complete the First American acquisition, as well as a $22.8 million increase in employee cash bonus payments related to our 2021 operating performance. During 2021, a portion of our cash bonuses were paid in the form of restricted stock units and the bonus payments in 2021 were unusually low because of the impact of the COVID-19 pandemic on our 2020 performance. Operating cash flow was also negatively impacted by a $19.9 million increase in income tax payments, inflationary pressures, supply chain disruptions in our Promotional Solutions segment, and the continuing secular decline in checks, business forms and some business accessories. The increase in income tax payments was primarily driven by the provisions of the Tax Cuts and Jobs Act of 2017 that became effective in 2022 and that require the capitalization of research and development and cloud computing arrangement expenditures for income tax purposes. We were able to substantially offset these decreases in operating cash flow through the incremental contribution from the First American acquisition, price increases in response to the current inflationary environment, continued cost saving actions, a $22.9 million decrease in payments for cloud computing arrangements, primarily related to our sales and finance technology infrastructure, and revenue growth from new business and strong demand for our products. In addition, we incurred acquisition transaction costs of $18.9 million in 2021 related to the First American acquisition that did not recur in 2022.
34
Included in net cash provided by operating activities were the following operating cash outflows:
| (in thousands) | 2022 | 2021 | Change | |||||||||||||||||
| Interest payments | $ | 87,108 | $ | 46,621 | $ | 40,487 | ||||||||||||||
| Income tax payments | 38,629 | 18,761 | 19,868 | |||||||||||||||||
Performance-based compensation payments(1)
|
34,972 | 12,192 | 22,780 | |||||||||||||||||
Prepaid product discount payments(2)
|
30,603 | 40,920 | (10,317) | |||||||||||||||||
| Payments for cloud computing arrangement implementation costs | 18,649 | 41,547 | (22,898) | |||||||||||||||||
(1) Amounts reflect compensation based on total company and segment performance.
(2) See Other Financial Position Information for further information regarding these payments.
Net cash used by investing activities for 2022 was $986.3 million lower than 2021, driven by the acquisition of First American in 2021 and proceeds of $25.2 million from sales of businesses and a facility during 2022.
Net cash used by financing activities for 2022 was $961.6 million higher than 2021, driven by the net proceeds from debt issued in 2021 to fund the First American acquisition, as well as the net change in customer funds obligations in each period, primarily related to the portion of First American's business under which property tax payments are collected in December and are paid on behalf of customers in the following quarter. In addition, proceeds from issuing shares were $13.7 million lower in 2022, as certain employees of First American purchased our stock during 2021 in conjunction with the acquisition.
Significant cash transactions, excluding those related to operating activities, for each period were as follows:
| (in thousands) | 2022 | 2021 | Change | |||||||||||||||||
| Payment for acquisitions, net of cash, cash equivalents, restricted cash and restricted cash equivalents acquired | $ | — | $ | (958,514) | $ | 958,514 | ||||||||||||||
| Purchases of capital assets | (104,598) | (109,140) | 4,542 | |||||||||||||||||
| Cash dividends paid to shareholders | (52,647) | (51,654) | (993) | |||||||||||||||||
Net change in debt |
(40,613) | 854,974 | (895,587) | |||||||||||||||||
| Payments for debt issuance costs | — | (18,153) | 18,153 | |||||||||||||||||
Net change in customer funds obligations |
56,426 | 126,703 | (70,277) | |||||||||||||||||
| Proceeds from sale of businesses and facilities | 25,248 | 2,648 | 22,600 | |||||||||||||||||
| Proceeds from issuing shares | 3,112 | 16,843 | (13,731) | |||||||||||||||||
During 2022, we repatriated current year foreign earnings of $25.5 million held in cash by our Canadian subsidiaries. The associated tax expense of $1.8 million was included in our income tax provision. We believe the accumulated and remaining cash of our Canadian subsidiaries is sufficient to meet their working capital needs. We utilized the repatriated cash to reduce our outstanding debt. The historical unremitted Canadian earnings as of December 31, 2021, as well as the accumulated and future unremitted earnings of our European subsidiaries, will continue to be reinvested indefinitely in the operations of those subsidiaries. Deferred income taxes have not been recognized on these earnings as of December 31, 2022. If we were to repatriate our foreign cash and cash equivalents into the U.S. all at one time, we estimate that we would incur a foreign withholding tax liability of approximately $2 million, notwithstanding any tax planning strategies that might be available. As of December 31, 2022, the amount of cash and cash equivalents held by our foreign subsidiaries was $33.6 million, primarily in Canada.
During the fourth quarter of 2021, we repatriated accumulated foreign earnings of $85.3 million held in cash by our Canadian subsidiaries. We decided to complete the repatriation due, in part, to changes in Canadian law announced during 2021 and the reorganization of our capital structure in June 2021. We utilized this cash to reduce our outstanding debt. The associated tax expense of $4.6 million was included in our income tax provision for the fourth quarter of 2021.
In assessing our cash needs, we must consider our debt service requirements, lease obligations, other contractual commitments and contingent liabilities. Information regarding the maturities of our long-term debt, our operating and finance lease obligations and contingent liabilities can be found under the captions "Note 13: Debt," "Note 14: Leases" and "Note 15: Other Commitments and Contingencies," all of which appear in the Notes to Consolidated Financial Statements appearing in Part II, Item 8 of this report. In addition, we have executed contracts with third-party service providers, primarily for information technology services, including cloud computing and professional services agreements related to the modernization of our technology platform, as well as agreements for outsourcing services, the purchase of data, and payment acceptance services.
35
These contracts obligate us to pay approximately $145 million in total, with approximately $60 million due during 2023, $40 million due during 2024 and the remainder due through 2027.
As of December 31, 2022, $295.2 million was available for borrowing under our revolving credit facility. We anticipate that net cash generated by operations, along with cash and cash equivalents on hand and availability under our credit facility, will be sufficient to support our operations, including our contractual obligations and our debt service requirements, for the next 12 months, as well as our long-term capital requirements. We anticipate that we will continue to pay our regular quarterly dividend. However, dividends are approved by our board of directors each quarter and thus, are subject to change.
| CAPITAL RESOURCES | ||
The principal amount of our debt obligations was $1.66 billion as of December 31, 2022 and $1.70 billion as of December 31, 2021. Further information concerning our outstanding debt, including our debt service obligations, can be found under the caption "Note 13: Debt” in the Notes to Consolidated Financial Statements appearing in Part II, Item 8 of this report.
Our capital structure for each period was as follows:
| December 31, 2022 | December 31, 2021 | |||||||||||||||||||||||||||||||
| (in thousands) | Amount | Period-end interest rate | Amount | Period-end interest rate | Change | |||||||||||||||||||||||||||
Fixed interest rate(1)
|
$ | 975,000 | 6.6 | % | $ | 700,000 | 6.9 | % | $ | 275,000 | ||||||||||||||||||||||
| Floating interest rate | 684,375 | 6.6 | % | 1,002,125 | 2.4 | % | (317,750) | |||||||||||||||||||||||||
| Total debt principal | 1,659,375 | 6.6 | % | 1,702,125 | 4.2 | % | (42,750) | |||||||||||||||||||||||||
| Shareholders’ equity | 604,224 | 574,598 | 29,626 | |||||||||||||||||||||||||||||
| Total capital | $ | 2,263,599 | $ | 2,276,723 | $ | (13,124) | ||||||||||||||||||||||||||
(1) The fixed interest rate amount includes the amount of our variable-rate debt that is subject to interest rate swap agreements. The related interest rate includes the fixed rate under the swaps plus the credit facility spread due on all amounts outstanding under our credit facility.
In October 2018, our board of directors authorized the repurchase of up to $500.0 million of our common stock. This authorization has no expiration date. We have not repurchased any shares since the first quarter of 2020, when we suspended share repurchases in order to maintain liquidity during the COVID-19 pandemic. As of December 31, 2022, $287.5 million remained available for repurchase under the authorization. Information regarding changes in shareholders' equity can be found in the consolidated statements of shareholders' equity appearing in Part II, Item 8 of this report.
As of December 31, 2022, total commitments under our revolving credit facility were $500.0 million and the credit facility matures in June 2026. Our quarterly commitment fee ranges from 0.25% to 0.35%, based on our total leverage ratio, as defined in the credit agreement. Further information regarding the terms and maturities of our debt, as well as our debt covenants, can be found under the caption "Note 13: Debt" in the Notes to Consolidated Financial Statements appearing in Part II, Item 8 of this report. Under the terms of our credit facility, if our consolidated total leverage ratio exceeds 2.75 to 1.00, the aggregate annual amount of permitted dividends and share repurchases is limited to $60.0 million. We were in compliance with our debt covenants as of December 31, 2022, and we anticipate that we will remain in compliance with our debt covenants throughout 2023.
As of December 31, 2022, amounts were available for borrowing under our revolving credit facility as follows:
| (in thousands) | Total available | ||||
| Revolving credit facility commitment | $ | 500,000 | |||
| Amount drawn on revolving credit facility | (197,000) | ||||
Outstanding letters of credit(1)
|
(7,823) | ||||
Net available for borrowing as of December 31, 2022 |
$ | 295,177 | |||
(1) We use standby letters of credit primarily to collateralize certain obligations related to our self-insured workers' compensation claims, as well as claims for environmental matters, as required by certain states. These letters of credit reduce the amount available for borrowing under our revolving credit facility.
| OTHER FINANCIAL POSITION INFORMATION | ||
Information concerning items comprising selected captions on our consolidated balance sheets can be found under the caption "Note 3: Supplemental Balance Sheet and Cash Flow Information" in the Notes to Consolidated Financial Statements appearing in Part II, Item 8 of this report.
36
Prepaid product discounts – Other non-current assets include prepaid product discounts that are recorded upon contract execution and are generally amortized on the straight-line basis as reductions of revenue over the related contract term. Changes in prepaid product discounts during the past 3 years can be found under the caption "Note 3: Supplemental Balance Sheet and Cash Flow Information" in the Notes to Consolidated Financial Statements appearing in Part II, Item 8 of this report. Cash payments made for prepaid product discounts were $30.6 million for 2022, $40.9 million for 2021 and $33.6 million for 2020.
The number of checks being written has been declining, which has contributed to increased competitive pressure when attempting to retain or acquire clients. Both the number of financial institution clients requesting prepaid product discount payments and the amount of the payments has fluctuated from year to year. Although we anticipate that we will selectively continue to make these payments, we cannot quantify future amounts with certainty. The amount paid depends on numerous factors, such as the number and timing of contract executions and renewals, competitors’ actions, overall product discount levels and the structure of up-front product discount payments versus providing higher discount levels throughout the term of the contract.
Liabilities for prepaid product discounts are recorded upon contract execution. These obligations are monitored for each contract and are adjusted as payments are made. Prepaid product discounts due within the next year are included in accrued liabilities on the consolidated balance sheets and were $4.2 million as of December 31, 2022 and $11.9 million as of December 31, 2021.
| CRITICAL ACCOUNTING ESTIMATES | ||
Our critical accounting estimates are those that are most important to the portrayal of our financial condition and results of operations, or which place the most significant demands on management's judgment about the effect of matters that are inherently uncertain, and the impact of different estimates or assumptions could be material to our financial condition or results of operations. Our MD&A discussion is based upon our consolidated financial statements, which have been prepared in accordance with GAAP. Our accounting policies are discussed under the caption “Note 1: Significant Accounting Policies” in the Notes to Consolidated Financial Statements appearing in Part II, Item 8 of this report. We review the accounting policies used in reporting our financial results on a regular basis. The preparation of our financial statements requires us to make estimates and judgments that affect the reported amounts of assets, liabilities, revenues and expenses and the related disclosure of contingent assets and liabilities. We base our estimates on historical experience and on various other factors and assumptions that we believe are reasonable under the circumstances, the result of which forms the basis for making judgments about the carrying values of assets and liabilities. In some instances, we reasonably could have used different accounting estimates and, in other instances, changes in the accounting estimates are reasonably likely to occur from period to period. Accordingly, actual results may differ from our estimates. Significant estimates and judgments are reviewed by management on an ongoing basis and by the audit committee of our board of directors at the end of each quarter prior to the public release of our financial results.
Goodwill Impairment
As of December 31, 2022, goodwill totaled $1.43 billion, which represented 46.5% of our total assets. Goodwill is tested for impairment on an annual basis as of July 31, or more frequently if events occur or circumstances change that would indicate a possible impairment.
To analyze goodwill for impairment, we must assign our goodwill to individual reporting units. Identification of reporting units includes an analysis of the components that comprise each of our operating segments, which considers, among other things, the manner in which we operate our business and the availability of discrete financial information. Components of an operating segment are aggregated to form a reporting unit if the components have similar economic characteristics. We periodically review our reporting units to ensure that they continue to reflect the manner in which we operate our business.
When completing our annual goodwill impairment analysis, we have the option to first assess qualitative factors to determine whether the existence of events or circumstances leads to a determination that it is more likely than not that the fair value of a reporting unit is less than its carrying amount. If, after this qualitative assessment, we determine it is not more likely than not that the fair value of a reporting unit is less than its carrying amount, then performing the quantitative impairment test is unnecessary. In completing the 2022 annual impairment analysis of goodwill as of July 31, 2022, we elected to perform qualitative analyses for all of our reporting units, with the exception of our Data Analytics reporting unit. These qualitative analyses evaluated factors, including, but not limited to, economic, market and industry conditions, cost factors and the overall financial performance of the reporting units. We also considered the most recent quantitative analyses completed in prior periods. In completing these assessments, we noted no changes in events or circumstances that indicated that it was more likely than not that the fair value of any reporting unit was less than its carrying amount. The quantitative analysis of our Data Analytics reporting unit indicated that the estimated fair value of this reporting unit exceeded its carrying value by approximately $46 million, or by 39% above the carrying value of its net assets. As such, no goodwill impairment charges were recorded as a result of our 2022 annual impairment analysis.
37
When performing a quantitative analysis of goodwill, we first compare the carrying value of the reporting unit, including goodwill, to its estimated fair value. Carrying value is based on the assets and liabilities associated with the operations of the reporting unit, which often requires the allocation of shared and corporate items among reporting units. We utilize a discounted cash flow model to calculate the estimated fair value of a reporting unit. This approach is a valuation technique under which we estimate future cash flows using the reporting unit's financial forecast from the perspective of an unrelated market participant. Using historical trending and internal forecasting techniques, we project revenue and apply our fixed and variable cost experience rates to the projected revenue to arrive at the future cash flows. A terminal value is then applied to the projected cash flow stream. Future estimated cash flows are discounted to their present value to calculate the estimated fair value. The discount rate used is the market-value-weighted average of our estimated cost of capital derived using both known and estimated customary market metrics. In determining the estimated fair values of our reporting units, we are required to estimate a number of factors, including revenue growth rates, terminal growth rates, direct costs, the discount rate and the allocation of shared and corporate items. When completing a quantitative analysis for all of our reporting units, the summation of our reporting units' fair values is compared to our consolidated fair value, as indicated by our market capitalization, to evaluate the reasonableness of our calculations.
While we did not record any goodwill impairment charges during 2022 or 2021, we did record significant goodwill impairment charges during 2020.
2020 goodwill impairment charges – During the first quarter of 2020, when the World Health Organization (WHO) classified the COVID-19 outbreak as a pandemic, we observed a decline in the market valuation of our common shares and we determined that the global response to the pandemic negatively impacted our estimates of expected future cash flows. We concluded that a triggering event had occurred for 2 of our reporting units and as such, we completed quantitative goodwill impairment analyses for our Promotional Solutions and Data Solutions Web Hosting reporting units as of March 31, 2020. Our analyses indicated that the goodwill of our Promotional Solutions reporting unit was partially impaired and the goodwill of our Data Solutions Web Hosting reporting unit was fully impaired, and we recorded goodwill impairment charges of $67.1 million and $4.3 million, respectively. The impairment charges were measured as the amount by which the reporting units' carrying values exceeded their estimated fair values, limited to the carrying amount of goodwill. After the impairment charges, $59.0 million of goodwill remained in the Promotional Solutions reporting unit as of the measurement date.
Our impairment analyses were based on assumptions made using the best information available at the time, including the performance of our reporting units subsequent to the WHO declaration of a pandemic and available economic forecasts. These assumptions anticipated a sharp decline in gross domestic product and a material decline in the number of small businesses. The sweeping nature of the pandemic made it extremely difficult to predict how our business and operations would be affected in the longer term. To the extent our assumptions differ from actual events, we may be required to record additional asset impairment charges.
Our impairment assessments are sensitive to changes in forecasted revenues and expenses, as well as our selected discount rate. For the March 31, 2020 assessment of our Promotional Solutions reporting unit, holding all other assumptions constant, if we assumed revenue in each year was 10% higher than we estimated, our goodwill impairment charge would have been approximately $18 million less, and if we assumed revenue in each year was 10% lower than we estimated, our goodwill impairment charge would have been approximately $18 million more. If we assumed our expenses, as a percentage of revenue, were 100 basis points lower in each year, our goodwill impairment charge would have been approximately $39 million less, and if we assumed our expenses, as a percentage of revenue, were 100 basis points higher in each year, our goodwill impairment charge would have been approximately $39 million more. If we assumed our selected discount rate of 12% was 100 basis points lower, our goodwill impairment charge would have been approximately $21 million less, and if we assumed the discount rate was 100 basis points higher, our goodwill impairment charge would have been approximately $17 million more.
Further information regarding all of our goodwill impairment analyses can be found under the caption "Note 8: Fair Value Measurements" in the Notes to Consolidated Financial Statements appearing in Item II, Part 8 of this report. Evaluations of asset impairment require us to make assumptions about future events, market conditions and financial performance over the life of the asset being evaluated. These assumptions require significant judgment and actual results may vary from our assumptions. For example, if our stock price were to further decline over a sustained period, if a further downturn in economic conditions were to negatively affect our actual and forecasted operating results, if we were to change our business strategies and/or the allocation of resources, if we were to lose significant customers, if competition were to materially increase, or if order volume declines for checks and business forms were to materially accelerate, these situations could indicate a decline in the fair value of one or more of our reporting units. This may require us to record additional impairment charges for a portion of goodwill or other assets.
Business Combinations
We allocate the purchase price of acquired businesses to the estimated fair values of the assets acquired and liabilities assumed as of the date of the acquisition. The calculations used to determine the fair value of the long-lived assets acquired, primarily intangible assets, can be complex and require significant judgment. We weigh many factors when completing these estimates, including, but not limited to, the nature of the acquired company’s business; its competitive position, strengths, and challenges; its historical financial position and performance; estimated customer retention rates; discount rates; and future plans
38
for the combined entity. We may also engage independent valuation specialists, when necessary, to assist in the fair value calculations for significant acquired long-lived assets.
We generally estimate the fair value of acquired customer lists using the multi-period excess earnings method. This valuation model estimates revenues and cash flows derived from the asset and then deducts portions of the cash flow that can be attributed to supporting assets, such as a trade name or fixed assets, that contributed to the generation of the cash flows. The resulting cash flow, which is attributable solely to the customer list asset, is then discounted at a rate of return commensurate with the risk of the asset to calculate a present value. The fair value of acquired customer lists may also be estimated by discounting the estimated cash flows expected to be generated by the assets. During 2021, we also utilized the multi-period excess earnings method to estimate the fair value of acquired partner relationship intangible assets. Key assumptions used in these calculations include same-customer revenue, merchant and partner growth rates; estimated earnings; estimated customer and partner retention rates, based on the acquirees' historical information; and the discount rate.
The fair value of acquired trade names and technology is estimated, at times, using the relief from royalty method, which calculates the cost savings associated with owning rather than licensing the assets. Assumed royalty rates are applied to projected revenue for the estimated remaining useful lives of the assets to estimate the royalty savings. Royalty rates are selected based on the attributes of the asset, including its recognition and reputation in the industry, and in the case of trade names, with consideration of the specific profitability of the products sold under a trade name and supporting assets. The fair value of acquired technology may also be estimated using the cost of reproduction method under which the primary components of the technology are identified and the estimated cost to reproduce the technology is calculated based on historical data provided by the acquiree.
The excess of the purchase price over the estimated fair value of the net assets acquired is recorded as goodwill. Goodwill is not amortized, but is subject to impairment testing on at least an annual basis.
We are also required to estimate the useful lives of the acquired intangible assets, which determines the amount of acquisition-related amortization expense we will record in future periods. Each reporting period, we evaluate the remaining useful lives of our amortizable intangibles to determine whether events or circumstances warrant a revision to the remaining period of amortization.
While we use our best estimates and assumptions, our fair value estimates are inherently uncertain and subject to refinement. As a result, during the measurement period, which may be up to 1 year from the acquisition date, we may record adjustments to the assets acquired and liabilities assumed, with the corresponding offset to goodwill. Any adjustments required after the measurement period are recorded in the consolidated statements of income.
The judgments required in determining the estimated fair values and expected useful lives assigned to each class of assets and liabilities acquired can significantly affect net income. For example, different classes of assets will have different useful lives. Consequently, to the extent a longer-lived asset is ascribed greater value than a shorter-lived asset, net income in a given period may be higher. Additionally, assigning a lower value to amortizable intangibles would result in a higher amount assigned to goodwill. As goodwill is not amortized, this would benefit net income in a given period, although goodwill is subject to annual impairment analysis.
Revenue Recognition
Product revenue is recognized when control of the goods is transferred to our customers, in an amount that reflects the consideration we expect to be entitled to in exchange for those goods. In most cases, control is transferred when products are shipped. We recognize the vast majority of our service revenue as the services are provided. The majority of our contracts are for the shipment of tangible products or the delivery of services that have a single performance obligation or include multiple performance obligations where control is transferred at the same time. Certain of our financial institution contracts require prepaid product discounts in the form of cash payments we make to our financial institution clients. These prepaid product discounts are included in other non-current assets on our consolidated balance sheets and are generally amortized as reductions of revenue on the straight-line basis over the contract term. Sales tax collected concurrent with revenue-producing activities is excluded from revenue. Amounts billed to customers for shipping and handling are included in revenue, while the related costs incurred for shipping and handling are reflected in cost of products and are accrued when the related revenue is recognized.
When another party is involved in providing goods or services to a customer, we must determine whether our obligation is to provide the specified good or service itself (i.e., we are the principal in the transaction) or to arrange for that good or service to be provided by the other party (i.e., we are an agent in the transaction). When we are responsible for satisfying a performance obligation, based on our ability to control the product or service provided, we are considered the principal and revenue is recognized for the gross amount of consideration. When the other party is primarily responsible for satisfying a performance obligation, we are considered the agent and revenue is recognized in the amount of any fee or commission to which we are entitled. We sell certain products and services through a network of distributors. We have determined that we are the principal in these transactions, and revenue is recorded for the gross amount of consideration.
39
Certain costs incurred to obtain customer contracts are required to be recognized as assets and amortized consistent with the transfer of goods or services to the customer. As such, we defer costs related to obtaining check supply, treasury management solution and merchant services contracts. These amounts, which totaled $21.3 million as of December 31, 2022, are included in other non-current assets and are amortized on the straight-line basis as SG&A expense. Amortization of these amounts on the straight-line basis approximates the timing of the transfer of goods or services to the customer. Generally, these amounts are being amortized over periods of 2 to 5 years. We expense these costs as incurred when the amortization period would have been 1 year or less.
Accounting for customer contracts can be complex and may involve the use of various techniques to estimate total contract revenue. Estimates related to variable consideration are based on various assumptions to project the outcome of future events. We review and update our contract-related estimates regularly, and we do not anticipate that revisions to our estimates would have a material effect on our results of operations, financial position or cash flows.
New Accounting Pronouncements
Information regarding accounting pronouncements not yet adopted can be found under the caption “Note 2: New Accounting Pronouncements” in the Notes to Consolidated Financial Statements appearing in Part II, Item 8 of this report.
| ITEM 7A. QUANTITATIVE AND QUALITATIVE DISCLOSURES ABOUT MARKET RISK | ||
Interest rate risk – We are exposed to changes in interest rates primarily as a result of the borrowing activities used to support our capital structure, maintain liquidity and fund business operations and investments. We do not enter into financial instruments for speculative or trading purposes. The nature and amount of debt outstanding can be expected to vary as a result of future business requirements, market conditions and other factors.
Interest is payable on amounts outstanding under our credit facility at a fluctuating rate of interest determined by reference to the eurodollar rate (derived from LIBOR) plus an applicable margin ranging from 1.5% to 2.5%, depending on our total leverage ratio, as defined in the credit agreement. We are currently in the process of modifying our existing credit facility to utilize the Secured Overnight Financing Rate (SOFR), replacing LIBOR as the reference rate in the agreement, effective March 20, 2023. Subsequent to this modification, interest will be payable based on SOFR plus an applicable margin. We also had $475.0 million of 8.0% senior, unsecured notes outstanding as of December 31, 2022. Including the related discount and debt issuance costs, the effective interest rate on these notes is 8.3%.
As of December 31, 2022, our total debt outstanding was as follows:
| (in thousands) |
Carrying amount(1)
|
Fair value(2)
|
Interest rate(3)
|
|||||||||||||||||
| Senior, secured term loan facility | $ | 979,757 | $ | 987,375 | 6.6 | % | ||||||||||||||
| Senior, unsecured notes | 467,519 | 390,042 | 8.0 | % | ||||||||||||||||
| Amounts drawn on revolving credit facility | 197,000 | 197,000 | 6.6 | % | ||||||||||||||||
| Total debt | $ | 1,644,276 | $ | 1,574,417 | 6.6 | % | ||||||||||||||
(1) The carrying amount has been reduced by unamortized discount and debt issuance costs of $15.1 million.
(2) For the amounts outstanding under our credit facility agreement, fair value approximates carrying value because the interest rate is variable and reflects current market rates. The fair value of the senior, unsecured notes is based on quoted prices in active markets for the identical liability when traded as an asset.
(3) The interest rate presented for total debt includes the impact of the interest rate swaps discussed below.
As part of our interest rate risk management strategy, we entered into interest rate swaps, which we designated as cash flow hedges, to mitigate variability in interest payments on a portion of our variable-rate debt. The interest rate swaps effectively convert $500.0 million of variable-rate debt to a fixed rate. Further information regarding the interest rate swaps can be found under the caption "Note 7: Derivative Financial Instruments" in the Notes to Consolidated Financial Statements appearing in Part II, Item 8 of this report. Changes in the fair value of the interest rate swaps are recorded in accumulated other comprehensive loss on the consolidated balance sheets and are subsequently reclassified to interest expense as interest payments are made on the variable-rate debt. The fair value of the interest rate swaps in effect as of December 31, 2022 was $3.6 million and was included in other current and other non-current assets on the consolidated balance sheet. The fair value of the interest rate swap in effect as of December 31, 2021 was $3.0 million and was included in other non-current liabilities on the consolidated balance sheet.
Based on the daily average amount of outstanding variable-rate debt in our portfolio, a one-percentage-point change in our weighted-average interest rate would have resulted in a $9.1 million change in interest expense for 2022.
40
Our credit agreement matures on June 1, 2026, at which time any amounts outstanding under the revolving credit facility must be repaid. The term loan facility requires periodic principal payments through June 1, 2026, and the senior, unsecured notes mature in June 2029. Information regarding the maturities of our long-term debt can be found under the caption "Note 13: Debt" in the Notes to Consolidated Financial Statements appearing in Part II, Item 8 of this report.
Foreign currency exchange rate risk – We are exposed to changes in foreign currency exchange rates. Investments in, and loans and advances to, foreign subsidiaries and branches, as well as the operations of these businesses, are denominated in foreign currencies, primarily Canadian dollars. The effect of exchange rate changes is expected to have a minimal impact on our earnings and cash flows, as our foreign operations represent a relatively small portion of our business. We have not entered into hedges against changes in foreign currency exchange rates.
41
| ITEM 8. FINANCIAL STATEMENTS AND SUPPLEMENTARY DATA | ||
INDEX TO CONSOLIDATED FINANCIAL STATEMENTS
| Item | Page | |||||||
Report of Independent Registered Public Accounting Firm (PCAOB ID |
||||||||
| Notes to Consolidated Financial Statements: | ||||||||
42
Report of Independent Registered Public Accounting Firm
To the Board of Directors and Shareholders of Deluxe Corporation
Opinions on the Financial Statements and Internal Control over Financial Reporting
We have audited the accompanying consolidated balance sheets of Deluxe Corporation and its subsidiaries (the “Company”) as of December 31, 2022 and 2021, and the related consolidated statements of income, of comprehensive income, of shareholders' equity and of cash flows for each of the three years in the period ended December 31, 2022, including the related notes (collectively referred to as the “consolidated financial statements”). We also have audited the Company's internal control over financial reporting as of December 31, 2022, based on criteria established in Internal Control - Integrated Framework (2013) issued by the Committee of Sponsoring Organizations of the Treadway Commission (COSO).
In our opinion, the consolidated financial statements referred to above present fairly, in all material respects, the financial position of the Company as of December 31, 2022 and 2021, and the results of its operations and its cash flows for each of the three years in the period ended December 31, 2022 in conformity with accounting principles generally accepted in the United States of America. Also in our opinion, the Company maintained, in all material respects, effective internal control over financial reporting as of December 31, 2022, based on criteria established in Internal Control - Integrated Framework (2013) issued by the COSO.
Basis for Opinions
The Company's management is responsible for these consolidated financial statements, for maintaining effective internal control over financial reporting, and for its assessment of the effectiveness of internal control over financial reporting, included in Management’s Report on Internal Control over Financial Reporting appearing under Item 9A. Our responsibility is to express opinions on the Company’s consolidated financial statements and on the Company's internal control over financial reporting based on our audits. We are a public accounting firm registered with the Public Company Accounting Oversight Board (United States) (PCAOB) and are required to be independent with respect to the Company in accordance with the U.S. federal securities laws and the applicable rules and regulations of the Securities and Exchange Commission and the PCAOB.
We conducted our audits in accordance with the standards of the PCAOB. Those standards require that we plan and perform the audits to obtain reasonable assurance about whether the consolidated financial statements are free of material misstatement, whether due to error or fraud, and whether effective internal control over financial reporting was maintained in all material respects.
Our audits of the consolidated financial statements included performing procedures to assess the risks of material misstatement of the consolidated financial statements, whether due to error or fraud, and performing procedures that respond to those risks. Such procedures included examining, on a test basis, evidence regarding the amounts and disclosures in the consolidated financial statements. Our audits also included evaluating the accounting principles used and significant estimates made by management, as well as evaluating the overall presentation of the consolidated financial statements. Our audit of internal control over financial reporting included obtaining an understanding of internal control over financial reporting, assessing the risk that a material weakness exists, and testing and evaluating the design and operating effectiveness of internal control based on the assessed risk. Our audits also included performing such other procedures as we considered necessary in the circumstances. We believe that our audits provide a reasonable basis for our opinions.
Definition and Limitations of Internal Control over Financial Reporting
A company’s internal control over financial reporting is a process designed to provide reasonable assurance regarding the reliability of financial reporting and the preparation of financial statements for external purposes in accordance with generally accepted accounting principles. A company’s internal control over financial reporting includes those policies and procedures that (i) pertain to the maintenance of records that, in reasonable detail, accurately and fairly reflect the transactions and dispositions of the assets of the company; (ii) provide reasonable assurance that transactions are recorded as necessary to permit preparation of financial statements in accordance with generally accepted accounting principles, and that receipts and expenditures of the company are being made only in accordance with authorizations of management and directors of the company; and (iii) provide reasonable assurance regarding prevention or timely detection of unauthorized acquisition, use, or disposition of the company’s assets that could have a material effect on the financial statements.
Because of its inherent limitations, internal control over financial reporting may not prevent or detect misstatements. Also, projections of any evaluation of effectiveness to future periods are subject to the risk that controls may become inadequate because of changes in conditions, or that the degree of compliance with the policies or procedures may deteriorate.
Critical Audit Matters
The critical audit matter communicated below is a matter arising from the current period audit of the consolidated financial statements that was communicated or required to be communicated to the audit committee and that (i) relates to accounts or
43
disclosures that are material to the consolidated financial statements and (ii) involved our especially challenging, subjective, or complex judgments. The communication of critical audit matters does not alter in any way our opinion on the consolidated financial statements, taken as a whole, and we are not, by communicating the critical audit matter below, providing a separate opinion on the critical audit matter or on the accounts or disclosures to which it relates.
Revenue Recognition
As described in Notes 1 and 17 to the consolidated financial statements, product and service revenue of $1,286 million and $952 million, respectively, for the year ended December 31, 2022, are disaggregated by seven product and service offerings including checks, merchant services and other payment solutions, forms and other products, marketing and promotional solutions, treasury management solutions, data-driven marketing solutions, and web and hosted solutions. Product revenue is recognized when control of the goods is transferred to customers, in an amount that reflects the consideration the Company expects to be entitled to in exchange for those goods. In most cases, control is transferred when products are shipped. The Company recognizes the vast majority of service revenue as services are provided. The majority of the Company’s contracts are for the shipment of tangible products or the delivery of services that have a single performance obligation or include multiple performance obligations where control is transferred at the same time.
The principal consideration for our determination that performing procedures relating to revenue recognition is a critical audit matter is a high degree of auditor effort in performing procedures related to the Company’s revenue recognition.
Addressing the matter involved performing procedures and evaluating audit evidence in connection with forming our overall opinion on the consolidated financial statements. These procedures included testing the effectiveness of controls relating to the revenue recognition process. These procedures also included, among others, testing, on a sample basis, whether the criteria for revenue recognition have been met by obtaining and inspecting source documents, including customer order information, the related customer contract, invoices, proof of shipment or delivery and cash receipts, as applicable.
/s/ PricewaterhouseCoopers LLP
February 24, 2023
We have served as the Company’s auditor since 2001.
44
| DELUXE CORPORATION CONSOLIDATED BALANCE SHEETS | ||
| (in thousands, except share par value) | December 31, 2022 |
December 31, 2021 |
||||||||||||
| ASSETS | ||||||||||||||
| Current assets: | ||||||||||||||
Cash and cash equivalents, including securities carried at fair value of $ |
$ | $ | ||||||||||||
| Trade accounts receivable, net of allowance for credit losses | ||||||||||||||
| Inventories and supplies, net of reserves | ||||||||||||||
Funds held for customers, including securities carried at fair value of $ |
||||||||||||||
| Prepaid expenses | ||||||||||||||
| Revenue in excess of billings | ||||||||||||||
| Other current assets | ||||||||||||||
| Total current assets | ||||||||||||||
| Deferred income taxes | ||||||||||||||
Long-term investments |
||||||||||||||
| Property, plant and equipment, net of accumulated depreciation | ||||||||||||||
| Operating lease assets | ||||||||||||||
| Intangibles, net of accumulated amortization | ||||||||||||||
| Goodwill | ||||||||||||||
| Other non-current assets | ||||||||||||||
| Total assets | $ | $ | ||||||||||||
| LIABILITIES AND SHAREHOLDERS’ EQUITY | ||||||||||||||
| Current liabilities: | ||||||||||||||
| Accounts payable | $ | $ | ||||||||||||
| Funds held for customers | ||||||||||||||
| Accrued liabilities | ||||||||||||||
| Current portion of long-term debt | ||||||||||||||
| Total current liabilities | ||||||||||||||
| Long-term debt | ||||||||||||||
| Operating lease liabilities | ||||||||||||||
| Deferred income taxes | ||||||||||||||
| Other non-current liabilities | ||||||||||||||
| Commitments and contingencies (Notes 10, 14 and 15) | ||||||||||||||
| Shareholders’ equity: | ||||||||||||||
Common shares $ |
||||||||||||||
| Additional paid-in capital | ||||||||||||||
| Retained earnings | ||||||||||||||
| Accumulated other comprehensive loss | ( |
( |
||||||||||||
| Non-controlling interest | ||||||||||||||
| Total shareholders’ equity | ||||||||||||||
| Total liabilities and shareholders’ equity | $ | $ | ||||||||||||
See Notes to Consolidated Financial Statements
45
| DELUXE CORPORATION CONSOLIDATED STATEMENTS OF INCOME | ||
| Year Ended December 31, | ||||||||||||||||||||
| (in thousands, except per share amounts) | 2022 | 2021 | 2020 | |||||||||||||||||
| Product revenue | $ | $ | $ | |||||||||||||||||
| Service revenue | ||||||||||||||||||||
| Total revenue | ||||||||||||||||||||
| Cost of products | ( |
( |
( |
|||||||||||||||||
| Cost of services | ( |
( |
( |
|||||||||||||||||
| Total cost of revenue | ( |
( |
( |
|||||||||||||||||
| Gross profit | ||||||||||||||||||||
| Selling, general and administrative expense | ( |
( |
( |
|||||||||||||||||
| Restructuring and integration expense | ( |
( |
( |
|||||||||||||||||
| Gain (loss) on sale of businesses and facility | ( |
|||||||||||||||||||
| Asset impairment charges | ( |
|||||||||||||||||||
| Operating income | ||||||||||||||||||||
| Interest expense | ( |
( |
( |
|||||||||||||||||
| Other income, net | ||||||||||||||||||||
| Income before income taxes | ||||||||||||||||||||
| Income tax provision | ( |
( |
( |
|||||||||||||||||
| Net income | ||||||||||||||||||||
| Net income attributable to non-controlling interest | ( |
( |
( |
|||||||||||||||||
| Net income attributable to Deluxe | $ | $ | $ | |||||||||||||||||
| Basic earnings per share | $ | $ | $ | |||||||||||||||||
| Diluted earnings per share | ||||||||||||||||||||
See Notes to Consolidated Financial Statements
46
| DELUXE CORPORATION CONSOLIDATED STATEMENTS OF COMPREHENSIVE INCOME | ||
| Year Ended December 31, | ||||||||||||||||||||
| (in thousands) | 2022 | 2021 | 2020 | |||||||||||||||||
| Net income | $ | $ | $ | |||||||||||||||||
| Other comprehensive income, net of tax: | ||||||||||||||||||||
| Postretirement benefit plans: | ||||||||||||||||||||
| Net actuarial (loss) gain arising during the year | ( |
|||||||||||||||||||
Less reclassification of amounts to net income: |
||||||||||||||||||||
| Amortization of prior service credit | ( |
( |
( |
|||||||||||||||||
| Amortization of net actuarial loss | ||||||||||||||||||||
| Postretirement benefit plans | ( |
|||||||||||||||||||
Interest rate swaps: |
||||||||||||||||||||
Unrealized gain (loss) arising during the year |
( |
|||||||||||||||||||
Reclassification of realized (gain) loss to net income |
( |
|||||||||||||||||||
Interest rate swaps |
( |
|||||||||||||||||||
| Debt securities: | ||||||||||||||||||||
Unrealized holding (loss) gain arising during the year |
( |
( |
||||||||||||||||||
| Reclassification of realized loss (gain) to net income | ( |
|||||||||||||||||||
| Debt securities | ( |
( |
||||||||||||||||||
| Foreign currency translation adjustment: | ||||||||||||||||||||
| Unrealized foreign currency translation (loss) gain arising during the year | ( |
|||||||||||||||||||
| Reclassification of foreign currency translation loss to net income | ||||||||||||||||||||
| Foreign currency translation adjustment | ||||||||||||||||||||
| Other comprehensive (loss) income | ( |
|||||||||||||||||||
| Comprehensive income | ||||||||||||||||||||
| Comprehensive income attributable to non-controlling interest | ( |
( |
( |
|||||||||||||||||
| Comprehensive income attributable to Deluxe | $ | $ | $ | |||||||||||||||||
Income tax benefit (expense) of other comprehensive (loss) income included in above amounts: |
||||||||||||||||||||
Postretirement benefit plans: |
||||||||||||||||||||
Net actuarial (loss) gain arising during the year |
$ | $ | ( |
$ | ( |
|||||||||||||||
Less reclassification of amounts to net income: |
||||||||||||||||||||
Amortization of prior service credit |
||||||||||||||||||||
Amortization of net actuarial loss |
( |
( |
( |
|||||||||||||||||
Postretirement benefit plans |
( |
( |
||||||||||||||||||
Interest rate swaps: |
||||||||||||||||||||
Unrealized gain (loss) arising during the year |
( |
( |
||||||||||||||||||
Reclassification of realized (gain) loss to net income |
( |
( |
||||||||||||||||||
Interest rate swaps |
( |
( |
||||||||||||||||||
| Debt securities: | ||||||||||||||||||||
Unrealized holding (loss) gain arising during the year |
( |
|||||||||||||||||||
| Reclassification of realized loss (gain) to net income | ( |
|||||||||||||||||||
| Debt securities | ( |
|||||||||||||||||||
Total net tax benefit (expense) |
$ | $ | ( |
$ | ( |
|||||||||||||||
See Notes to Consolidated Financial Statements
47
| DELUXE CORPORATION CONSOLIDATED STATEMENTS OF SHAREHOLDERS' EQUITY | ||
| (in thousands) | Common shares |
Common shares par value
|
Additional paid-in capital | Retained earnings | Accumulated other comprehensive loss | Non-controlling interest | Total | |||||||||||||||||||||||||||||||||||||
Balance, December 31, 2019 |
$ | $ | $ | $ | ( |
$ | $ | |||||||||||||||||||||||||||||||||||||
| Net income | — | — | — | — | ||||||||||||||||||||||||||||||||||||||||
Cash dividends ($ |
— | — | — | ( |
— | — | ( |
|||||||||||||||||||||||||||||||||||||
| Common shares issued | — | — | — | |||||||||||||||||||||||||||||||||||||||||
| Common shares repurchased | ( |
( |
( |
( |
— | — | ( |
|||||||||||||||||||||||||||||||||||||
| Other common shares retired | ( |
( |
( |
— | — | — | ( |
|||||||||||||||||||||||||||||||||||||
Employee share-based compensation |
— | — | — | — | — | |||||||||||||||||||||||||||||||||||||||
| Adoption of Accounting Standards Update No. 2016-13 | — | — | — | ( |
— | — | ( |
|||||||||||||||||||||||||||||||||||||
Other comprehensive income |
— | — | — | — | — | |||||||||||||||||||||||||||||||||||||||
| Investment in non-controlling interest | — | — | — | — | — | |||||||||||||||||||||||||||||||||||||||
Balance, December 31, 2020 |
( |
|||||||||||||||||||||||||||||||||||||||||||
| Net income | — | — | — | — | ||||||||||||||||||||||||||||||||||||||||
Cash dividends ($ |
— | — | — | ( |
— | — | ( |
|||||||||||||||||||||||||||||||||||||
| Common shares issued | — | — | — | |||||||||||||||||||||||||||||||||||||||||
| Other common shares retired | ( |
( |
( |
— | — | — | ( |
|||||||||||||||||||||||||||||||||||||
Employee share-based compensation |
— | — | — | — | — | |||||||||||||||||||||||||||||||||||||||
Other comprehensive income |
— | — | — | — | — | |||||||||||||||||||||||||||||||||||||||
Balance, December 31, 2021 |
( |
|||||||||||||||||||||||||||||||||||||||||||
| Net income | — | — | — | — | ||||||||||||||||||||||||||||||||||||||||
Cash dividends ($ |
— | — | — | ( |
— | — | ( |
|||||||||||||||||||||||||||||||||||||
| Common shares issued | — | — | — | |||||||||||||||||||||||||||||||||||||||||
| Common shares retired | ( |
( |
( |
— | — | — | ( |
|||||||||||||||||||||||||||||||||||||
Employee share-based compensation |
— | — | — | — | — | |||||||||||||||||||||||||||||||||||||||
Other comprehensive loss |
— | — | — | — | ( |
— | ( |
|||||||||||||||||||||||||||||||||||||
Balance, December 31, 2022 |
$ | $ | $ | $ | ( |
$ | $ | |||||||||||||||||||||||||||||||||||||
See Notes to Consolidated Financial Statements
48
| DELUXE CORPORATION CONSOLIDATED STATEMENTS OF CASH FLOWS | ||
| Year Ended December 31, | ||||||||||||||||||||
| (in thousands) | 2022 | 2021 | 2020 | |||||||||||||||||
| Cash flows from operating activities: | ||||||||||||||||||||
| Net income | $ | $ | $ | |||||||||||||||||
Adjustments to reconcile net income to net cash provided by operating activities: |
||||||||||||||||||||
| Depreciation | ||||||||||||||||||||
| Amortization of intangibles | ||||||||||||||||||||
| Operating lease expense | ||||||||||||||||||||
| Asset impairment charges | ||||||||||||||||||||
| Amortization of prepaid product discounts | ||||||||||||||||||||
| Deferred income taxes | ( |
( |
||||||||||||||||||
| Employee share-based compensation expense | ||||||||||||||||||||
| (Gain) loss on sale of businesses and facility | ( |
|||||||||||||||||||
| Other non-cash items, net | ||||||||||||||||||||
| Changes in assets and liabilities, net of effect of acquisition: | ||||||||||||||||||||
| Trade accounts receivable | ( |
( |
( |
|||||||||||||||||
| Inventories and supplies | ( |
( |
( |
|||||||||||||||||
| Other current assets | ( |
( |
||||||||||||||||||
| Payments for cloud computing arrangement implementation costs | ( |
( |
( |
|||||||||||||||||
| Other non-current assets | ( |
( |
( |
|||||||||||||||||
| Accounts payable | ( |
|||||||||||||||||||
| Prepaid product discount payments | ( |
( |
( |
|||||||||||||||||
| Other accrued and non-current liabilities | ( |
( |
( |
|||||||||||||||||
| Net cash provided by operating activities | ||||||||||||||||||||
| Cash flows from investing activities: | ||||||||||||||||||||
| Purchases of capital assets | ( |
( |
( |
|||||||||||||||||
| Payment for acquisition, net of cash, cash equivalents, restricted cash and restricted cash equivalents acquired | ( |
|||||||||||||||||||
| Purchases of customer lists | ( |
( |
( |
|||||||||||||||||
| Proceeds from sale of businesses and facilities | ||||||||||||||||||||
| Purchases of customer funds debt securities | ( |
( |
( |
|||||||||||||||||
| Proceeds from customer funds debt securities | ||||||||||||||||||||
| Other | ( |
|||||||||||||||||||
| Net cash used by investing activities | ( |
( |
( |
|||||||||||||||||
| Cash flows from financing activities: | ||||||||||||||||||||
| Proceeds from issuing long-term debt and swingline loans | ||||||||||||||||||||
| Payments on long-term debt and swingline loans | ( |
( |
( |
|||||||||||||||||
| Payments for debt issuance costs | ( |
|||||||||||||||||||
| Net change in customer funds obligations | ( |
|||||||||||||||||||
| Proceeds from issuing shares | ||||||||||||||||||||
| Payments for common shares repurchased | ( |
|||||||||||||||||||
| Cash dividends paid to shareholders | ( |
( |
( |
|||||||||||||||||
| Other | ( |
( |
( |
|||||||||||||||||
| Net cash (used) provided by financing activities | ( |
( |
||||||||||||||||||
| Effect of exchange rate change on cash, cash equivalents, restricted cash and restricted cash equivalents | ( |
( |
||||||||||||||||||
| Net change in cash, cash equivalents, restricted cash and restricted cash equivalents | ||||||||||||||||||||
| Cash, cash equivalents, restricted cash and restricted cash equivalents, beginning of year | ||||||||||||||||||||
| Cash, cash equivalents, restricted cash and restricted cash equivalents, end of year (Note 3) | $ | $ | $ | |||||||||||||||||
See Notes to Consolidated Financial Statements
49
|
DELUXE CORPORATION
NOTES TO CONSOLIDATED FINANCIAL STATEMENTS
(dollars in thousands, except per share amounts)
| ||
| NOTE 1: SIGNIFICANT ACCOUNTING POLICIES | ||
Consolidation – The consolidated financial statements include the accounts of Deluxe Corporation and its wholly-owned subsidiaries. All intercompany accounts, transactions and profits have been eliminated.
On April 1, 2020, we executed an agreement to form MedPayExchange LLC (MPX), doing business as Medical Payment Exchange, which delivers payments to healthcare providers from insurance companies and other payers. This entity is a variable interest entity (VIE), as defined in Accounting Standards Codification (ASC) Topic 810, Consolidation. As we are the primary beneficiary of the VIE, we are required to consolidate MPX in our consolidated financial statements. Our partner's interest in MPX is reported as non-controlling interest in the consolidated balance sheets within equity, separate from our equity. Net income and comprehensive income are attributed to us and the non-controlling interest. The amounts attributable to the non-controlling interest were not significant to our consolidated financial statements.
50
|
DELUXE CORPORATION
NOTES TO CONSOLIDATED FINANCIAL STATEMENTS
(dollars in thousands, except per share amounts)
| ||
Funds held for customers – Our payroll services business collects funds from clients to pay their payroll and related taxes. We hold these funds temporarily until payments are remitted to the clients' employees and the appropriate taxing authorities. Our merchant services business temporarily holds funds collected from credit card networks and internet transaction processing on behalf of certain merchants, and our treasury management cash receipt processing business remits a portion of cash receipts to our clients the business day following receipt. Certain of our customer contracts include legal restrictions regarding the use of these funds.
All of these funds, consisting of cash and available-for-sale debt securities, are reported as funds held for customers on the consolidated balance sheets. The corresponding liability for these obligations is also reported as funds held for customers on the consolidated balance sheets. The available-for-sale debt securities are carried at fair value, with unrealized gains and losses included in accumulated other comprehensive loss on the consolidated balance sheets. Realized gains and losses are included in revenue on the consolidated statements of income and were not significant during the past 3 years.
Property, plant and equipment – Property, plant and equipment, including leasehold and other improvements that extend an asset's useful life or productive capabilities, are stated at historical cost less accumulated depreciation. Buildings have been assigned useful lives of 40 years and machinery and equipment are generally assigned useful lives ranging from 1 year to 11 years, with a weighted-average useful life of 7 years as of December 31, 2022. Buildings are depreciated using the 150% declining balance method, and machinery and equipment is depreciated using the sum-of-the-years' digits method. Leasehold and building improvements are depreciated on the straight-line basis over the estimated useful life of the property or the life of the lease, whichever is shorter. Amortization of assets that are recorded under finance leases is included in depreciation expense. Maintenance and repairs are expensed as incurred.
Fully depreciated assets are retained in property, plant and equipment until disposal. Any gains or losses resulting from the disposition of property, plant and equipment are included in SG&A expense on the consolidated statements of income.
51
|
DELUXE CORPORATION
NOTES TO CONSOLIDATED FINANCIAL STATEMENTS
(dollars in thousands, except per share amounts)
| ||
circumstances warrant a revision to the remaining period of amortization. If our estimate of an asset's remaining useful life is revised, the remaining carrying amount of the asset is amortized prospectively over the revised remaining useful life. Any gains or losses resulting from the disposition of intangibles are included in SG&A expense on the consolidated statements of income.
We capitalize costs of software developed or obtained for internal use, including website development costs, once the preliminary project stage has been completed, management commits to funding the project and it is probable that the project will be completed and the software will be used to perform the function intended. Capitalized costs include only (1) external direct costs of materials and services consumed in developing or obtaining internal-use software, (2) payroll and payroll-related costs for employees who are directly associated with and who devote time to the internal-use software project, and (3) interest costs incurred, when significant, while developing internal-use software. Costs incurred in populating websites with information about the company or products are expensed as incurred. Capitalization of costs ceases when the project is substantially complete and ready for its intended use. The carrying value of internal-use software is reviewed in accordance with our policy on impairment of long-lived assets and amortizable intangibles.
We incur costs in connection with the development of certain software products that we sell to our customers. Costs for the development of software products to be sold are expensed as incurred until technological feasibility is established, at which time, such costs are capitalized until the product is available for general release to customers.
Impairment of long-lived assets and amortizable intangibles – We evaluate the recoverability of property, plant, equipment and amortizable intangibles not held for sale whenever events or changes in circumstances indicate that an asset group's carrying amount may not be recoverable. Such circumstances could include, but are not limited to, (1) a significant decrease in the market value of an asset, (2) a significant adverse change in the extent or manner in which an asset is used or in its physical condition, or (3) an accumulation of costs significantly in excess of the amount originally expected for the acquisition or construction of an asset. We compare the carrying amount of the asset group to the estimated undiscounted future cash flows associated with it. If the sum of the expected future net cash flows is less than the carrying value of the asset group being evaluated, an impairment loss is recognized. The impairment loss is calculated as the amount by which the carrying value of the asset group exceeds its estimated fair value. As quoted market prices are not available for the majority of our assets, the estimate of fair value is based on various valuation techniques, including the discounted value of estimated future cash flows. During 2020, we recorded asset impairment charges related to certain intangible assets. Further information regarding these impairment charges can be found in Note 8.
We evaluate the recoverability of property, plant, equipment and intangibles held for sale by comparing the asset group's carrying amount with its estimated fair value less costs to sell. If the estimated fair value less costs to sell is less than the carrying value of the asset group, an impairment loss is recognized. The impairment loss is calculated as the amount by which the carrying value of the asset group exceeds its estimated fair value less costs to sell. During 2020, we recorded asset impairment charges related to certain real estate and internal-use software assets held for sale. Further information regarding these impairment charges can be found in Note 8.
The evaluation of asset impairment requires us to make assumptions about future cash flows over the life of the asset group being evaluated. These assumptions require judgment and actual results may differ from assumed and estimated amounts.
Impairment of goodwill – We evaluate the carrying value of goodwill as of July 31st of each year and between annual evaluations if events occur or circumstances change that would indicate a possible impairment. Such circumstances could include, but are not limited to, (1) a significant adverse change in legal factors or in business climate, (2) unanticipated competition, (3) an adverse change in market conditions that is indicative of a decline in the fair value of the assets, (4) a change in our business strategy, or (5) an adverse action or assessment by a regulator. Information regarding the results of our goodwill impairment analyses can be found in Note 8.
To analyze goodwill for impairment, we must assign our goodwill to individual reporting units. Identification of reporting units includes an analysis of the components that comprise each of our operating segments, which considers, among other
52
|
DELUXE CORPORATION
NOTES TO CONSOLIDATED FINANCIAL STATEMENTS
(dollars in thousands, except per share amounts)
| ||
things, the manner in which we operate our business and the availability of discrete financial information. Components of an operating segment are aggregated to form a reporting unit if the components have similar economic characteristics. We periodically review our reporting units to ensure that they continue to reflect the manner in which we operate our business.
When completing our annual goodwill impairment analysis, we have the option to first assess qualitative factors to determine whether the existence of events or circumstances leads to a determination that it is more likely than not that the fair value of a reporting unit is less than its carrying amount. If, after this qualitative assessment, we determine it is not more likely than not that the fair value of a reporting unit is less than its carrying amount, then performing the quantitative impairment test is unnecessary.
When performing a quantitative analysis of goodwill, we calculate the estimated fair value of the reporting unit and compare this amount to the carrying amount of the reporting unit's net assets, including goodwill. We utilize a discounted cash flow model to calculate the estimated fair value of a reporting unit. This approach is a valuation technique under which we estimate future cash flows using the reporting unit's financial forecast from the perspective of an unrelated market participant. Using historical trending and internal forecasting techniques, we project revenue and apply our fixed and variable cost experience rates to the projected revenue to arrive at the future cash flows. A terminal value is then applied to the projected cash flow stream. Future estimated cash flows are discounted to their present value to calculate the estimated fair value. The discount rate used is the market-value-weighted average of our estimated cost of capital derived using both known and estimated customary market metrics. In determining the estimated fair values of our reporting units, we are required to estimate a number of factors, including revenue growth rates, terminal growth rates, direct costs, the discount rate and the allocation of shared and corporate items. When completing a quantitative analysis for all of our reporting units, the summation of our reporting units' fair values is compared to our consolidated fair value, as indicated by our market capitalization, to evaluate the reasonableness of our calculations. If the carrying amount of a reporting unit's net assets exceeds its estimated fair value, an impairment loss is recorded for the difference, not to exceed the carrying amount of goodwill.
Loans and notes receivable from distributors – We have, at times, provided loans to certain of our Promotional Solutions distributors to allow them to purchase the operations of other small business distributors. We have also sold distributors and small business customer lists that we own in exchange for notes receivable. These loans and notes receivable are included in other current assets and other non-current assets on the consolidated balance sheets. Interest rates on these receivables generally range from 6 % to 7 % and reflect market interest rates at the time the transactions were executed. Interest is accrued as earned. Accrued interest included in loans and notes receivable was not significant as of December 31, 2022 or December 31, 2021.
In determining the allowance for credit losses related to loans and notes receivable, we utilize a loss-rate analysis based on historical loss information, current delinquency rates, the credit quality of the loan recipients and the portfolio mix to determine an appropriate credit risk measurement, adjusted to reflect current loan-specific risk characteristics and changes in environmental conditions affecting our small business distributors. Changes in conditions that may affect our distributors include, but are not limited to, general economic conditions, changes in the markets for their products and services and changes in governmental regulations. In completing our analysis, we utilize a reversion methodology for periods beyond the reasonable and supportable forecast period, as many of our loans and notes receivable have longer terms. Allowances for impaired loans are generally determined based on collateral values or the present value of estimated cash flows. Further information regarding our allowance for credit losses can be found in Note 3.
53
|
DELUXE CORPORATION
NOTES TO CONSOLIDATED FINANCIAL STATEMENTS
(dollars in thousands, except per share amounts)
| ||
Income taxes – We estimate our income tax provision based on the various jurisdictions where we conduct business. We estimate our current tax liability and record deferred income taxes resulting from temporary differences between the financial reporting basis of assets and liabilities and their respective tax reporting bases. Deferred tax assets and liabilities are measured using enacted tax rates expected to apply to taxable income in the years in which those temporary differences reverse. Net deferred tax assets are recognized to the extent that realization of such benefits is more likely than not. To the extent that we believe realization is not likely, we establish a valuation allowance against the net deferred tax assets.
We are subject to tax audits in numerous domestic and foreign tax jurisdictions. Tax audits are often complex and can require several years to complete. In the normal course of business, we are subject to challenges from the Internal Revenue Service and other tax authorities regarding the amount of taxes due. These challenges may alter the timing or amount of taxable income or deductions, or the allocation of income among tax jurisdictions. We recognize the benefits of tax return positions in the financial statements when they are more likely than not to be sustained by the taxing authorities based solely on the technical merits of the position. If the recognition threshold is met, the tax benefit is measured and recognized as the largest amount of tax benefit that, in our judgment, is greater than 50 % likely to be realized. Accrued interest and penalties related to unrecognized tax positions is included in our provision for income taxes on the consolidated statements of income.
Derivative financial instruments – We have outstanding interest rate swaps related to our variable-rate debt. Further Information regarding these derivative financial instruments can be found in Note 7.
We do not use derivative financial instruments for speculative or trading purposes. Our policy is that all derivative transactions must be linked to an existing balance sheet item or firm commitment, and the notional amount cannot exceed the value of the exposure being hedged.
We recognize all derivative financial instruments in the consolidated financial statements at fair value regardless of the purpose or intent for holding the instrument. Changes in the fair value of derivative financial instruments are recognized periodically either in income or in shareholders' equity as a component of accumulated other comprehensive loss, depending on whether the derivative financial instrument qualifies for hedge accounting, and if so, whether it qualifies as a fair value hedge or a cash flow hedge and whether the hedge is effective. Generally, changes in the fair value of derivatives accounted for as fair value hedges are recorded in income along with the portion of the change in the fair value of the hedged items that relate to the hedged risk. Changes in the fair value of derivatives accounted for as cash flow hedges, to the extent they are effective as hedges, are recorded in accumulated other comprehensive loss, net of tax. We classify the cash flows from derivative instruments that have been designated as fair value or cash flow hedges in the same category as the cash flows from the items being hedged. Changes in the fair value of derivatives not qualifying as hedges and the ineffective portion of hedges are included in net income.
54
|
DELUXE CORPORATION
NOTES TO CONSOLIDATED FINANCIAL STATEMENTS
(dollars in thousands, except per share amounts)
| ||
Revenue recognition – Product revenue is recognized when control of the goods is transferred to our customers, in an amount that reflects the consideration we expect to be entitled to in exchange for those goods. In most cases, control is transferred when products are shipped. We have elected to account for shipping and handling activities that occur after the customer has obtained control of the product as fulfillment activities and not as separate performance obligations. We recognize the vast majority of our service revenue as services are provided. The majority of our contracts are for the shipment of tangible products or the delivery of services that have a single performance obligation or include multiple performance obligations where control is transferred at the same time.
Revenue is presented on the consolidated statements of income net of rebates, discounts, amortization of prepaid product discounts, and taxes collected concurrent with revenue-producing activities. Many of our check supply contracts with financial institutions provide for rebates on certain products. We record these rebates as reductions of revenue and as accrued liabilities on the consolidated balance sheets when the related revenue is recognized. Amounts billed to customers for shipping and handling are included in revenue, while the related shipping and handling costs are reflected in cost of products and are accrued when the related revenue is recognized.
When another party is involved in providing goods or services to a customer, we must determine whether our obligation is to provide the specified good or service itself (i.e., we are the principal in the transaction) or to arrange for that good or service to be provided by the other party (i.e., we are an agent in the transaction). When we are responsible for satisfying a performance obligation, based on our ability to control the product or service provided, we are considered the principal and revenue is recognized for the gross amount of consideration. When the other party is primarily responsible for satisfying a performance obligation, we are considered the agent and revenue is recognized in the amount of any fee or commission to which we are entitled. We sell certain products and services through a network of distributors. We have determined that we are the principal in these transactions, and revenue is recorded for the gross amount of consideration.
Certain of our contracts for data-driven marketing solutions have variable consideration that is contingent on the success of the marketing campaign ("pay-for-performance"). We recognize revenue for estimated variable consideration as services are provided based on the most likely amount to be realized. Revenue is recognized to the extent that it is probable that a significant reversal of revenue will not occur when the contingency is resolved. Estimates regarding the recognition of variable consideration are updated each quarter. Typically, the amount of consideration for these contracts is finalized within 4 months.
Our payment terms vary by type of customer and the products or services offered. The time period between invoicing and when payment is due is not significant. For certain products, services and customer types, we require payment before the products or services are delivered to the customer. When a customer pays in advance, primarily for treasury management solutions and web hosting services, we defer the revenue and recognize it as the services are performed, generally over a period of less than 1 year. Deferred revenue is included in accrued liabilities and other non-current liabilities on the consolidated balance sheets.
In addition to the amounts included in deferred revenue, we will recognize revenue in future periods related to remaining performance obligations for certain of our data-driven marketing and treasury management solutions contracts. Generally, these contracts have terms of 1 year or less and many have terms of 3 months or less, and therefore, we do not consider any potential financing component. The amount of revenue related to these unsatisfied performance obligations is not significant to our annual consolidated revenue. When the revenue recognized for uncompleted contracts exceeds the amount of customer billings and the right to receive the consideration is conditional, a contract asset is recorded. These amounts are included in revenue in excess of billings on the consolidated balance sheets. Additionally, we record an asset for unbilled receivables when the revenue recognized has not been billed to customers in accordance with contractually stated billing terms and the right to receive the consideration is unconditional. These amounts are also included in revenue in excess of billings on the consolidated balance sheets.
We record sales commissions related to obtaining check supply and treasury management solution contracts, as well as contract acquisition costs within our merchant services business, as other non-current assets on the consolidated balance sheets. These contract acquisition costs are amortized as SG&A expense on the straight-line basis, which approximates the timing of the transfer of goods or services to the customer. These amounts are being amortized over periods of 2 years to 5 years. We expense contract acquisition costs as incurred when the amortization period would be 1 year or less.
55
|
DELUXE CORPORATION
NOTES TO CONSOLIDATED FINANCIAL STATEMENTS
(dollars in thousands, except per share amounts)
| ||
Employee share-based compensation – Our share-based compensation consists of non-qualified stock options, restricted stock units, restricted stock, performance share unit awards and an employee stock purchase plan. Employee share-based compensation expense is included in total cost of revenue and in SG&A expense on the consolidated statements of income, based on the functional areas of the employees receiving the awards, and is recognized as follows:
•The fair value of stock options is measured on the grant date using the Black-Scholes option pricing model. The related compensation expense is recognized on the straight-line basis, net of estimated forfeitures, over the options' vesting periods.
•The fair value of restricted stock and a portion of our restricted stock unit awards is measured on the grant date based on the market value of our common stock. The related compensation expense, net of estimated forfeitures, is recognized over the applicable service period.
•Certain of our restricted stock unit awards may be settled in cash if an employee voluntarily chooses to leave the company. These awards are included in accrued liabilities and other non-current liabilities on the consolidated balance sheets and are remeasured at fair value as of each balance sheet date.
•Compensation expense resulting from the 15 % discount provided under our employee stock purchase plan is recognized over each 3 month purchase period.
•Our performance share unit awards specify certain performance and market-based conditions that must be achieved in order for the awards to vest. For the portion of the awards based on a performance condition, the performance target is not considered in determining the fair value of the awards and thus, fair value is measured on the grant date based on the market value of our common stock. The related compensation expense for this type of award is recognized, net of estimated forfeitures, over the related service period. The amount of compensation expense is dependent on our periodic assessment of the probability of the targets being achieved and our estimate, which may vary over time, of the number of shares that ultimately will be issued. For the portion of the awards based on a market condition, fair value is calculated on the grant date using the Monte Carlo simulation model. All compensation cost for these awards is recognized, net of estimated forfeitures, over the related service period, even if the market condition is never satisfied.
Postretirement benefit plan – We have historically provided certain health care benefits for a large number of retired U.S. employees hired prior to January 1, 2002. Our postretirement benefit income and obligation are calculated utilizing various actuarial assumptions and methodologies. These assumptions include, but are not limited to, the discount rate, the expected long-term rate of return on plan assets, estimated medical claims, the expected health care cost trend rate and the average remaining life expectancy of plan participants. We analyze the assumptions used each year when we complete our actuarial valuation of the plan. When actual events differ from our assumptions or when we change the assumptions used, an actuarial gain or loss results. The gain or loss is recognized immediately on the consolidated balance sheets within accumulated other comprehensive loss and is amortized into postretirement benefit income over the average remaining life expectancy of inactive plan participants, as a large percentage of our plan participants are classified as inactive.
The valuation of our postretirement plan requires judgment about circumstances that are inherently uncertain, including projected equity market performance, the number of plan participants, catastrophic health care events for our plan participants and a significant change in medical costs. Actual results may differ from assumed and estimated amounts.
56
|
DELUXE CORPORATION
NOTES TO CONSOLIDATED FINANCIAL STATEMENTS
(dollars in thousands, except per share amounts)
| ||
| NOTE 2: NEW ACCOUNTING PRONOUNCEMENTS | ||
Accounting Standards Not Yet Adopted
Reference rate reform – In March 2020, the Financial Accounting Standards Board (FASB) issued Accounting Standards Update (ASU) No. 2020-04, Facilitation of the Effects of Reference Rate Reform on Financial Reporting. The Standard provides optional expedients and exceptions for applying GAAP to contracts, hedging relationships and other transactions affected by the discontinuation of the London Interbank Offered Rate (LIBOR) or by another reference rate expected to be discontinued because of reference rate reform. In January 2021, the FASB issued ASU No 2021-01, Reference Rate Reform (Topic 848): Scope, which clarified the scope and application of the original guidance. We are currently in the process of modifying our existing credit facility to utilize the Secured Overnight Financing Rate (SOFR) as the reference rate in the agreement, effective March 20, 2023. In accounting for this modification, we will be adopting the reference rate reform guidance on a prospective basis as allowed under the provisions of ASU No. 2022-06, Deferral of the Sunset Date of Topic 848. The adoption of these standards is not expected to have a material impact on our consolidated financial statements.
ASU No. 2022-02 – In March 2022, the FASB issued ASU No. 2022-02, Troubled Debt Restructurings and Vintage Disclosures. The standard modifies the accounting for troubled debt restructurings by creditors and modifies certain disclosure requirements. The guidance will be applied prospectively, with the exception of the recognition and measurement of troubled debt restructurings, for which we may elect to apply a modified retrospective transition method. The standard is effective for us on January 1, 2023, and we do not expect its adoption to have a significant impact on our financial position or results of operations.
| NOTE 3: SUPPLEMENTAL BALANCE SHEET AND CASH FLOW INFORMATION | ||
Trade accounts receivable – Net trade accounts receivable was comprised of the following at December 31:
| (in thousands) | 2022 | 2021 | ||||||||||||
| Trade accounts receivable – gross | $ | $ | ||||||||||||
| Allowance for credit losses | ( |
( |
||||||||||||
Trade accounts receivable – net(1)
|
$ | $ | ||||||||||||
(1) Includes unbilled receivables of $43,902 as of December 31, 2022 and $47,420 as of December 31, 2021.
Changes in the allowance for credit losses for the years ended December 31 were as follows:
| (in thousands) | 2022 | 2021 | 2020 | |||||||||||||||||
| Balance, beginning of year | $ | $ | $ | |||||||||||||||||
| Bad debt expense | ||||||||||||||||||||
| Write-offs and other | ( |
( |
( |
|||||||||||||||||
| Balance, end of year | $ | $ | $ | |||||||||||||||||
Inventories and supplies – Inventories and supplies were comprised of the following at December 31:
| (in thousands) | 2022 | 2021 | ||||||||||||
| Raw materials | $ | $ | ||||||||||||
| Semi-finished goods | ||||||||||||||
| Finished goods | ||||||||||||||
| Supplies | ||||||||||||||
| Reserve for excess and obsolete items | ( |
( |
||||||||||||
| Inventories and supplies, net of reserves | $ | $ | ||||||||||||
57
|
DELUXE CORPORATION
NOTES TO CONSOLIDATED FINANCIAL STATEMENTS
(dollars in thousands, except per share amounts)
| ||
Changes in the reserve for excess and obsolete items for the years ended December 31 were as follows:
| (in thousands) | 2022 | 2021 | 2020 | |||||||||||||||||
| Balance, beginning of year | $ | $ | $ | |||||||||||||||||
| Amounts charged to expense | ||||||||||||||||||||
| Write-offs and sales | ( |
( |
( |
|||||||||||||||||
| Balance, end of year | $ | $ | $ | |||||||||||||||||
Available-for-sale debt securities – Available-for-sale debt securities were comprised of the following:
| December 31, 2022 | ||||||||||||||||||||||||||
| (in thousands) | Cost | Gross unrealized gains | Gross unrealized losses | Fair value | ||||||||||||||||||||||
| Cash equivalents: | ||||||||||||||||||||||||||
| Domestic money market fund | $ | $ | $ | $ | ||||||||||||||||||||||
Funds held for customers:(1)
|
||||||||||||||||||||||||||
| Canadian and provincial government securities | ( |
|||||||||||||||||||||||||
| Available-for-sale debt securities | $ | $ | $ | ( |
$ | |||||||||||||||||||||
(1) Funds held for customers, as reported on the consolidated balance sheet as of December 31, 2022, also included cash of $294,165 .
| December 31, 2021 | ||||||||||||||||||||||||||
| (in thousands) | Cost | Gross unrealized gains | Gross unrealized losses | Fair value | ||||||||||||||||||||||
Funds held for customers:(1)
|
||||||||||||||||||||||||||
| Canadian and provincial government securities | $ | $ | $ | ( |
$ | |||||||||||||||||||||
| Canadian guaranteed investment certificate | ||||||||||||||||||||||||||
| Available-for-sale debt securities | $ | $ | $ | ( |
$ | |||||||||||||||||||||
(1) Funds held for customers, as reported on the consolidated balance sheet as of December 31, 2021, also included cash of $241,488 .
Expected maturities of available-for-sale debt securities as of December 31, 2022 were as follows:
| (in thousands) | Fair value | |||||||
| Due in one year or less | $ | |||||||
| Due in two to five years | ||||||||
| Due in six to ten years | ||||||||
| Available-for-sale debt securities | $ | |||||||
Further information regarding the fair value of available-for-sale debt securities can be found in Note 8.
Revenue in excess of billings – Revenue in excess of billings was comprised of the following at December 31:
| (in thousands) | 2022 | 2021 | ||||||||||||
| Conditional right to receive consideration | $ | $ | ||||||||||||
Unconditional right to receive consideration(1)
|
||||||||||||||
| Revenue in excess of billings | $ | $ | ||||||||||||
(1) Represents revenues that are earned but not currently billable under the related contract terms.
58
|
DELUXE CORPORATION
NOTES TO CONSOLIDATED FINANCIAL STATEMENTS
(dollars in thousands, except per share amounts)
| ||
Property, plant and equipment – Property, plant and equipment was comprised of the following at December 31:
| 2022 | 2021 | |||||||||||||||||||||||||||||||||||||
| (in thousands) | Gross carrying amount | Accumulated depreciation | Net carrying amount | Gross carrying amount | Accumulated depreciation | Net carrying amount | ||||||||||||||||||||||||||||||||
| Machinery and equipment | $ | $ | ( |
$ | $ | $ | ( |
$ | ||||||||||||||||||||||||||||||
| Buildings and improvements | ( |
( |
||||||||||||||||||||||||||||||||||||
| Land and improvements | ( |
( |
||||||||||||||||||||||||||||||||||||
Property, plant and equipment |
$ | $ | ( |
$ | $ | $ | ( |
$ | ||||||||||||||||||||||||||||||
Intangibles – Amortizable intangibles were comprised of the following at December 31:
| 2022 | 2021 | |||||||||||||||||||||||||||||||||||||
| (in thousands) | Gross carrying amount | Accumulated amortization | Net carrying amount | Gross carrying amount | Accumulated amortization | Net carrying amount | ||||||||||||||||||||||||||||||||
| Internal-use software | $ | $ | ( |
$ | $ | $ | ( |
$ | ||||||||||||||||||||||||||||||
| Customer lists/relationships | ( |
( |
||||||||||||||||||||||||||||||||||||
| Technology-based intangibles | ( |
( |
||||||||||||||||||||||||||||||||||||
| Partner relationships | ( |
( |
||||||||||||||||||||||||||||||||||||
| Trade names | ( |
( |
||||||||||||||||||||||||||||||||||||
| Software to be sold | ( |
( |
||||||||||||||||||||||||||||||||||||
| Intangibles | $ | $ | ( |
$ | $ | $ | ( |
$ | ||||||||||||||||||||||||||||||
Amortization expense related to intangibles was as follows for the years ended December 31:
| (in thousands) | 2022 | 2021 | 2020 | |||||||||||||||||
| Customer lists/relationships | $ | $ | $ | |||||||||||||||||
| Internal-use software | ||||||||||||||||||||
| Technology-based intangibles | ||||||||||||||||||||
| Partner relationships | ||||||||||||||||||||
| Software to be sold | ||||||||||||||||||||
| Trade names | ||||||||||||||||||||
| Amortization of intangibles | $ | $ | $ | |||||||||||||||||
Based on the intangibles in service as of December 31, 2022, estimated amortization expense for each of the next five years ending December 31 is as follows:
| (in thousands) | Estimated amortization expense |
|||||||
| 2023 | $ | |||||||
| 2024 | ||||||||
| 2025 | ||||||||
| 2026 | ||||||||
| 2027 | ||||||||
59
|
DELUXE CORPORATION
NOTES TO CONSOLIDATED FINANCIAL STATEMENTS
(dollars in thousands, except per share amounts)
| ||
We acquire internal-use software and certain partner relationships in the normal course of business. We also purchased customer lists, and we acquired other intangible assets in conjunction with an acquisition (Note 6). The following intangible assets were acquired during the years ended December 31:
| 2022 | 2021 | 2020 | ||||||||||||||||||||||||||||||||||||
| (in thousands) | Amount |
Weighted-average amortization period
(in years)
|
Amount |
Weighted-average amortization period
(in years)
|
Amount |
Weighted-average amortization period
(in years)
|
||||||||||||||||||||||||||||||||
| Internal-use software | $ | $ | $ | |||||||||||||||||||||||||||||||||||
Customer lists/relationships(1)
|
||||||||||||||||||||||||||||||||||||||
| Partner relationships | — | |||||||||||||||||||||||||||||||||||||
| Technology-based intangibles | — | — | ||||||||||||||||||||||||||||||||||||
| Trade names | — | — | ||||||||||||||||||||||||||||||||||||
| Acquired intangibles | $ | $ | $ | |||||||||||||||||||||||||||||||||||
(1) We acquired customer lists that did not qualify as business combinations of $18,267 during 2022, $22,642 during 2021 and $45,470 during 2020.
Goodwill – Changes in goodwill by reportable business segment and in total were as follows:
| (in thousands) | Payments | Data Solutions | Promotional Solutions | Checks | Total | |||||||||||||||||||||||||||
Balance, December 31, 2020: |
||||||||||||||||||||||||||||||||
| Goodwill, gross | $ | $ | $ | $ | $ | |||||||||||||||||||||||||||
| Accumulated impairment charges | ( |
( |
( |
|||||||||||||||||||||||||||||
| Goodwill, net of accumulated impairment charges | ||||||||||||||||||||||||||||||||
Goodwill resulting from acquisition (Note 6) |
— | — | — | |||||||||||||||||||||||||||||
| Currency translation adjustment | — | — | — | |||||||||||||||||||||||||||||
Balance, December 31, 2021 |
$ | $ | $ | $ | $ | |||||||||||||||||||||||||||
Balance, December 31, 2021: |
||||||||||||||||||||||||||||||||
| Goodwill, gross | $ | $ | $ | $ | $ | |||||||||||||||||||||||||||
| Accumulated impairment charges | ( |
( |
( |
|||||||||||||||||||||||||||||
| Goodwill, net of accumulated impairment charges | ||||||||||||||||||||||||||||||||
Measurement-period adjustment (Note 6) |
— | — | — | |||||||||||||||||||||||||||||
| Currency translation adjustment | — | — | ( |
— | ( |
|||||||||||||||||||||||||||
Balance, December 31, 2022 |
$ | $ | $ | $ | $ | |||||||||||||||||||||||||||
Balance, December 31, 2022: |
||||||||||||||||||||||||||||||||
| Goodwill, gross | $ | $ | $ | $ | $ | |||||||||||||||||||||||||||
| Accumulated impairment charges | ( |
( |
( |
|||||||||||||||||||||||||||||
| Goodwill, net of accumulated impairment charges | $ | $ | $ | $ | $ | |||||||||||||||||||||||||||
60
|
DELUXE CORPORATION
NOTES TO CONSOLIDATED FINANCIAL STATEMENTS
(dollars in thousands, except per share amounts)
| ||
Other non-current assets – Other non-current assets were comprised of the following at December 31:
| (in thousands) | 2022 | 2021 | ||||||||||||
| Postretirement benefit plan asset (Note 12) | $ | $ | ||||||||||||
| Cloud computing arrangement implementation costs | ||||||||||||||
| Prepaid product discounts | ||||||||||||||
Deferred contract acquisition costs(1)
|
||||||||||||||
Loans and notes receivable from distributors, net of allowance for credit losses(2)
|
||||||||||||||
| Other | ||||||||||||||
| Other non-current assets | $ | $ | ||||||||||||
(1) Amortization of deferred contract acquisition costs was $8,206 for 2022, $4,975 for 2021 and $3,739 for 2020.
(2) Amount includes the non-current portion of loans and notes receivable. The current portion of these receivables is included in other current assets on the consolidated balance sheets and was $961 as of December 31, 2022 and $1,317 as of December 31, 2021.
Changes in prepaid product discounts were as follows for the years ended December 31:
| (in thousands) | 2022 | 2021 | 2020 | |||||||||||||||||
| Balance, beginning of year | $ | $ | $ | |||||||||||||||||
Additions(1)
|
||||||||||||||||||||
| Amortization | ( |
( |
( |
|||||||||||||||||
| Other | ( |
( |
( |
|||||||||||||||||
| Balance, end of year | $ | $ | $ | |||||||||||||||||
(1) Prepaid product discounts are generally accrued upon contract execution. Cash payments made for prepaid product discounts were $30,603 for 2022, $40,920 for 2021 and $33,613 for 2020.
Changes in the allowance for credit losses related to loans and notes receivable from distributors for the years ended December 31 were as follows:
| (in thousands) | 2022 | 2021 | 2020 | |||||||||||||||||
| Balance, beginning of year | $ | $ | $ | |||||||||||||||||
| Adoption of ASU No. 2016-13 | — | — | ||||||||||||||||||
| Bad debt expense (benefit) | ( |
|||||||||||||||||||
| Exchange for customer lists | ( |
( |
||||||||||||||||||
| Write-offs | ( |
( |
||||||||||||||||||
| Balance, end of year | $ | $ | $ | |||||||||||||||||
Bad debt expense for 2020 included loan-specific allowances primarily related to Promotional Solutions distributors that were underperforming. In calculating these reserves, we utilized various valuation techniques to determine the value of the underlying collateral. During the quarter ended September 30, 2020, these notes receivable were exchanged for the underlying collateral, which consisted of customer list intangible assets.
We categorize loans and notes receivable into risk categories based on information about the ability of the borrowers to service their debt, including current financial information, historical payment experience, current economic trends and other factors. The highest quality receivables are assigned a 1-2 internal grade. Those that have a potential weakness requiring management's attention are assigned a 3-4 internal grade.
61
|
DELUXE CORPORATION
NOTES TO CONSOLIDATED FINANCIAL STATEMENTS
(dollars in thousands, except per share amounts)
| ||
The following table presents loans and notes receivable from distributors, including the current portion, by credit quality indicator and by year of origination, as of December 31, 2022. Write-offs of $2,599 for the year ended December 31, 2022 related to loans and notes receivable originated in 2019.
| Loans and notes receivable from distributors amortized cost basis by origination year | ||||||||||||||||||||||||||||||||
| (in thousands) | 2020 | 2019 | 2018 | Prior | Total | |||||||||||||||||||||||||||
| Risk rating: | ||||||||||||||||||||||||||||||||
| 1-2 internal grade | $ | $ | $ | $ | $ | |||||||||||||||||||||||||||
| 3-4 internal grade | ||||||||||||||||||||||||||||||||
| Loans and notes receivable | $ | $ | $ | $ | $ | |||||||||||||||||||||||||||
Accrued liabilities – Accrued liabilities were comprised of the following at December 31:
| (in thousands) | 2022 | 2021 | ||||||||||||
Deferred revenue(1)
|
$ | $ | ||||||||||||
| Employee cash bonuses, including sales incentives | ||||||||||||||
| Wages and payroll liabilities, including vacation | ||||||||||||||
| Operating lease liabilities (Note 14) | ||||||||||||||
| Customer rebates | ||||||||||||||
| Prepaid product discounts due within one year | ||||||||||||||
| Other | ||||||||||||||
| Accrued liabilities | $ | $ | ||||||||||||
(1) Revenue recognized from amounts included in deferred revenue at the beginning of the period was $47,547 for 2022, $39,366 for 2021 and $42,108 for 2020.
Supplemental cash flow information – Supplemental cash flow information was as follows for the years ended December 31:
| (in thousands) | 2022 | 2021 | 2020 | |||||||||||||||||
Reconciliation of cash, cash equivalents, restricted cash and restricted cash equivalents to the consolidated balance sheets: |
||||||||||||||||||||
| Cash and cash equivalents | $ | $ | $ | |||||||||||||||||
Total cash, cash equivalents, restricted cash and restricted cash equivalents |
$ | $ | $ | |||||||||||||||||
| Interest paid | $ | $ | $ | |||||||||||||||||
| Income taxes paid | ||||||||||||||||||||
| Non-cash investing activities: | ||||||||||||||||||||
Non-cash consideration for customer list purchases(1)
|
$ | $ | $ | |||||||||||||||||
| Non-cash financing activities: | ||||||||||||||||||||
| Liabilities for holdback payments on asset purchases | $ | $ | $ | |||||||||||||||||
| Vesting of restricted stock unit awards | ||||||||||||||||||||
(1) Consists of pre-acquisition amounts owed to us by the sellers.
Information regarding operating and finance leases executed in each period can be found in Note 14.
62
|
DELUXE CORPORATION
NOTES TO CONSOLIDATED FINANCIAL STATEMENTS
(dollars in thousands, except per share amounts)
| ||
| NOTE 4: EARNINGS PER SHARE | ||
The following table reflects the calculation of basic and diluted earnings per share. During each period, certain stock options, as noted below, were excluded from the calculation of diluted earnings per share because their effect would have been antidilutive.
| (in thousands, except per share amounts) | 2022 | 2021 | 2020 | |||||||||||||||||
| Earnings per share – basic: | ||||||||||||||||||||
| Net income | $ | $ | $ | |||||||||||||||||
| Net income attributable to non-controlling interest | ( |
( |
( |
|||||||||||||||||
| Net income attributable to Deluxe | ||||||||||||||||||||
| Income allocated to participating securities | ( |
( |
( |
|||||||||||||||||
| Income attributable to Deluxe available to common shareholders | $ | $ | $ | |||||||||||||||||
| Weighted-average shares outstanding | ||||||||||||||||||||
| Earnings per share – basic | $ | $ | $ | |||||||||||||||||
| Earnings per share – diluted: | ||||||||||||||||||||
| Net income | $ | $ | $ | |||||||||||||||||
| Net income attributable to non-controlling interest | ( |
( |
( |
|||||||||||||||||
| Net income attributable to Deluxe | ||||||||||||||||||||
| Income allocated to participating securities | ( |
( |
( |
|||||||||||||||||
| Remeasurement of share-based awards classified as liabilities | ( |
( |
( |
|||||||||||||||||
| Income attributable to Deluxe available to common shareholders | $ | $ | $ | |||||||||||||||||
| Weighted-average shares outstanding | ||||||||||||||||||||
| Dilutive impact of potential common shares | ||||||||||||||||||||
Weighted-average shares and potential common shares outstanding |
||||||||||||||||||||
| Earnings per share – diluted | $ | $ | $ | |||||||||||||||||
| Antidilutive options excluded from calculation | ||||||||||||||||||||
63
|
DELUXE CORPORATION
NOTES TO CONSOLIDATED FINANCIAL STATEMENTS
(dollars in thousands, except per share amounts)
| ||
| NOTE 5: OTHER COMPREHENSIVE (LOSS) INCOME | ||
Reclassification adjustments – Information regarding amounts reclassified from accumulated other comprehensive loss to net income was as follows:
| Accumulated other comprehensive loss components | Amounts reclassified from accumulated other comprehensive loss | Affected line item in consolidated statements of income | ||||||||||||||||||||||||
| (in thousands) | 2022 | 2021 | 2020 | |||||||||||||||||||||||
Amortization of postretirement benefit plan items: |
||||||||||||||||||||||||||
| Prior service credit | $ | $ | $ | Other income | ||||||||||||||||||||||
| Net actuarial loss | ( |
( |
( |
Other income | ||||||||||||||||||||||
| Total amortization | ( |
( |
Other income | |||||||||||||||||||||||
| Tax (expense) benefit | ( |
( |
Income tax provision | |||||||||||||||||||||||
Amortization of postretirement benefit plan items, net of tax |
( |
( |
Net income | |||||||||||||||||||||||
| Debt securities: | ||||||||||||||||||||||||||
| Realized (loss) gain on debt securities | ( |
Service revenue | ||||||||||||||||||||||||
Tax benefit (expense) |
( |
Income tax provision | ||||||||||||||||||||||||
| Realized (loss) gain on debt securities, net of tax | ( |
Net income | ||||||||||||||||||||||||
| Cash flow hedges: | ||||||||||||||||||||||||||
Realized gain (loss) on cash flow hedges |
( |
( |
Interest expense | |||||||||||||||||||||||
Tax (expense) benefit |
( |
Income tax provision | ||||||||||||||||||||||||
Realized gain (loss) on cash flow hedges, net of tax |
( |
( |
Net income | |||||||||||||||||||||||
Foreign currency translation adjustment(1)
|
( |
Gain on sale of businesses and facility | ||||||||||||||||||||||||
Total reclassifications, net of tax |
$ | ( |
$ | ( |
$ | ( |
||||||||||||||||||||
(1) Relates to the sale of our Australian web hosting business during the quarter ended June 30, 2022. Further information can be found in Note 6.
64
|
DELUXE CORPORATION
NOTES TO CONSOLIDATED FINANCIAL STATEMENTS
(dollars in thousands, except per share amounts)
| ||
Accumulated other comprehensive loss – Changes in the components of accumulated other comprehensive loss were as follows:
| (in thousands) | Postretirement benefit plans | Net unrealized loss on debt securities | Net unrealized loss on cash flow hedges | Foreign currency translation adjustment | Accumulated other comprehensive loss | |||||||||||||||||||||||||||
Balance, December 31, 2019 |
$ | ( |
$ | ( |
$ | ( |
$ | ( |
$ | ( |
||||||||||||||||||||||
Other comprehensive income (loss) before reclassifications |
( |
|||||||||||||||||||||||||||||||
Amounts reclassified from accumulated other comprehensive loss |
( |
|||||||||||||||||||||||||||||||
Net other comprehensive income (loss) |
( |
|||||||||||||||||||||||||||||||
Balance, December 31, 2020 |
( |
( |
( |
( |
( |
|||||||||||||||||||||||||||
Other comprehensive income (loss) before reclassifications |
( |
|||||||||||||||||||||||||||||||
Amounts reclassified from accumulated other comprehensive loss |
||||||||||||||||||||||||||||||||
Net other comprehensive income (loss) |
( |
|||||||||||||||||||||||||||||||
Balance, December 31, 2021 |
( |
( |
( |
( |
( |
|||||||||||||||||||||||||||
Other comprehensive (loss) income before reclassifications |
( |
( |
( |
( |
||||||||||||||||||||||||||||
Amounts reclassified from accumulated other comprehensive loss |
( |
( |
||||||||||||||||||||||||||||||
Net other comprehensive (loss) income |
( |
( |
( |
|||||||||||||||||||||||||||||
Balance, December 31, 2022 |
$ | ( |
$ | ( |
$ | $ | ( |
$ | ( |
|||||||||||||||||||||||
| NOTE 6: ACQUISITION AND DIVESTITURES | ||
Acquisition – On June 1, 2021, we acquired all of the equity of First American Payment Systems, L.P. (First American) in a cash transaction for $958,514 , net of cash, cash equivalents, restricted cash and restricted cash equivalents acquired. First American is a large-scale payments technology company that provides partners and merchants with comprehensive in-store, online and mobile payment solutions. The transaction was funded by our revolving credit facility and additional debt we issued in June 2021 (Note 13). The acquisition resulted in non-deductible goodwill as First American provides an end-to-end payments technology platform, which provides significant leverage to accelerate organic growth. Transaction costs related to the acquisition totaled $18,913 in 2021. The goodwill and results of operations of First American from the date of acquisition are included in the Payments segment.
Information regarding goodwill by reportable business segment and the useful lives of acquired intangibles can be found in Note 3. Information regarding the calculation of the estimated fair values of the acquired intangibles can be found in Note 8.
65
|
DELUXE CORPORATION
NOTES TO CONSOLIDATED FINANCIAL STATEMENTS
(dollars in thousands, except per share amounts)
| ||
The acquisition was accounted for as a business combination and the allocation of the purchase price to the assets acquired and liabilities assumed was finalized during the quarter ended June 30, 2022. We recorded measurement period adjustments during 2022 that increased deferred income tax liabilities by $1,343
The following illustrates the final allocation of the purchase price, to the assets acquired and liabilities assumed:
| (in thousands) | Purchase price allocation | |||||||
| Trade accounts receivable | $ | |||||||
| Other current assets | ||||||||
| Property, plant and equipment | ||||||||
| Operating lease assets | ||||||||
| Intangible assets: | ||||||||
| Customer relationships | ||||||||
| Partner relationships | ||||||||
| Technology-based intangibles | ||||||||
| Trade names | ||||||||
| Internal-use software | ||||||||
| Total intangible assets | ||||||||
| Goodwill | ||||||||
| Other non-current assets | ||||||||
| Accounts payable | ( |
|||||||
| Funds held for customers | ( |
|||||||
| Accrued liabilities | ( |
|||||||
| Operating lease liabilities, non-current | ( |
|||||||
| Deferred income taxes | ( |
|||||||
| Other non-current liabilities | ( |
|||||||
Payment for acquisition, net of cash, cash equivalents, restricted cash and restricted cash equivalents acquired of $ |
$ | |||||||
Operating results for First American for the years ended December 31 were as follows:
| (in thousands) | 2022 | 2021 | |||||||||||||||
| Revenue | $ | $ | |||||||||||||||
| Net income attributable to Deluxe | |||||||||||||||||
The above results for the year ended December 31, 2022 include restructuring and integration costs of $5,452 in 2022.
Pro forma financial information (unaudited) – During the first quarter of 2022, we corrected errors in the previously reported unaudited pro forma results of operations related to the First American acquisition. These errors related to the amount of historical First American revenue and net income included for the pre-acquisition periods, as well as errors in the adjustments related to the amortization of intangibles, interest expense on the acquisition financing, and transaction costs. For the year ended December 31, 2021, these corrections decreased pro forma revenue by $26,335 and increased pro forma net income attributable to Deluxe by $10,138 . For the year ended December 31, 2020, the corrections decreased pro forma revenue by $3,027 and increased net loss attributable to Deluxe by $9,082 .
66
|
DELUXE CORPORATION
NOTES TO CONSOLIDATED FINANCIAL STATEMENTS
(dollars in thousands, except per share amounts)
| ||
The following unaudited pro forma financial information summarizes our consolidated results of operations for the years ended December 31 as though the acquisition occurred on January 1, 2020:
| (in thousands) | 2021 | 2020 | ||||||||||||
| Revenue | $ | $ | ||||||||||||
| Net income (loss) attributable to Deluxe | ( |
|||||||||||||
The unaudited pro forma financial information was prepared in accordance with the accounting policies described in Note 1. The pro forma information includes adjustments to reflect the additional amortization that would have been charged assuming the fair value adjustments to intangible assets had been applied from January 1, 2020. The pro forma information also includes adjustments to reflect the additional interest expense on the debt we issued to fund the acquisition (Note 13), and.the acquisition transaction costs we incurred during 2021 are reflected in the 2020 pro forma results.
This pro forma financial information is for informational purposes only. It does not reflect the integration of the businesses or any synergies that may result from the acquisition. As such, it is not indicative of the results of operations that would have been achieved had the acquisition been consummated on January 1, 2020. In addition, the pro forma amounts are not indicative of future operating results.
2022 divestitures – In May 2022, we completed the sale of our Australian web hosting business for cash proceeds of $17,620 , net of costs of the sale. This business generated annual revenue in our Data Solutions segment of $23,766 during 2021. During 2022, we recognized a pretax gain of $15,166 on this sale. The assets and liabilities sold were not significant to our consolidated balance sheet.
In April 2022, we sold the assets of our Promotional Solutions strategic sourcing business, and in August 2022, we sold the assets of our Promotional Solutions retail packaging business. These businesses generated annual revenue of approximately $29,000 during 2021. Neither the gain on these sales nor the assets and liabilities sold were significant to our consolidated financial statements.
2023 divestiture – In January 2023, we entered into an agreement for the sale of our North American web hosting and logo businesses for an aggregate sales price of $42,000 , plus up to $10,000 of additional proceeds contingent upon performance against certain conditions following the closing. We anticipate that the sale will close by March 31, 2023 and that we will recognize a gain on the sale. These businesses generated annual revenue of approximately $66,000 during 2022, primarily in our Data Solutions segment.
We believe that these divestitures allow us to focus our resources on the key growth areas of payments and data, while allowing us to optimize our operations.
Facility sale – In May 2022, we sold our former facility located in Lancaster, California for cash proceeds of $6,929 , net of costs of the sale, and we recognized a pretax gain on the sale of $2,361 during 2022. The sale was a result of our continued real estate rationalization process.
67
|
DELUXE CORPORATION
NOTES TO CONSOLIDATED FINANCIAL STATEMENTS
(dollars in thousands, except per share amounts)
| ||
| NOTE 7: DERIVATIVE FINANCIAL INSTRUMENTS | ||
As part of our interest rate risk management strategy, we have entered into interest rate swaps, which we designated as cash flow hedges, to mitigate variability in interest payments on a portion of our variable-rate debt (Note 13). Information regarding our cash flow hedges was as follows:
| December 31, 2022 | December 31, 2021 | |||||||||||||||||||||||||||||||||||||
| (in thousands) | Notional amount | Interest Rate | Maturity | Balance Sheet Location | Fair Value Asset / (Liability) |
Fair Value Asset / (Liability) |
||||||||||||||||||||||||||||||||
| July 2019 interest rate swap: |
||||||||||||||||||||||||||||||||||||||
| $ | % | March 2023 | Other current assets | $ | $ | — | ||||||||||||||||||||||||||||||||
| Other non-current liabilities | — | ( |
||||||||||||||||||||||||||||||||||||
| September 2022 interest rate swap: | ||||||||||||||||||||||||||||||||||||||
| % | September 2025 | Other non-current assets | — | |||||||||||||||||||||||||||||||||||
In January 2023, we executed a $200,000 interest rate swap that will take effect in March 2023, expires in March 2026 and carries a fixed rate of 3.91 %. This agreement will replace the existing interest rate swap that matures in March 2023 and has also been designated as a cash flow hedge.
Changes in the fair values of the interest rate swaps are recorded in accumulated other comprehensive loss on the consolidated balance sheets and are subsequently reclassified into interest expense as interest payments are made on the variable-rate debt. The fair values of the derivatives are calculated based on the applicable reference rate curve on the date of measurement. The cash flow hedges were fully effective as of December 31, 2022 and December 31, 2021, and their impact on consolidated net income and our consolidated statements of cash flows was not significant. We also expect that the amount that will be reclassified to interest expense during the next 12 months will not be significant.
| NOTE 8: FAIR VALUE MEASUREMENTS | ||
Goodwill impairment analyses
We evaluate the carrying value of goodwill as of July 31 of each year and between annual evaluations if events occur or circumstances change that could indicate a possible impairment. Our policy on impairment of goodwill, which is included in Note 1, explains our methodology for assessing goodwill impairment.
2022 annual goodwill impairment analyses – In completing the 2022 annual impairment analysis of goodwill as of July 31, 2022, we elected to perform qualitative analyses for all of our reporting units, with the exception of our Data Analytics reporting unit. These qualitative analyses evaluated factors, including, but not limited to, economic, market and industry conditions, cost factors and the overall financial performance of the reporting units. We also considered the most recent quantitative analyses completed in prior periods. In completing these assessments, we noted no changes in events or circumstances that indicated that it was more likely than not that the fair value of any reporting unit was less than its carrying amount. The quantitative analysis of our Data Analytics reporting unit indicated that the estimated fair value of this reporting unit exceeded its carrying value by approximately $46,000 , or by 39 % above the carrying value of its net assets. As such, no goodwill impairment charges were recorded as a result of our 2022 annual impairment analysis.
2021 annual goodwill impairment analyses – In completing the 2021 annual impairment analysis of goodwill as of July 31, 2021, we elected to perform qualitative analyses for all of our reporting units. These qualitative analyses evaluated factors, including, but not limited to, economic, market and industry conditions, cost factors and the overall financial performance of the reporting units. We also considered the most recent quantitative analyses completed in prior periods. In completing these assessments, we noted no changes in events or circumstances that indicated that it was more likely than not that the fair value of any reporting unit was less than its carrying amount. As such, no goodwill impairment charges were recorded as a result of our 2021 annual impairment analysis.
Second quarter 2021 realignment of reporting units – As a result of changes in our financial management reporting process during the second quarter of 2021, we concluded that a realignment of our reporting units was required. These changes
68
|
DELUXE CORPORATION
NOTES TO CONSOLIDATED FINANCIAL STATEMENTS
(dollars in thousands, except per share amounts)
| ||
did not require a revision to our reportable business segments. We analyzed goodwill for impairment immediately prior to this realignment by performing qualitative analyses for the reporting units with goodwill. The qualitative analyses evaluated factors, including, but not limited to, economic, market and industry conditions, cost factors and the overall financial performance of the reporting units. We also considered the last quantitative analyses we completed. In completing these assessments, we noted no changes in events or circumstances that indicated that it was more likely than not that the fair value of any reporting unit was less than its carrying amount.
The realignment of our reporting units, effective April 1, 2021, did not change the reporting units within our Data Solutions or Checks segments. Within our Payments segment, the number of reporting units increased from 1 to 4 , and within our Promotional Solutions segment, the number of reporting units increased from 1 to 2 . Upon completing the realignment, we reallocated the carrying value of goodwill to our new reporting units based on their relative fair values. Immediately subsequent to the realignment, we completed qualitative analyses for the reporting units that changed and to which goodwill was assigned. We determined that it was appropriate to perform qualitative assessments, given that our analysis indicated that the change in reporting units did not mask or prevent an impairment that existed at the time of the change. In completing the qualitative assessments, we noted no changes in events or circumstances that indicated that it was more likely than not that the fair value of any reporting unit was less than its carrying amount. As such, no goodwill impairment charges were recorded as a result of these analyses.
2020 annual goodwill impairment analyses – In completing the 2020 annual impairment analysis of goodwill as of July 31, 2020, we elected to perform qualitative analyses for 2 of our reporting units: Payments and Checks. These qualitative analyses evaluated factors, including, but not limited to, economic, market and industry conditions, cost factors and the overall financial performance of the reporting units. We also considered the most recent quantitative analyses we completed, which indicated that the estimated fair values of these reporting units exceeded their carrying values by approximately $490,000 and $954,000 , or by 189 % and 180 % above the carrying values of their net assets. In completing these assessments, we noted no changes in events or circumstances that indicated that it was more likely than not that the fair value of either reporting unit was less than its carrying amount.
We elected to perform quantitative analyses for our other 2 reporting units: Data Analytics and Promotional Solutions. These quantitative analyses indicated that the estimated fair values of these reporting units exceeded their carrying values by approximately $100,000 and $210,000 , or by 63 % and 132 % above the carrying values of their net assets. As such, no goodwill impairment charges were recorded as a result of our 2020 annual impairment analysis.
First quarter 2020 goodwill impairment analyses – Effective January 1, 2020, we reorganized our reportable business segments to align with structural and management reporting changes in support of our growth strategy. As a result, we reassessed our previously determined reporting units and concluded that a realignment of our reporting units was required. We analyzed goodwill for impairment immediately prior to this realignment by performing qualitative analyses for the reporting units that changed, with the exception of our Direct-to-Consumer reporting unit, which is now part of our Checks reportable business segment. The qualitative analyses evaluated factors, including, but not limited to, economic, market and industry conditions, cost factors and the overall financial performance of the reporting units. We also considered the last quantitative analyses we completed. In completing these assessments, we noted no changes in events or circumstances that indicated that it was more likely than not that the fair value of any reporting unit was less than its carrying amount. The quantitative analysis of our Direct-to-Consumer reporting unit indicated that its fair value exceeded its carrying value by approximately $35,000 , or 26 %, as of January 1, 2020.
In completing the realignment of our reporting units, we reallocated the carrying value of goodwill to our new reporting units based on their relative fair values. Immediately subsequent to the realignment, we completed quantitative analyses for the reporting units that changed as a result of the realignment. These quantitative analyses, as of January 1, 2020, indicated that the estimated fair values of our reporting units exceeded their carrying values by approximate amounts between $37,000 and $954,000 , or by amounts between 121 % and 189 % above the carrying values of their net assets.
In March 2020, the World Health Organization classified the COVID-19 outbreak as a pandemic. Following the pandemic designation, we observed a decline in the market value of our common shares and we determined that the global response to the pandemic negatively impacted our estimates of expected future cash flows. After our consideration of economic, market and industry conditions, cost factors, the overall financial performance of our reporting units and the last quantitative analyses we completed, we concluded that a triggering event had occurred for 2 of our reporting units. As such, we completed quantitative goodwill impairment analyses for our Promotional Solutions and Data Solutions Web Hosting reporting units as of March 31, 2020. Our analyses indicated that the goodwill of our Promotional Solutions reporting unit was partially impaired and the goodwill of our Data Solutions Web Hosting reporting unit was fully impaired. We recorded goodwill impairment charges of $67,132 and $4,317 , respectively, during the quarter ended March 31, 2020. The impairment charges were measured as the amount by which the reporting units' carrying values exceeded their estimated fair values, limited to the carrying amount of goodwill. After the impairment charges, $59,009 of goodwill remained in the Promotional Solutions reporting unit as of the measurement date.
69
|
DELUXE CORPORATION
NOTES TO CONSOLIDATED FINANCIAL STATEMENTS
(dollars in thousands, except per share amounts)
| ||
Other non-recurring asset impairment analyses
We evaluate the recoverability of property, plant, equipment and amortizable intangibles not held for sale whenever events or changes in circumstances indicate that an asset group's carrying amount may not be recoverable. Our policy on impairment of long-lived assets and amortizable intangibles, which is included in Note 1, explains our methodology for assessing impairment of these assets. Assets held for sale are recorded at the lower of their carrying value or estimated fair value less costs to sell.
2020 impairment analyses – As a result of the impacts of the COVID-19 pandemic, we assessed for impairment certain long-lived assets of our Data Solutions Web Hosting reporting unit as of March 31, 2020. As a result of these assessments, we recorded asset impairment charges of $17,678 related to customer list, software and trade name intangible assets. With the exception of certain internal-use software assets, we determined that the assets were fully impaired. We utilized the discounted value of estimated future cash flows to estimate the fair value of the asset group. In our analysis, we assumed a revenue decline of 31 % and a gross margin decline of 5.2 points for 2020, as well as a discount rate of 9 %.
During the first quarter of 2020, we assessed for impairment the carrying value of an asset group related to a small business distributor that we had previously purchased. Our assessment was the result of customer attrition during the quarter that impacted our projections of future cash flows. Based on our estimate of future cash flows, we determined that the asset group was partially impaired as of February 29, 2020, and we recorded an asset impairment charge of $2,752 , reducing the carrying value of the related customer list intangible asset. During the third quarter of 2020, as customer attrition continued, we again assessed this asset group for impairment and recorded an additional asset impairment charge of $2,356 , bringing the total impairment charge to $5,108 in 2020. In calculating the estimated fair value of the asset group as of September 30, 2020, we assumed no revenue growth, a 1.0 point improvement in gross margin and a discount rate of 11 %.
Also during 2020, we recorded asset impairment charges of $7,514 related primarily to the rationalization of our real estate footprint, as well as internal-use software held for sale as of December 31, 2019. These assets were written down to their estimated fair values less costs to sell. The sale of the related real estate assets was completed during the quarter ended September 30, 2020 and the sale of the internal-use software was completed on December 31, 2020.
| Fair value measurements using | ||||||||||||||||||||||||||||||||
| Fair value as of measurement date |
Quoted prices in active markets for identical assets | Significant other observable inputs | Significant unobservable inputs | Impairment charge | ||||||||||||||||||||||||||||
| (in thousands) | (Level 1) | (Level 2) | (Level 3) | |||||||||||||||||||||||||||||
| 2020 analyses: | ||||||||||||||||||||||||||||||||
Intangible assets (Data Solutions Web Hosting reporting unit)(1)
|
$ | $ | — | $ | — | $ | $ | |||||||||||||||||||||||||
| Small business distributor | — | — | ||||||||||||||||||||||||||||||
| Other assets | — | — | ||||||||||||||||||||||||||||||
| Goodwill | ||||||||||||||||||||||||||||||||
| Total | $ | |||||||||||||||||||||||||||||||
(1) The impairment charge consisted of $8,397 related to customer lists, $6,932 related to internal-use software and $2,349 related to other intangible assets.
Business combinations
For all acquisitions, we are required to measure the fair value of the net identifiable tangible and intangible assets and liabilities acquired. Information regarding our 2021 acquisition can be found in Note 6 and information regarding the useful lives of acquired intangibles can be found in Note 3. The identifiable net assets acquired during 2021 were comprised primarily of intangible assets, accounts receivable and operating lease assets and liabilities. The fair value of the customer relationship intangibles acquired during 2021, as well as the partner relationship intangibles, was estimated using the multi-period excess earnings method. This valuation model estimates revenues and cash flows derived from the asset and then deducts portions of the cash flow that can be attributed to supporting assets, such as a trade name or fixed assets, that contributed to the generation of the cash flows. The resulting cash flow, which is attributable solely to the customer relationship or partner relationship asset, is then discounted at a rate of return commensurate with the risk of the asset to calculate a present value. Key assumptions used in all these calculations included same-customer revenue, merchant and partner growth rates; estimated earnings; estimated customer and partner retention rates, based on the acquirees' historical information; and the discount rate.
70
|
DELUXE CORPORATION
NOTES TO CONSOLIDATED FINANCIAL STATEMENTS
(dollars in thousands, except per share amounts)
| ||
The estimated fair values of the acquired trade names and technology-based intangibles were estimated using the relief from royalty method, which calculates the cost savings associated with owning rather than licensing the assets. Assumed royalty rates were applied to projected revenue for the estimated remaining useful lives of the assets to estimate the royalty savings. Royalty rates are selected based on the attributes of the asset, including its recognition and reputation in the industry, and in the case of trade names, with consideration of the specific profitability of the products sold under a trade name and supporting assets.
The estimated fair value of the acquired accounts receivable approximated the gross contractual amounts receivable and we expect to collect all acquired receivables. The fair value of the acquired operating lease liabilities was estimated as if the leases were new. As such, we reassessed the lease term, the discount rate and the lease payments. The fair value of the related operating lease assets was measured at the same amount as the lease liability, adjusted to reflect favorable or unfavorable terms of the leases as compared to market terms.
Recurring fair value measurements
Funds held for customers and cash and cash equivalents included available-for-sale debt securities (Note 3). These securities included a mutual fund investment that invests in Canadian and provincial government securities, an investment in a Canadian guaranteed investment certificate (GIC) with an original maturity of 2 years, and a domestic money market fund. The mutual fund investment is not traded in an active market and its fair value is determined by obtaining quoted prices in active markets for the underlying securities held by the fund. The cost of the GIC, which matured during 2022, approximated its fair value, based on estimates using current market rates offered for deposits with similar remaining maturities.The cost of the money market fund held at December 31, 2022, which is traded in an active market, approximated its fair value because of the short-term nature of the investment. Unrealized gains and losses, net of tax, are included in accumulated other comprehensive loss on the consolidated balance sheets. The cost of securities sold is determined using the average cost method. Realized gains and losses are included in revenue on the consolidated statements of income and were not significant during the past 3 years.
Information regarding the fair values of our financial instruments was as follows:
| Fair value measurements using | ||||||||||||||||||||||||||||||||||||||
| Balance sheet location | December 31, 2022 | Quoted prices in active markets for identical assets (Level 1) |
Significant other observable inputs (Level 2) |
Significant unobservable inputs (Level 3) |
||||||||||||||||||||||||||||||||||
| (in thousands) | Carrying value | Fair value | ||||||||||||||||||||||||||||||||||||
Measured at fair value through comprehensive income: |
||||||||||||||||||||||||||||||||||||||
Available-for-sale debt securities |
Cash and cash equivalents | $ | $ | $ | $ | — | $ | — | ||||||||||||||||||||||||||||||
Available-for-sale debt securities |
Funds held for customers | — | — | |||||||||||||||||||||||||||||||||||
| Other current and non-current assets | — | — | ||||||||||||||||||||||||||||||||||||
| Amortized cost: | ||||||||||||||||||||||||||||||||||||||
| Cash | Cash and cash equivalents | — | — | |||||||||||||||||||||||||||||||||||
| Cash | Funds held for customers | — | — | |||||||||||||||||||||||||||||||||||
| Cash | Other non-current assets | — | — | |||||||||||||||||||||||||||||||||||
| Loans and notes receivable from distributors | Other current and non-current assets | — | — | |||||||||||||||||||||||||||||||||||
| Long-term debt | Current portion of long-term debt and long-term debt | — | — | |||||||||||||||||||||||||||||||||||
71
|
DELUXE CORPORATION
NOTES TO CONSOLIDATED FINANCIAL STATEMENTS
(dollars in thousands, except per share amounts)
| ||
| Fair value measurements using | ||||||||||||||||||||||||||||||||||||||
| Balance sheet location | December 31, 2021 | Quoted prices in active markets for identical assets (Level 1) |
Significant other observable inputs (Level 2) |
Significant unobservable inputs (Level 3) |
||||||||||||||||||||||||||||||||||
| (in thousands) | Carrying value | Fair value | ||||||||||||||||||||||||||||||||||||
Measured at fair value through comprehensive income: |
||||||||||||||||||||||||||||||||||||||
Available-for-sale debt securities |
Funds held for customers | $ | $ | $ | — | $ | $ | — | ||||||||||||||||||||||||||||||
| Other non-current liabilities | ( |
( |
— | ( |
— | |||||||||||||||||||||||||||||||||
| Amortized cost: | ||||||||||||||||||||||||||||||||||||||
| Cash | Cash and cash equivalents | — | — | |||||||||||||||||||||||||||||||||||
| Cash | Funds held for customers | — | — | |||||||||||||||||||||||||||||||||||
| Cash | Other non-current assets | — | — | |||||||||||||||||||||||||||||||||||
| Loans and notes receivable from distributors | Other current and non-current assets | — | — | |||||||||||||||||||||||||||||||||||
| Long-term debt | Current portion of long-term debt and long-term debt | — | — | |||||||||||||||||||||||||||||||||||
| NOTE 9: RESTRUCTURING AND INTEGRATION EXPENSE | ||
Restructuring and integration expense consists of costs related to the consolidation and migration of certain applications and processes, including our financial and sales management systems. It also includes costs related to the integration of acquired businesses into our systems and processes. These costs primarily consist of information technology consulting, project management services and internal labor, as well as other costs associated with our initiatives, such as training, travel, relocation and costs associated with facility closures. In addition, we recorded employee severance costs related to these initiatives, as well as our ongoing cost reduction initiatives across functional areas. We are currently pursuing several initiatives designed to focus on our growth strategy and to increase our efficiency. Restructuring and integration expense is not allocated to our reportable business segments.
Restructuring and integration expense is reflected on the consolidated statements of income as follows for the years ended December 31:
| (in thousands) | 2022 | 2021 | 2020 | |||||||||||||||||
| Total cost of revenue | $ | $ | $ | |||||||||||||||||
| Operating expenses | ||||||||||||||||||||
| Restructuring and integration expense | $ | $ | $ | |||||||||||||||||
72
|
DELUXE CORPORATION
NOTES TO CONSOLIDATED FINANCIAL STATEMENTS
(dollars in thousands, except per share amounts)
| ||
Restructuring and integration expense was comprised of the following for the years ended December 31:
| (in thousands) | 2022 | 2021 | 2020 | |||||||||||||||||
| External consulting fees | $ | $ | $ | |||||||||||||||||
| Employee severance benefits | ||||||||||||||||||||
| Internal labor | ||||||||||||||||||||
| Other | ||||||||||||||||||||
| Restructuring and integration expense | $ | $ | $ | |||||||||||||||||
Our restructuring and integration accruals are included in accrued liabilities on the consolidated balance sheets and represent expected cash payments required to satisfy the remaining severance obligations to those employees already terminated and those expected to be terminated under our various initiatives. The majority of the employee reductions, as well as the related severance payments, are expected to be completed by mid-2023, utilizing cash from operations.
Changes in our restructuring and integration accruals were as follows:
| (in thousands) | Employee severance benefits | |||||||
Balance, December 31, 2019 |
$ | |||||||
| Charges | ||||||||
| Reversals | ( |
|||||||
| Payments | ( |
|||||||
Balance, December 31, 2020 |
||||||||
| Charges | ||||||||
| Reversals | ( |
|||||||
| Payments | ( |
|||||||
Balance, December 31, 2021 |
||||||||
| Charges | ||||||||
| Reversals | ( |
|||||||
| Payments | ( |
|||||||
Balance, December 31, 2022 |
$ | |||||||
The charges and reversals presented in the rollforward of our restructuring and integration accruals do not include items charged directly to expense as incurred, as those items are not reflected in accrued liabilities on the consolidated balance sheets.
| NOTE 10: INCOME TAX PROVISION | ||
Income before income taxes was comprised of the following for the years ended December 31:
| (in thousands) | 2022 | 2021 | 2020 | |||||||||||||||||
| U.S. | $ | $ | $ | |||||||||||||||||
| Foreign | ||||||||||||||||||||
| Income before income taxes | $ | $ | $ | |||||||||||||||||
73
|
DELUXE CORPORATION
NOTES TO CONSOLIDATED FINANCIAL STATEMENTS
(dollars in thousands, except per share amounts)
| ||
The components of the income tax provision were as follows for the years ended December 31:
| (in thousands) | 2022 | 2021 | 2020 | |||||||||||||||||
| Current tax provision: | ||||||||||||||||||||
| Federal | $ | $ | ( |
$ | ||||||||||||||||
| State | ||||||||||||||||||||
| Foreign | ||||||||||||||||||||
| Total current tax provision | ||||||||||||||||||||
| Deferred tax provision: | ||||||||||||||||||||
| Federal | ( |
( |
||||||||||||||||||
| State | ( |
( |
||||||||||||||||||
| Foreign | ( |
( |
||||||||||||||||||
| Total deferred tax provision | ( |
( |
||||||||||||||||||
| Income tax provision | $ | $ | $ | |||||||||||||||||
The effective tax rate on pretax income reconciles to the U.S. federal statutory tax rate for the years ended December 31 as follows:
| 2022 | 2021 | 2020 | ||||||||||||||||||
| Income tax at federal statutory rate | % | % | % | |||||||||||||||||
| Goodwill impairment charges (Note 8) | % | |||||||||||||||||||
| Change in valuation allowances | % | % | % | |||||||||||||||||
| Tax impact of share-based compensation | % | % | % | |||||||||||||||||
| State income tax expense, net of federal income tax benefit | % | % | % | |||||||||||||||||
| Tax on repatriation of foreign earnings | % | % | ||||||||||||||||||
| Non-deductible executive compensation | % | % | % | |||||||||||||||||
| Foreign tax rate differences | % | % | % | |||||||||||||||||
| Change in unrecognized tax benefits, including interest and penalties | % | ( |
%) | ( |
%) | |||||||||||||||
| Non-deductible acquisition costs | % | % | ||||||||||||||||||
| Sale of business (Note 6) | ( |
%) | ||||||||||||||||||
| Return to provision adjustments | ( |
%) | ( |
%) | ||||||||||||||||
| Research and development tax credit | ( |
%) | ( |
%) | ( |
%) | ||||||||||||||
| Payables and receivables for prior year tax returns | ( |
%) | % | % | ||||||||||||||||
| Non-taxable income from employee life insurance policies | ( |
%) | ( |
%) | ( |
%) | ||||||||||||||
| Other | % | % | % | |||||||||||||||||
| Effective tax rate | % | % | % | |||||||||||||||||
In May 2022, we completed the sale of our Australian web hosting business (Note 6), and we recognized a capital loss on the transaction for tax purposes. We recorded a valuation allowance for the portion of this capital loss carryover that we do not currently expect to realize. During the fourth quarter of 2022, we identified and recorded an out-of-period correcting adjustment related to the income tax provision recorded on this sale in the second quarter of 2022. The income tax provision and accrued income taxes were overstated by $5,900 in the second quarter of 2022, and the income tax provision was understated by the same amount in the fourth quarter. There was no impact to the full year 2022 income tax provision, and this adjustment was not material to our results of operations for the periods ended June 30, 2022, September 30, 2022 or December 31, 2022.
During 2022, we repatriated current year foreign earnings of $25,526 held in cash by our Canadian subsidiaries. The associated tax expense of $1,818 was included in the income tax provision for the year ended December 31, 2022. We believe the accumulated and remaining cash of our Canadian subsidiaries is sufficient to meet their working capital needs. The historical unremitted Canadian earnings as of December 31, 2021, as well as the accumulated and future unremitted earnings of our European subsidiaries, will continue to be reinvested indefinitely in the operations of those subsidiaries. Deferred income taxes have not been recognized on these earnings as of December 31, 2022. If we were to repatriate our foreign cash and cash equivalents into the U.S. at one time, the tax effects would generally be limited to foreign withholding taxes on any such
74
|
DELUXE CORPORATION
NOTES TO CONSOLIDATED FINANCIAL STATEMENTS
(dollars in thousands, except per share amounts)
| ||
distribution. As of December 31, 2022, the amount of cash and cash equivalents held by our foreign subsidiaries was $33,615 , primarily in Canada.
During the fourth quarter of 2021, we repatriated accumulated foreign earnings of $85,285 held in cash by our Canadian subsidiaries. We decided to complete the repatriation due, in part, to changes in Canadian law announced during 2021 and the reorganization of our capital structure in June 2021 in conjunction with the First American acquisition (Note 6). The associated tax expense of $4,555 was included in the income tax provision for the fourth quarter of 2021.
A reconciliation of the beginning and ending amount of unrecognized tax benefits, excluding accrued interest and penalties and the federal benefit of deductible state income tax, was as follows:
| (in thousands) | 2022 | 2021 | 2020 | |||||||||||||||||
| Balance, beginning of year | $ | $ | $ | |||||||||||||||||
| Additions for tax positions of current year | ||||||||||||||||||||
| Additions for tax positions of prior years | ||||||||||||||||||||
| Reductions for tax positions of prior years | ( |
( |
( |
|||||||||||||||||
| Lapse of statutes of limitations | ( |
( |
( |
|||||||||||||||||
| Balance, end of year | $ | $ | $ | |||||||||||||||||
If the unrecognized tax benefits as of December 31, 2022 were recognized in the consolidated financial statements, income tax expense would decrease $2,635 . Accruals for interest and penalties, excluding the tax benefits of deductible interest, were $731 as of December 31, 2022 and $635 as of December 31, 2021. Our income tax provision included expense for interest and penalties of $97 in 2022 and $84 in 2021 and included a reduction for interest and penalties of $384 in 2020. We believe that it is reasonably possible that a decrease of up to $1,500 in unrecognized tax benefits related to state tax exposures may be necessary within the next 12 months, with the majority related to the lapse of statutes of limitations. We believe it is reasonably possible that an increase of up to $2,000 in unrecognized tax benefits may be necessary within the next 12 months, related to legislative and regulatory changes in certain state and local jurisdictions. Due to the nature of the underlying liabilities and the extended time frame often needed to resolve income tax uncertainties, we cannot provide reliable estimates of the amount or timing of cash payments that may be required to settle these liabilities.
The statute of limitations for federal tax assessments for 2018 and prior years has expired. Our 2019 through 2021 returns and our 2022 return, when filed, are subject to IRS examination. In general, income tax returns for the years 2019 through 2022 remain subject to examination by foreign, state and city tax jurisdictions. In the event that we have determined not to file income tax returns with a particular state or city, all years remain subject to examination by the tax jurisdiction.
The ultimate outcome of tax matters may differ from our estimates and assumptions. Unfavorable settlement of any particular issue would require the use of cash and could result in increased income tax expense. Favorable resolution would result in reduced income tax expense.
75
|
DELUXE CORPORATION
NOTES TO CONSOLIDATED FINANCIAL STATEMENTS
(dollars in thousands, except per share amounts)
| ||
Tax-effected temporary differences that gave rise to deferred tax assets and liabilities as of December 31 were as follows:
| 2022 | 2021 | |||||||||||||||||||||||||
| (in thousands) | Deferred tax assets | Deferred tax liabilities | Deferred tax assets | Deferred tax liabilities | ||||||||||||||||||||||
| Goodwill | $ | — | $ | $ | — | $ | ||||||||||||||||||||
| Intangible assets | — | — | ||||||||||||||||||||||||
| Cloud computing arrangements | — | — | ||||||||||||||||||||||||
| Employee benefit plans | — | — | ||||||||||||||||||||||||
| Revenue recognition | — | — | ||||||||||||||||||||||||
| Prepaid assets | — | — | ||||||||||||||||||||||||
| Operating leases | ||||||||||||||||||||||||||
Net operating loss, tax credit and capital loss carryforwards |
— | — | ||||||||||||||||||||||||
| Deductible interest carryforward | — | — | ||||||||||||||||||||||||
| Reserves and accruals | — | — | ||||||||||||||||||||||||
| Payroll tax deferral under the CARES Act | — | — | ||||||||||||||||||||||||
| Property, plant and equipment | — | — | ||||||||||||||||||||||||
| Inventories | — | — | ||||||||||||||||||||||||
| All other | ||||||||||||||||||||||||||
| Total deferred taxes | ||||||||||||||||||||||||||
| Valuation allowances | ( |
— | ( |
— | ||||||||||||||||||||||
| Net deferred taxes | $ | $ | $ | $ | ||||||||||||||||||||||
The valuation allowances as of December 31, 2022 and December 31, 2021 related primarily to capital loss carryforwards in the U.S and Canada and net operating loss carryforwards in various state jurisdictions that we do not currently expect to fully realize. In addition, as of December 31, 2021, the valuation allowances also related to deferred tax assets of our Australian operations. Changes in our valuation allowances for the years ended December 31 were as follows:
| (in thousands) | 2022 | 2021 | 2020 | |||||||||||||||||
| Balance, beginning of year | $ | ( |
$ | ( |
$ | ( |
||||||||||||||
| Expense from change in allowances | ( |
( |
( |
|||||||||||||||||
| Sale of business (Note 6) | ||||||||||||||||||||
| Foreign currency translation | ( |
|||||||||||||||||||
| Balance, end of year | $ | ( |
$ | ( |
$ | ( |
||||||||||||||
As of December 31, 2022, we had the following net operating loss, deductible interest, capital loss and tax credit carryforwards:
•state net operating loss carryforwards and tax credit carryforwards of $118,646 that expire at various dates between 2023 and 2050;
•federal deductible interest carryforwards of $61,696 that do not expire;
•federal capital loss carryforwards of $34,112 that expire in 2027; and
•foreign capital loss carryforwards of $4,688 that do not expire.
| NOTE 11: SHARE-BASED COMPENSATION PLANS | ||
76
|
DELUXE CORPORATION
NOTES TO CONSOLIDATED FINANCIAL STATEMENTS
(dollars in thousands, except per share amounts)
| ||
issuance of stock appreciation rights, none of which have been granted as of December 31, 2022. Our policy regarding the recognition of compensation expense for employee share-based awards can be found in Note 1.
The following amounts were recognized in our consolidated statements of income for share-based compensation awards for the years ended December 31:
| (in thousands) | 2022 | 2021 | 2020 | |||||||||||||||||
| Restricted shares and restricted stock units | $ | $ | $ | |||||||||||||||||
| Performance share unit awards | ||||||||||||||||||||
| Stock options | ||||||||||||||||||||
| Employee stock purchase plan | ||||||||||||||||||||
| Total share-based compensation expense | $ | $ | $ | |||||||||||||||||
| Income tax benefit | $ | ( |
$ | ( |
$ | ( |
||||||||||||||
As of December 31, 2022, the total compensation expense for unvested awards not yet recognized in our consolidated statements of income was $27,221 , net of the effect of estimated forfeitures. This amount is expected to be recognized over a weighted-average period of 2.2 years.
Non-qualified stock options – All options allow for the purchase of shares of common stock at prices equal to the stock's market value at the date of grant. Options become exercisable beginning 1 year after the grant date, with one-fourth vesting each year over 4 years. Options granted under the current plan may be exercised up to 10 years following the grant date. Awards granted prior to 2019 have a 7 year life. Beginning 1 year after the grant date, in the case of qualified retirement, death or disability, options vest immediately and the period over which the options can be exercised is shortened. Beginning 1 year after the grant date, in the case of involuntary termination without cause, a pro-rata portion of the options vest immediately and the period over which the options can be exercised is shortened. Employees forfeit unvested options when they voluntarily terminate their employment with the company, and they have up to 3 months to exercise vested options before they are canceled. In the case of involuntary termination with cause, the entire unexercised portion of the award is canceled. All options may vest immediately upon a change of control, as defined in the award agreement.
| 2021 | 2020 | |||||||||||||
| Risk-free interest rate | % | % | ||||||||||||
| Dividend yield | % | % | ||||||||||||
| Expected volatility | % | % | ||||||||||||
| Weighted-average option life (in years) | ||||||||||||||
The risk-free interest rate for periods within the expected option life is based on the U.S. Treasury yield curve in effect at the grant date. The dividend yield is estimated over the expected life of the option based on historical dividends paid. Expected volatility is based on the historical volatility of our stock over the most recent historical period equivalent to the expected life of the option. The expected option life is the average length of time over which we expect the employee groups will exercise their options, based on historical experience with similar grants.
77
|
DELUXE CORPORATION
NOTES TO CONSOLIDATED FINANCIAL STATEMENTS
(dollars in thousands, except per share amounts)
| ||
Each option is convertible into 1 share of common stock upon exercise. Information regarding options issued under the current and all previous plans was as follows:
|
Number of options
(in thousands)
|
Weighted-average exercise price per option |
Aggregate intrinsic value
(in thousands)
|
Weighted-average remaining contractual term
(in years)
|
|||||||||||||||||||||||
Outstanding, December 31, 2019 |
$ | |||||||||||||||||||||||||
| Granted | ||||||||||||||||||||||||||
| Exercised | ( |
|||||||||||||||||||||||||
| Forfeited or expired | ( |
|||||||||||||||||||||||||
Outstanding, December 31, 2020 |
||||||||||||||||||||||||||
| Granted | ||||||||||||||||||||||||||
| Exercised | ( |
|||||||||||||||||||||||||
| Forfeited or expired | ( |
|||||||||||||||||||||||||
Outstanding, December 31, 2021 |
||||||||||||||||||||||||||
| Forfeited or expired | ( |
|||||||||||||||||||||||||
Outstanding, December 31, 2022 |
$ | |||||||||||||||||||||||||
Exercisable at December 31, 2020 |
$ | |||||||||||||||||||||||||
Exercisable at December 31, 2021 |
||||||||||||||||||||||||||
Exercisable at December 31, 2022 |
$ | |||||||||||||||||||||||||
The intrinsic value of a stock award is the amount by which the fair value of the underlying stock exceeds the exercise price of the award. The total intrinsic value of options exercised was $510 for 2021 and $118 for 2020.
Restricted stock units – We grant restricted stock unit awards to all North American employees and during 2021 and 2020, we paid a portion of employee bonuses in restricted stock units. We also grant certain other restricted stock unit awards under our long-term incentive plan. These awards generally vest over periods of 3 years or 4 years.
Additionally, certain management employees have the option to receive a portion of their bonus payment in the form of restricted stock units. When employees elect this payment method, we provide an additional matching amount of restricted stock units equal to 50 % of the restricted stock units earned under the bonus plan. These awards vest 2 years from the date of grant. In the case of qualified retirement, death, disability or change of control, the awards vest immediately. In the case of involuntary termination without cause or voluntary termination, employees receive a cash payment for the units earned under the bonus plan, but forfeit the company-provided matching amount. We made cash payments of $123 during 2022, $64 during 2021 and $58 during 2020 to settle share-based liabilities.
In addition to awards granted to employees, non-employee members of our board of directors can elect to receive all or a portion of their fees in the form of restricted stock units. Directors are issued shares in exchange for the units upon the earlier of the tenth anniversary of February 1st of the year following the year in which the non-employee director ceases to serve on the board or such other objectively determinable date pre-elected by the director.
78
|
DELUXE CORPORATION
NOTES TO CONSOLIDATED FINANCIAL STATEMENTS
(dollars in thousands, except per share amounts)
| ||
Each restricted stock unit is convertible into 1 share of common stock upon completion of the vesting period. Information regarding our restricted stock units was as follows:
|
Number of units
(in thousands)
|
Weighted-average grant date fair value per unit |
Weighted-average remaining vesting period
(in years)
|
||||||||||||||||||
Outstanding at December 31, 2019 |
$ | |||||||||||||||||||
| Granted | ||||||||||||||||||||
| Vested | ( |
|||||||||||||||||||
| Forfeited | ( |
|||||||||||||||||||
Outstanding at December 31, 2020 |
||||||||||||||||||||
| Granted | ||||||||||||||||||||
| Vested | ( |
|||||||||||||||||||
| Forfeited | ( |
|||||||||||||||||||
Outstanding at December 31, 2021 |
||||||||||||||||||||
| Granted | ||||||||||||||||||||
| Vested | ( |
|||||||||||||||||||
| Forfeited | ( |
|||||||||||||||||||
Outstanding at December 31, 2022 |
||||||||||||||||||||
Of the awards outstanding at December 31, 2022, 45 thousand restricted stock units with a value of $766 were included in accrued liabilities and other non-current liabilities on the consolidated balance sheet. As of December 31, 2022, these units had a fair value of $16.98 per unit and a weighted-average remaining contractual term of 10 months.
The value of restricted stock units that vested was $13,602 for 2022, $16,646 for 2021 and $7,839 for 2020.
Restricted shares – For restricted share awards granted to employees under our current long-term incentive plan, in most cases one-fourth of the shares vested each year over 4 years. No no
Information regarding unvested restricted shares was as follows:
|
Number of shares
(in thousands)
|
Weighted-average grant date fair value per share | |||||||||||||
Unvested at December 31, 2019 |
$ | |||||||||||||
| Vested | ( |
|||||||||||||
| Forfeited | ( |
|||||||||||||
Unvested at December 31, 2020 |
||||||||||||||
| Vested | ( |
|||||||||||||
Unvested at December 31, 2021 |
||||||||||||||
The total fair value of restricted shares that vested was $332 for 2021 and $600 for 2020.
Performance share unit awards – Our performance share unit awards have a 3 year vesting period. Shares will be issued at the end of the vesting period if performance targets relating to revenue and total shareholder return are achieved. If employment is terminated for any reason prior to the 1 year anniversary of the commencement of the performance period, the award is forfeited. On or after the 1 year anniversary of the commencement of the performance period, a pro-rata portion of the shares awarded at the end of the performance period is issued in the case of qualified retirement, death, disability, involuntary termination without cause or resignation for good reason, as defined in the agreement.
79
|
DELUXE CORPORATION
NOTES TO CONSOLIDATED FINANCIAL STATEMENTS
(dollars in thousands, except per share amounts)
| ||
The following weighted-average assumptions were used in the Monte Carlo simulation model in determining the fair value of market-based performance share units granted:
| 2022 | 2021 | 2020 | ||||||||||||||||||
| Risk-free interest rate | % | % | % | |||||||||||||||||
| Dividend yield | % | % | % | |||||||||||||||||
| Expected volatility | % | % | % | |||||||||||||||||
The risk-free interest rate for periods within the expected award life is based on the U.S. Treasury yield curve in effect at the grant date. The dividend yield is estimated over the expected life of the award based on historical dividends paid. Expected volatility is based on the historical volatility of our stock over the expected life of the award.
Information regarding unvested performance share units was as follows:
|
Performance share units
(in thousands)
|
Weighted-average grant date fair value per unit |
Weighted-average remaining contractual term
(in years)
|
||||||||||||||||||
Unvested at December 31, 2019 |
$ | |||||||||||||||||||
Granted(1)
|
||||||||||||||||||||
| Vested | ( |
|||||||||||||||||||
| Forfeited | ( |
|||||||||||||||||||
Unvested at December 31, 2020 |
||||||||||||||||||||
Granted(1)
|
||||||||||||||||||||
| Forfeited | ( |
|||||||||||||||||||
Unvested at December 31, 2021 |
||||||||||||||||||||
Granted(1)
|
||||||||||||||||||||
| Vested | ( |
|||||||||||||||||||
| Forfeited | ( |
|||||||||||||||||||
Adjustment for performance results achieved (2)
|
||||||||||||||||||||
Unvested at December 31, 2022 |
||||||||||||||||||||
(1) Reflects awards granted assuming achievement of performance goals at target.
(2) Reflects the difference between the awards earned at the end of the performance period and the target number of shares.
| NOTE 12: POSTRETIREMENT BENEFITS | ||
80
|
DELUXE CORPORATION
NOTES TO CONSOLIDATED FINANCIAL STATEMENTS
(dollars in thousands, except per share amounts)
| ||
Obligations and funded status – Changes in our benefit obligation, plan assets and funded status for the years ended December 31 were as follows:
| (in thousands) | Postretirement benefit plan |
Pension plan(1)
|
||||||||||||
| Change in benefit obligation: | ||||||||||||||
Benefit obligation, December 31, 2020 |
$ | $ | ||||||||||||
| Interest cost | ||||||||||||||
| Net actuarial (gain) loss | ( |
|||||||||||||
| Benefits paid from plan assets and company funds | ( |
( |
||||||||||||
Benefit obligation, December 31, 2021 |
||||||||||||||
| Interest cost | ||||||||||||||
| Net actuarial gain | ( |
( |
||||||||||||
| Benefits paid from plan assets and company funds | ( |
( |
||||||||||||
Benefit obligation, December 31, 2022 |
$ | $ | ||||||||||||
| Change in plan assets: | ||||||||||||||
Fair value of plan assets, December 31, 2020 |
$ | $ | ||||||||||||
| Return on plan assets | — | |||||||||||||
| Benefits paid | ( |
— | ||||||||||||
Fair value of plan assets, December 31, 2021 |
||||||||||||||
| Loss on plan assets | ( |
— | ||||||||||||
| Benefits paid | ( |
— | ||||||||||||
Fair value of plan assets, December 31, 2022 |
$ | $ | ||||||||||||
Funded status, December 31, 2021 |
$ | $ | ( |
|||||||||||
Funded status, December 31, 2022 |
$ | $ | ( |
|||||||||||
(1) The accumulated benefit obligation equals the projected benefit obligation .
The funded status of our plans was recognized on the consolidated balance sheets as of December 31 as follows:
| Postretirement benefit plan | Pension plan | |||||||||||||||||||||||||
| (in thousands) | 2022 | 2021 | 2022 | 2021 | ||||||||||||||||||||||
| Other non-current assets | $ | $ | $ | — | $ | — | ||||||||||||||||||||
| Accrued liabilities | — | — | ||||||||||||||||||||||||
| Other non-current liabilities | — | — | ||||||||||||||||||||||||
Amounts included in accumulated other comprehensive loss as of December 31 that have not been recognized as components of postretirement benefit income were as follows:
| (in thousands) | 2022 | 2021 | ||||||||||||
| Unrecognized prior service credit | $ | $ | ||||||||||||
| Unrecognized net actuarial loss | ( |
( |
||||||||||||
| Tax effect | ||||||||||||||
Amount recognized in accumulated other comprehensive loss, net of tax |
$ | ( |
$ | ( |
||||||||||
The unrecognized prior service credit relates to our postretirement benefit plan and is a result of previous plan amendments that reduced the accumulated postretirement benefit obligation. A reduction is first used to reduce any existing unrecognized prior service cost, then to reduce any remaining unrecognized transition obligation. The excess is the unrecognized prior service credit. The prior service credit is amortized on the straight-line basis over the remaining life expectancy of plan participants at the time of each plan amendment.
81
|
DELUXE CORPORATION
NOTES TO CONSOLIDATED FINANCIAL STATEMENTS
(dollars in thousands, except per share amounts)
| ||
Unrecognized net actuarial gains and losses result from experience different from that assumed and from changes in assumptions. The net actuarial gain recognized during 2022 was primarily due to the increase in the discount rate used to discount the benefit obligation and a reduction in the number of plan participants. The net actuarial gain recognized during 2021 was primarily due to the increase in the discount rate used to discount the benefit obligation, as well as favorable claims experience. Unrecognized actuarial gains and losses for our postretirement benefit plan are amortized over the average remaining life expectancy of inactive plan participants, as a large percentage of the plan participants are classified as inactive. This amortization period is currently 12.4 years.
Postretirement benefit income – Postretirement benefit income for the years ended December 31 consisted of the following components:
| (in thousands) | 2022 | 2021 | 2020 | |||||||||||||||||
| $ | $ | $ | ||||||||||||||||||
| ( |
( |
( |
||||||||||||||||||
| ( |
( |
( |
||||||||||||||||||
| Net periodic benefit income | $ | ( |
$ | ( |
$ | ( |
||||||||||||||
Actuarial assumptions – In measuring the benefit obligations as of December 31, the following discount rate assumptions were used:
| Postretirement benefit plan | Pension plan | |||||||||||||||||||||||||
| 2022 | 2021 | 2022 | 2021 | |||||||||||||||||||||||
| Discount rate | % | % | % | % | ||||||||||||||||||||||
In measuring net periodic benefit income for the years ended December 31, the following assumptions were used:
| Postretirement benefit plan | Pension plan | |||||||||||||||||||||||||||||||||||||
| 2022 | 2021 | 2020 | 2022 | 2021 | 2020 | |||||||||||||||||||||||||||||||||
| Discount rate | % | % | % | % | % | % | ||||||||||||||||||||||||||||||||
| Expected return on plan assets | % | % | % | — | — | — | ||||||||||||||||||||||||||||||||
The discount rate assumption is based on the rates of return on high-quality, fixed-income instruments currently available whose cash flows approximate the timing and amount of expected benefit payments. In determining the expected long-term rate of return on plan assets, we utilize our historical returns and then adjust these returns for estimated inflation and projected market returns. Our inflation assumption is primarily based on analysis of historical inflation data.
In measuring the benefit obligation as of December 31 for our postretirement benefit plan, the following assumptions for health care cost trend rates were used. These rates are utilized to determine our periodic benefit income for the following year.
| 2022 | 2021 | 2020 | ||||||||||||||||||||||||||||||||||||
| Participants under age 65 | Participants age 65 and older | Participants under age 65 | Participants age 65 and older | Participants under age 65 | Participants age 65 and older | |||||||||||||||||||||||||||||||||
Health care cost trend rate assumed for next year |
% | % | % | % | % | % | ||||||||||||||||||||||||||||||||
Rate to which the cost trend rate is assumed to decline (the ultimate trend rate) |
% | % | % | % | % | % | ||||||||||||||||||||||||||||||||
Year that the rate reaches the ultimate trend rate |
||||||||||||||||||||||||||||||||||||||
82
|
DELUXE CORPORATION
NOTES TO CONSOLIDATED FINANCIAL STATEMENTS
(dollars in thousands, except per share amounts)
| ||
– The allocation of plan assets by asset category as of December 31 was as follows:
| Postretirement benefit plan | ||||||||||||||
| 2022 | 2021 | |||||||||||||
| U.S. corporate debt securities | % | % | ||||||||||||
| International equity securities | % | % | ||||||||||||
| U.S. large capitalization equity securities | % | % | ||||||||||||
| Mortgage-backed securities | % | % | ||||||||||||
| U.S. small and mid-capitalization equity securities | % | % | ||||||||||||
| Total | % | % | ||||||||||||
Our postretirement benefit plan has assets that are intended to meet long-term obligations. In order to meet these obligations, we employ a total return investment approach that considers cash flow needs and balances long-term projected returns against expected asset risk, as measured using projected standard deviations. Risk tolerance is established through consideration of projected plan liabilities, the plan's funded status, projected liquidity needs and our financial condition.
The target asset allocation percentages for our postretirement benefit plan are based on our liability and asset projections. The targeted allocation of plan assets is 60 % fixed income securities, 20 % international equity securities, 17 % large capitalization equity securities and 3 % small and mid-capitalization equity securities.
Information regarding fair value measurements of plan assets was as follows as of December 31, 2022:
| Fair value measurements using | ||||||||||||||||||||||||||||||||
| Quoted prices in active markets for identical assets | Significant other observable inputs | Significant unobservable inputs | Investments measured at net asset value |
Fair value as of
December 31, 2022
|
||||||||||||||||||||||||||||
| (in thousands) | (Level 1) | (Level 2) | (Level 3) | |||||||||||||||||||||||||||||
| U.S. corporate debt securities | $ | $ | $ | $ | $ | |||||||||||||||||||||||||||
| International equity securities | ||||||||||||||||||||||||||||||||
U.S. large capitalization equity securities |
||||||||||||||||||||||||||||||||
| Mortgage-backed securities | ||||||||||||||||||||||||||||||||
U.S. small and mid-capitalization equity securities |
||||||||||||||||||||||||||||||||
| Plan assets | $ | $ | $ | $ | $ | |||||||||||||||||||||||||||
Information regarding fair value measurements of plan assets was as follows as of December 31, 2021:
| Fair value measurements using | ||||||||||||||||||||||||||||||||
| Quoted prices in active markets for identical assets | Significant other observable inputs | Significant unobservable inputs | Investments measured at net asset value |
Fair value as of
December 31, 2021
|
||||||||||||||||||||||||||||
| (in thousands) | (Level 1) | (Level 2) | (Level 3) | |||||||||||||||||||||||||||||
| Mortgage-backed securities | $ | ( |
$ | $ | $ | $ | ||||||||||||||||||||||||||
| International equity securities | ||||||||||||||||||||||||||||||||
| U.S. corporate debt securities | ||||||||||||||||||||||||||||||||
U.S. large capitalization equity securities |
( |
|||||||||||||||||||||||||||||||
U.S. small and mid-capitalization equity securities |
||||||||||||||||||||||||||||||||
| Plan assets | $ | $ | $ | $ | $ | |||||||||||||||||||||||||||
83
|
DELUXE CORPORATION
NOTES TO CONSOLIDATED FINANCIAL STATEMENTS
(dollars in thousands, except per share amounts)
| ||
The Level 2 investments relate to investment funds that publish daily net asset value ("NAV") per unit. The daily NAV is available to participants in the funds and redemptions can be made daily at the current NAV. The fair value and units are determined and published, and are the basis for current transactions. The investments are not eligible for the NAV practical expedient. However, they are measured at the published NAV because the quoted NAV per unit represents the price at which the investment would be sold in a transaction between independent market participants. Our policy is to recognize transfers between fair value levels as of the end of the reporting period in which the transfer occurred.
Cash flows – We made no
We have fully funded the SERP obligation with investments in company-owned life insurance policies. The cash surrender value of these policies is included in long-term investments on the consolidated balance sheets and totaled $7,429 as of December 31, 2022 and $7,370 as of December 31, 2021.
The following benefit payments are expected to be paid during the years indicated:
| (in thousands) | Postretirement benefit plan | Pension plan | ||||||||||||
| 2023 | $ | $ | ||||||||||||
| 2024 | ||||||||||||||
| 2025 | ||||||||||||||
| 2026 | ||||||||||||||
| 2027 | ||||||||||||||
| 2028 - 2032 | ||||||||||||||
401(k) plan – We maintain a 401(k) plan to provide retirement benefits for certain employees. The plan covers a majority of full-time employees, as well as some part-time employees. Employees generally become eligible to participate in the plan after completing 30 days of service.
401(k) contributions are made by both employees and Deluxe. Employees may contribute up to 50 % of eligible wages, subject to IRS limitations and the terms and conditions of the plan. For the majority of employees, we typically match 100 % of the first 1 % of wages contributed and 50 % of the next 5 % of wages contributed, beginning after 30 days of employment. Effective April 1, 2020, we suspended the company matching contribution to maintain liquidity during the COVID-19 pandemic..The company match was reinstated on January 1, 2022. Expense recognized for the 401(k) plan matching contribution was $3,095 for 2022, $763 for 2021 and $2,823 for 2020. The expense recognized during 2021 related to First American, which was acquired on June 1, 2021 (Note 6). All employee and employer contributions are remitted to the plan's trustee. Benefits provided by the plan are paid from accumulated funds of the trust.
Employees are provided a broad range of investment options to choose from when investing their 401(k) plan funds. Investing in our common stock is not one of these options, although funds selected by employees may at times hold our common stock.
| NOTE 13: DEBT | ||
Debt outstanding was comprised of the following at December 31:
| (in thousands) | 2022 | 2021 | ||||||||||||
| Senior, secured term loan facility | $ | $ | ||||||||||||
| Senior, unsecured notes | ||||||||||||||
| Amounts drawn on senior, secured revolving credit facility | ||||||||||||||
| Total principal amount | ||||||||||||||
| Less: unamortized discount and debt issuance costs | ( |
( |
||||||||||||
| Total debt, net of discount and debt issuance costs | ||||||||||||||
| Less: current portion of long-term debt, net of debt issuance costs | ( |
( |
||||||||||||
| Long-term debt | $ | $ | ||||||||||||
84
|
DELUXE CORPORATION
NOTES TO CONSOLIDATED FINANCIAL STATEMENTS
(dollars in thousands, except per share amounts)
| ||
Maturities of long-term debt were as follows as of December 31, 2022:
| (in thousands) | Debt obligations | |||||||
| 2023 | $ | |||||||
| 2024 | ||||||||
| 2025 | ||||||||
| 2026 | ||||||||
| 2027 | ||||||||
| Thereafter | ||||||||
| Total principal amount | $ | |||||||
Credit facility – In June 2021, we executed a senior, unsecured credit facility consisting of a revolving credit facility with commitments of $500,000 and a $1,155,000 term loan facility. The revolving credit facility includes a $40,000 swingline sub-facility and a $25,000 letter of credit sub-facility. Proceeds from the credit facility were used to terminate our previous credit facility agreement and to fund the acquisition of First American (Note 6). Loans under the revolving credit facility may be borrowed, repaid and re-borrowed until June 1, 2026, at which time all amounts borrowed must be repaid. The term loan facility will be repaid in equal quarterly installments of $14,438 21,656 28,875
Interest is payable on the credit facility at a fluctuating rate of interest determined by reference to the eurodollar rate (derived from LIBOR) plus an applicable margin ranging from 1.5 % to 2.5 %, depending on our consolidated total leverage ratio, as defined in the credit agreement. We are currently in the process of modifying our existing credit facility to utilize SOFR, replacing LIBOR as the reference rate in the agreement, effective March 20, 2023. Subsequent to this modification, interest will be payable based on SOFR plus an applicable margin. A commitment fee is payable on the unused portion of the revolving credit facility at a rate ranging from 0.25 % to 0.35 %, depending on our consolidated total leverage ratio. Amounts outstanding under our credit facilities had a weighted-average interest rate of 6.07 % as of December 31, 2022 and 2.67 % as of December 31, 2021, including the impact of interest rate swaps that effectively convert $500,000 of our variable-rate debt to fixed rate debt. Further information regarding the interest rate swaps can be found in Note 7.
Borrowings under the credit facility are collateralized by substantially all of the present and future tangible and intangible personal property held by us and our subsidiaries that have guaranteed our obligations under the credit facility, subject to certain exceptions. The credit agreement contains customary covenants regarding limits on levels of indebtedness, liens, mergers, certain asset dispositions, changes in business, advances, investments, loans and restricted payments. The covenants are subject to a number of limitations and exceptions set forth in the credit agreement. The credit agreement also includes requirements regarding our consolidated total leverage ratio and our consolidated secured leverage ratio, as defined in the credit agreement. These ratios may not equal or exceed the following amounts during the periods indicated:
| Fiscal Quarter Ending | Consolidated total leverage ratio | Consolidated secured leverage ratio | ||||||||||||
| March 31, 2023 | ||||||||||||||
| June 30, 2023 through March 31, 2024 | ||||||||||||||
| June 30, 2024 and each fiscal quarter thereafter | ||||||||||||||
In addition, we must maintain a minimum interest coverage ratio of at least 3.00 to 1.00 throughout the remaining term of the credit facility. Failure to to meet any of the above requirements would result in an event of default that would allow lenders to declare amounts outstanding immediately due and payable and would allow the lenders to enforce their interests against collateral pledged if we were unable to settle the amounts outstanding. We were in compliance with all debt covenants as of December 31, 2022.
The credit agreement contains customary representations and warranties and as a condition to borrowing, requires that all such representations and warranties be true and correct in all material respects on the date of each borrowing, including representations as to no material adverse change in our business, assets, operations or financial condition. If our consolidated total leverage ratio exceeds 2.75 to 1.00, the aggregate annual amount of permitted dividends and share repurchases is limited to $60,000 .
85
|
DELUXE CORPORATION
NOTES TO CONSOLIDATED FINANCIAL STATEMENTS
(dollars in thousands, except per share amounts)
| ||
Daily average amounts outstanding under our current and previous credit facility were as follows for the years ended December 31:
| (in thousands) | 2022 | 2021 | 2020 | |||||||||||||||||
| Daily average amount outstanding | $ | $ | $ | |||||||||||||||||
| Weighted-average interest rate | % | % | % | |||||||||||||||||
As of December 31, 2022, amounts were available for borrowing under our revolving credit facility as follows:
| (in thousands) | Total available | |||||||
| Revolving credit facility commitment | $ | |||||||
| Amount drawn on revolving credit facility | ( |
|||||||
Outstanding letters of credit(1)
|
( |
|||||||
Net available for borrowing as of December 31, 2022 |
$ | |||||||
(1) We use standby letters of credit primarily to collateralize certain obligations related to our self-insured workers' compensation claims, as well as claims for environmental matters, as required by certain states. These letters of credit reduce the amount available for borrowing under our revolving credit facility.
Senior unsecured notes – In June 2021, we issued $500,000 of 8.0 % senior, unsecured notes that mature in June 2029. The notes were issued via a private placement under Rule 144A of the Securities Act of 1933. Proceeds from the offering, net of discount and offering costs, were $490,741 , resulting in an effective interest rate of 8.3 %. The net proceeds from the notes were used to fund the acquisition of First American in June 2021 (Note 6). Interest payments are due each June and December. During the quarter ended September 30, 2022, we settled $25,000 of these notes via open market purchases. We realized a pretax gain of $1,726 on these debt retirements that is included in interest expense in the consolidated statement of income.
The indenture governing the notes contains covenants that limit our ability and the ability of our restricted subsidiaries to, among other things, incur additional indebtedness and liens, issue redeemable stock and preferred stock, pay dividends and distributions, make loans and investments and consolidate or merge or sell all or substantially all of our assets.
| NOTE 14: LEASES | ||
86
|
DELUXE CORPORATION
NOTES TO CONSOLIDATED FINANCIAL STATEMENTS
(dollars in thousands, except per share amounts)
| ||
Leases were reflected on the consolidated balance sheets as follows at December 31:
| (in thousands) | 2022 | 2021 | ||||||||||||
| Operating leases: | ||||||||||||||
| Operating lease assets | $ | $ | ||||||||||||
| $ | $ | |||||||||||||
| Operating lease liabilities | ||||||||||||||
| Total operating lease liabilities | $ | $ | ||||||||||||
| Weighted-average remaining lease term (in years) | ||||||||||||||
| Weighted-average discount rate | % | % | ||||||||||||
| Finance leases: | ||||||||||||||
| Property, plant and equipment, gross | $ | $ | ||||||||||||
| Accumulated depreciation | ( |
( |
||||||||||||
| $ | $ | |||||||||||||
| $ | $ | |||||||||||||
| Total finance lease liabilities | $ | $ | ||||||||||||
| Weighted-average remaining lease term (in years) | ||||||||||||||
| Weighted-average discount rate | % | % | ||||||||||||
The components of lease expense for the years ended December 31 were as follows:
| (in thousands) | 2022 | 2021 | 2020 | |||||||||||||||||
| Operating lease expense | $ | $ | $ | |||||||||||||||||
| Finance lease expense: | ||||||||||||||||||||
| Amortization of right-of-use assets | $ | $ | $ | |||||||||||||||||
| Interest on lease liabilities | ||||||||||||||||||||
| Total finance lease expense | $ | $ | $ | |||||||||||||||||
87
|
DELUXE CORPORATION
NOTES TO CONSOLIDATED FINANCIAL STATEMENTS
(dollars in thousands, except per share amounts)
| ||
Supplemental cash flow information related to leases for the years ended December 31 was as follows:
| (in thousands) | 2022 | 2021 | 2020 | |||||||||||||||||
| Lease assets obtained in exchange for lease obligations: | ||||||||||||||||||||
Operating leases(1)
|
$ | $ | $ | |||||||||||||||||
Finance leases(2)
|
||||||||||||||||||||
| Cash paid for amounts included in lease obligations: | ||||||||||||||||||||
Operating cash flows from operating leases(3)
|
$ | $ | $ | |||||||||||||||||
| Operating cash flows from finance leases | ||||||||||||||||||||
| Financing cash flows from finance leases | ||||||||||||||||||||
(1) Operating lease assets obtained during 2021 included $24,396 acquired in conjunction with the acquisition of First American in June 2021 (Note 6).
(2) Finance lease assets obtained during 2021 consisted of a lease on our corporate headquarters located in Minnesota that commenced in July 2021.
(3) Cash paid for operating leases during 2021 was reduced by lease incentives received of $9,410 .
Maturities of lease liabilities were as follows at December 31, 2022:
| (in thousands) | Operating lease obligations | Finance lease obligations |
||||||||||||
| 2023 | $ | $ | ||||||||||||
| 2024 | ||||||||||||||
| 2025 | ||||||||||||||
| 2026 | ||||||||||||||
| 2027 | ||||||||||||||
| Thereafter | ||||||||||||||
| Total lease payments | ||||||||||||||
| Less lease incentive receivable | ( |
— | ||||||||||||
| Less imputed interest | ( |
( |
||||||||||||
| Present value of lease payments | $ | $ | ||||||||||||
We have executed an operating lease on a facility located in Chicago, Illinois that has not yet commenced and thus, is not reflected on our consolidated balance sheet as of December 31, 2022. The lease has a term of 12 years and increases our cash obligations by approximately $16,000 , payable through early 2036.
| NOTE 15: OTHER COMMITMENTS AND CONTINGENCIES | ||
Indemnifications – In the normal course of business, we periodically enter into agreements that incorporate general indemnification language. These indemnification provisions generally encompass third-party claims arising from our products and services, including, without limitation, service failures, breach of security, intellectual property rights, governmental regulations and/or employment-related matters. Performance under these indemnities would generally be triggered by our breach of the terms of the contract. In disposing of assets or businesses, we often provide representations, warranties and/or indemnities to cover various risks including, for example, unknown damage to the assets, environmental risks involved in the sale of real estate, liability to investigate and remediate environmental contamination at waste disposal sites and manufacturing facilities, and unidentified tax liabilities and legal matters related to periods prior to disposition. We do not have the ability to estimate the potential liability from such indemnities because they relate to unknown conditions. However, we do not believe that any liability under these indemnities would have a material adverse effect on our financial position, annual results of operations or annual cash flows. We have recorded liabilities for known indemnifications related to environmental matters. These liabilities were not significant as of December 31, 2022 or December 31, 2021.
First American indemnification – Pursuant to the First American acquisition agreement, we are entitled to limited indemnification for certain expenses and losses, if any, that may be incurred after the consummation of the transaction that arise out of certain matters, including a Federal Trade Commission ("FTC") investigation initiated in December 2019 seeking
88
|
DELUXE CORPORATION
NOTES TO CONSOLIDATED FINANCIAL STATEMENTS
(dollars in thousands, except per share amounts)
| ||
information to determine whether certain subsidiaries of First American may have engaged in conduct prohibited by the Federal Trade Commission Act, the Fair Credit Reporting Act or the Duties of Furnishers of Information. As fully set forth in the merger agreement, our rights to indemnification for any such expenses and losses are limited to the amount of an indemnity holdback, which will be our sole recourse for any such losses.
The First American subsidiaries entered into a Stipulated Order for Permanent Injunction, Monetary Judgment, and Other Relief (the "Order") with the FTC, which was approved by the FTC on July 29, 2022. The parties subsequently entered into an amended Order. Pursuant to the Order, among other things, the First American defendants are required to pay $4,900 to the FTC within 7 days of the entry of the Order. The First American defendants also agreed to certain injunctive relief. The payment of the above-referenced amount, together with post-closing expenses that we and First American incurred in connection with this matter, will be withdrawn from the holdback referenced above. As such, the payment of such amount will not have a material impact on our consolidated financial statements.
Self-insurance – We are self-insured for certain costs, primarily workers' compensation claims and medical and dental benefits for active employees and those employees on long-term disability. The liabilities associated with these items represent our best estimate of the ultimate obligations for reported claims plus those incurred, but not reported, and totaled $9,661 as of December 31, 2022 and $7,401 as of December 31, 2021. These accruals are included in accrued liabilities and other non-current liabilities on the consolidated balance sheets. Our workers' compensation liability is recorded at present value. The difference between the discounted and undiscounted liability was not significant as of December 31, 2022 or December 31, 2021.
Our self-insurance liabilities are estimated, in part, by considering historical claims experience, demographic factors and other actuarial assumptions. The estimated accruals for these liabilities could be significantly affected if future events and claims differ from these assumptions and historical trends.
Litigation – Recorded liabilities for legal matters, as well as related charges recorded in each of the past 3 years, were not material to our financial position, results of operations or liquidity during the periods presented, and we do not believe that any of the currently identified claims or litigation will materially affect our financial position, results of operations or liquidity upon resolution. However, litigation is subject to inherent uncertainties, and unfavorable rulings could occur. If an unfavorable ruling were to occur, it may cause a material adverse impact on our financial position, results of operations or liquidity for the period in which the ruling occurs or in future periods.
| NOTE 16: SHAREHOLDERS' EQUITY | ||
| NOTE 17: BUSINESS SEGMENT INFORMATION | ||
We operate 4 reportable business segments, generally organized by product type. In conjunction with the anticipated sale of our North American web hosting and logo businesses in 2023, we changed the name of our Cloud Solutions segment to Data Solutions. Information regarding this pending sale can be found in Note 6. Our segments are as follows:
•Payments – This segment includes our merchant in-store, online and mobile payment solutions; treasury management solutions, including remittance and lockbox processing, remote deposit capture, receivables management, payment processing and paperless treasury management; payroll and disbursement services, including Deluxe Payment Exchange; and fraud and security services.
•Data Solutions – This segment includes data-driven marketing solutions; hosted solutions, including digital engagement, logo design, financial institution profitability reporting and business incorporation services; and web hosting and design services.
•Promotional Solutions – This segment includes business forms, accessories, advertising specialties and promotional apparel.
•Checks – This segment includes printed business and personal checks.
89
|
DELUXE CORPORATION
NOTES TO CONSOLIDATED FINANCIAL STATEMENTS
(dollars in thousands, except per share amounts)
| ||
The accounting policies of the segments are the same as those described in Note 1. We allocate corporate costs for our shared services functions to our business segments when the costs are directly attributable to a segment. This includes certain sales and marketing, human resources, supply chain, real estate, finance, information technology and legal costs. Costs that are not directly attributable to a business segment are reported as Corporate operations and consist primarily of marketing, accounting, information technology, facilities, executive management and legal, tax and treasury costs that support the corporate function. Corporate operations also includes other income. All of our segments operate primarily in the U.S., with some operations in Canada. In addition, Data Solutions has operations in portions of Europe, as well as partners in Central and South America, and had operations in Australia until May 2022 when this business was sold (Note 6). No 10
Our chief operating decision maker (i.e., our Chief Executive Officer) reviews earnings before interest, taxes, depreciation and amortization (EBITDA) on an adjusted basis for each segment when deciding how to allocate resources and to assess segment operating performance. Adjusted EBITDA for each segment excludes depreciation and amortization expense, interest expense, net income attributable to non-controlling interest, income tax expense and certain other amounts, which include, when applicable: asset impairment charges; restructuring and integration costs; CEO transition costs; share-based compensation expense; acquisition transaction costs; certain legal-related expense; and gains or losses on sales of businesses and long-lived assets. Our Chief Executive Officer does not review segment asset information when making investment or operating decisions regarding our reportable business segments.
Our segment information for the years ended December 31 was as follows:
| (in thousands) | 2022 | 2021 | 2020 | |||||||||||||||||
| Payments: | ||||||||||||||||||||
| Revenue | $ | $ | $ | |||||||||||||||||
| Adjusted EBITDA | ||||||||||||||||||||
| Data Solutions: | ||||||||||||||||||||
| Revenue | ||||||||||||||||||||
| Adjusted EBITDA | ||||||||||||||||||||
| Promotional Solutions: | ||||||||||||||||||||
| Revenue | ||||||||||||||||||||
| Adjusted EBITDA | ||||||||||||||||||||
| Checks: | ||||||||||||||||||||
| Revenue | ||||||||||||||||||||
| Adjusted EBITDA | ||||||||||||||||||||
| Total segments: | ||||||||||||||||||||
| Revenue | $ | $ | $ | |||||||||||||||||
| Adjusted EBITDA | ||||||||||||||||||||
90
|
DELUXE CORPORATION
NOTES TO CONSOLIDATED FINANCIAL STATEMENTS
(dollars in thousands, except per share amounts)
| ||
The following table presents a reconciliation of total segment adjusted EBITDA to consolidated income before income taxes:
| (in thousands) | 2022 | 2021 | 2020 | |||||||||||||||||
| Total segment adjusted EBITDA | $ | $ | $ | |||||||||||||||||
| Corporate operations | ( |
( |
( |
|||||||||||||||||
| Depreciation and amortization | ( |
( |
( |
|||||||||||||||||
| Interest expense | ( |
( |
( |
|||||||||||||||||
| Net income attributable to non-controlling interest | ||||||||||||||||||||
| Asset impairment charges | ( |
|||||||||||||||||||
| Restructuring and integration costs | ( |
( |
( |
|||||||||||||||||
| CEO transition costs | ||||||||||||||||||||
| Share-based compensation expense | ( |
( |
( |
|||||||||||||||||
| Acquisition transaction costs | ( |
( |
( |
|||||||||||||||||
| Certain legal-related benefit (expense) | ( |
|||||||||||||||||||
| Gain (loss) on sale of businesses and facility | ( |
|||||||||||||||||||
| Income before income taxes | $ | $ | $ | |||||||||||||||||
91
|
DELUXE CORPORATION
NOTES TO CONSOLIDATED FINANCIAL STATEMENTS
(dollars in thousands, except per share amounts)
| ||
The following tables present revenue disaggregated by our product and service offerings:
| Year Ended December 31, 2022 | ||||||||||||||||||||||||||||||||
| (in thousands) | Payments | Data Solutions |
Promotional Solutions | Checks | Consolidated | |||||||||||||||||||||||||||
| Checks | $ | — | $ | — | $ | — | $ | $ | ||||||||||||||||||||||||
| Merchant services and other payment solutions | — | — | — | |||||||||||||||||||||||||||||
| Forms and other products | — | — | — | |||||||||||||||||||||||||||||
| Marketing and promotional solutions | — | — | — | |||||||||||||||||||||||||||||
| Treasury management solutions | — | — | — | |||||||||||||||||||||||||||||
| Data-driven marketing solutions | — | — | — | |||||||||||||||||||||||||||||
Web and hosted solutions |
— | — | — | |||||||||||||||||||||||||||||
| Total revenue | $ | $ | $ | $ | $ | |||||||||||||||||||||||||||
| Year Ended December 31, 2021 | ||||||||||||||||||||||||||||||||
| (in thousands) | Payments | Data Solutions |
Promotional Solutions | Checks | Consolidated | |||||||||||||||||||||||||||
| Checks | $ | — | $ | — | $ | — | $ | $ | ||||||||||||||||||||||||
| Merchant services and other payment solutions | — | — | — | |||||||||||||||||||||||||||||
| Forms and other products | — | — | — | |||||||||||||||||||||||||||||
| Marketing and promotional solutions | — | — | — | |||||||||||||||||||||||||||||
| Treasury management solutions | — | — | — | |||||||||||||||||||||||||||||
| Data-driven marketing solutions | — | — | — | |||||||||||||||||||||||||||||
Web and hosted solutions |
— | — | — | |||||||||||||||||||||||||||||
| Total revenue | $ | $ | $ | $ | $ | |||||||||||||||||||||||||||
| Year Ended December 31, 2020 | ||||||||||||||||||||||||||||||||
| (in thousands) | Payments | Data Solutions |
Promotional Solutions | Checks | Consolidated | |||||||||||||||||||||||||||
| Checks | $ | — | $ | — | $ | — | $ | $ | ||||||||||||||||||||||||
| Merchant services and other payment solutions | — | — | — | |||||||||||||||||||||||||||||
| Forms and other products | — | — | — | |||||||||||||||||||||||||||||
| Marketing and promotional solutions | — | — | — | |||||||||||||||||||||||||||||
| Treasury management solutions | — | — | — | |||||||||||||||||||||||||||||
| Data-driven marketing solutions | — | — | — | |||||||||||||||||||||||||||||
Web and hosted solutions |
— | — | — | |||||||||||||||||||||||||||||
| Total revenue | $ | $ | $ | $ | $ | |||||||||||||||||||||||||||
92
|
DELUXE CORPORATION
NOTES TO CONSOLIDATED FINANCIAL STATEMENTS
(dollars in thousands, except per share amounts)
| ||
The following table presents revenue disaggregated by geography, based on where items are shipped or services are performed. Substantially all of our long-lived assets reside in the U.S. Long-lived assets of our foreign subsidiaries are located primarily in Canada and are not significant to our consolidated financial position.
| (in thousands) | Payments | Data Solutions |
Promotional Solutions | Checks | Consolidated | |||||||||||||||||||||||||||
Year ended December 31, 2022: |
||||||||||||||||||||||||||||||||
| U.S. | $ | $ | $ | $ | $ | |||||||||||||||||||||||||||
| Foreign, primarily Canada | ||||||||||||||||||||||||||||||||
| Total revenue | $ | $ | $ | $ | $ | |||||||||||||||||||||||||||
Year ended December 31, 2021: |
||||||||||||||||||||||||||||||||
| U.S. | $ | $ | $ | $ | $ | |||||||||||||||||||||||||||
| Foreign, primarily Canada and Australia | ||||||||||||||||||||||||||||||||
| Total revenue | $ | $ | $ | $ | $ | |||||||||||||||||||||||||||
Year ended December 31, 2020: |
||||||||||||||||||||||||||||||||
| U.S. | $ | $ | $ | $ | $ | |||||||||||||||||||||||||||
| Foreign, primarily Canada and Australia | ||||||||||||||||||||||||||||||||
| Total revenue | $ | $ | $ | $ | $ | |||||||||||||||||||||||||||
| ITEM 9. CHANGES IN AND DISAGREEMENTS WITH ACCOUNTANTS ON ACCOUNTING AND FINANCIAL DISCLOSURE | ||
None.
| ITEM 9A. CONTROLS AND PROCEDURES | ||
Disclosure Controls and Procedures – As of the end of the period covered by this report, December 31, 2022 (the "Evaluation Date"), we carried out an evaluation, under the supervision and with the participation of management, including the Chief Executive Officer and the Chief Financial Officer, of the effectiveness of the design and operation of our disclosure controls and procedures (as defined in Rule 13a-15(e) of the Securities Exchange Act of 1934, as amended (the "Exchange Act")). Based upon that evaluation, the Chief Executive Officer and the Chief Financial Officer concluded that, as of the Evaluation Date, our disclosure controls and procedures were effective to ensure that information required to be disclosed in the reports that we file or submit under the Exchange Act is (i) recorded, processed, summarized and reported within the time periods specified in applicable rules and forms, and (ii) accumulated and communicated to our management, including our Chief Executive Officer and Chief Financial Officer, to allow timely decisions regarding required disclosure.
Internal Control Over Financial Reporting – There were no changes in our internal control over financial reporting identified in connection with our evaluation during the quarter ended December 31, 2022 that have materially affected, or are reasonably likely to materially affect, our internal control over financial reporting.
Management's Report on Internal Control over Financial Reporting – Our management is responsible for establishing and maintaining adequate internal control over financial reporting. Internal control over financial reporting is a process designed to provide reasonable assurance regarding the reliability of financial reporting and the preparation of financial statements for external purposes in accordance with generally accepted accounting principles in the U.S.
Because of its inherent limitations, internal control over financial reporting may not prevent or detect misstatements. Also, projections of any evaluation of effectiveness to future periods are subject to the risk that controls may become inadequate because of changes in conditions, or that the degree of compliance with the policies or procedures may deteriorate.
Our management assessed the effectiveness of our internal control over financial reporting as of December 31, 2022. In making this assessment, we used the criteria set forth by the Committee of Sponsoring Organizations of the Treadway Commission (COSO) in Internal Control - Integrated Framework (2013). Based on this assessment, we have concluded that, as of December 31, 2022, our internal control over financial reporting was effective based on those criteria.
93
The attestation report on our internal control over financial reporting issued by PricewaterhouseCoopers LLP appears in Item 8 of this report.
| ITEM 9B. OTHER INFORMATION | ||
None.
| ITEM 9C. DISCLOSURE REGARDING FOREIGN JURISDICTIONS THAT PREVENT INSPECTIONS | ||
Not applicable.
PART III
Except where otherwise noted, the information required by Items 10 through 14 is incorporated by reference from our definitive proxy statement, to be filed with the Securities and Exchange Commission within 120 days of our fiscal year-end, with the exception of the executive officers section of Item 10, which is included in Part I, Item 1 of this report.
| ITEM 10. DIRECTORS, EXECUTIVE OFFICERS AND CORPORATE GOVERNANCE | ||
See Part I, Item 1 of this report “Information About Our Executive Officers.” The sections of the proxy statement entitled “Item 1: Election of Directors,” "Board Structure and Governance-Director Selection Process,” “Board Structure and Governance-Audit Committee Financial Expertise; Complaint-Handling Procedures,” “Board Structure and Governance-Committee Membership and Responsibilities-Audit Committee,” and “Board Structure and Governance-Code of Business Ethics” are incorporated by reference into this report.
The full text of our Code of Business Ethics is posted on our investor relations website, www.investors.deluxe.com. We intend to satisfy the disclosure requirement under Item 5.05 of Form 8-K regarding an amendment to, or waiver from, a provision of the Code of Business Ethics that applies to our principal executive officer, principal financial officer, principal accounting officer or controller or persons performing similar functions by posting such information on our website at the address and location specified above.
| ITEM 11. EXECUTIVE COMPENSATION | ||
The sections of the proxy statement entitled “Executive Compensation Discussion and Analysis” and “Board Structure and Governance-Non-Employee Director Compensation” are incorporated by reference into this report.
| ITEM 12. SECURITY OWNERSHIP OF CERTAIN BENEFICIAL OWNERS AND MANAGEMENT AND RELATED STOCKHOLDER MATTERS | ||
The section of the proxy statement entitled “Stock Ownership and Reporting-Security Ownership of Certain Beneficial Owners and Management” is incorporated by reference into this report.
94
The following table provides information concerning all of our equity compensation plans as of December 31, 2022:
Equity Compensation Plan Information
| Plan category | Number of securities to be issued upon exercise of outstanding options, warrants and rights | Weighted-average exercise price of outstanding options, warrants and rights | Number of securities remaining available for future issuance under equity compensation plans (excluding securities reflected in the first column) | ||||||||||||||||||||
Equity compensation plans approved by shareholders |
3,160,743 | (1) | $ | 44.77 | (1) | 5,001,593 | (2) | ||||||||||||||||
Equity compensation plans not approved by shareholders |
77,716 | (3) | — | — | |||||||||||||||||||
| Total | 3,238,459 | $ | 44.77 | 5,001,593 | |||||||||||||||||||
(1) Includes awards granted under our 2022 Stock Incentive Plan and our previous stock incentive plans. The number of securities to be issued upon exercise of outstanding options, warrants and rights includes outstanding stock options of 1,732,092, restricted stock unit awards of 983,828 and 444,823 shares subject to outstanding performance share unit awards. The number of performance share units reflects the target amount for awards outstanding as of December 31, 2022. The actual number of shares issued under our performance share unit awards will range between 0% and 200% of the target amount based on our performance relative to the applicable performance goals as determined by our Compensation Committee following the end of the performance period. The performance share unit and restricted stock unit awards are not included in the weighted-average exercise price of outstanding options, warrants and rights because they require no consideration upon vesting.
(2) Includes 2,987,045 shares reserved for issuance under our Amended and Restated 2000 Employee Stock Purchase Plan and 2,014,548 shares available for issuance under our 2022 Stock Incentive Plan.
(3) Includes awards granted pursuant to an inducement award of shares registered in the Registration Statement on Form S-8 filed August 5, 2022. The number of securities to be issued upon vesting includes outstanding restricted stock unit awards of 61,062 and 16,654 shares subject to outstanding performance share unit awards. The number of performance share units reflects the target amount for awards outstanding as of December 31, 2022. The actual number of shares issued under our performance share unit awards will range between 0% and 200% of the target amount based on our performance relative to the applicable performance goals as determined by our Compensation Committee following the end of the performance period. The performance share unit and restricted stock unit awards are not included in the weighted-average exercise price of outstanding options, warrants and rights because they require no consideration upon vesting.
| ITEM 13. CERTAIN RELATIONSHIPS AND RELATED TRANSACTIONS, AND DIRECTOR INDEPENDENCE | ||
The sections of the proxy statement entitled “Board Structure and Governance-Board Oversight and Director Independence” and “Board Structure and Governance-Policies and Procedures with Respect to Related Person Transactions” are incorporated by reference into this report.
| ITEM 14. PRINCIPAL ACCOUNTANT FEES AND SERVICES | ||
The sections of the proxy statement entitled “Item 5: Ratification of the Appointment of Independent Registered Public Accounting Firm-Fees Paid to Independent Registered Public Accounting Firm” and “Item 5: Ratification of the Appointment of Independent Registered Public Accounting Firm-Policy on Audit Committee Pre-Approval of Accounting Firm Fees and Services” are incorporated by reference into this report.
PART IV
| ITEM 15. EXHIBITS AND FINANCIAL STATEMENT SCHEDULES | ||
(a) Financial Statements and Schedules
The financial statements are set forth under Item 8 of the Annual Report on Form 10-K. Financial statement schedules have been omitted since they are either not required or are not applicable, or the required information is shown in the consolidated financial statements or notes.
95
(b) Exhibit Listing
The following exhibits are filed as part of or are incorporated into this report by reference:
| Exhibit Number | Description | |||||||
| 2.1 | ||||||||
| 2.2 | ||||||||
| 2.3 | ||||||||
| 3.1 |
|
|||||||
| 3.2 |
|
|||||||
| 4.1 | ||||||||
| 4.2 | ||||||||
| 4.3 | ||||||||
| 10.1 | ||||||||
| 10.2 | ||||||||
| 10.3 | ||||||||
| 10.4 | ||||||||
| 10.5 | ||||||||
| 10.6 | ||||||||
| 10.7 | ||||||||
96
| Exhibit Number | Description | |||||||
| 10.8 | ||||||||
| 10.9 | ||||||||
| 10.10 | ||||||||
| 10.11 | ||||||||
| 10.12 | ||||||||
| 10.13 | ||||||||
| 10.14 | ||||||||
| 10.15 | ||||||||
| 10.16 | ||||||||
| 10.17 | ||||||||
| 10.18 | ||||||||
| 10.19 | ||||||||
| 10.20 | ||||||||
| 10.21 | ||||||||
| 10.22 | ||||||||
| 10.23 | ||||||||
| 10.24 | ||||||||
97
| Exhibit Number | Description | |||||||
| 10.25 | ||||||||
| 10.26 | ||||||||
| 10.27 | ||||||||
| 10.28 | ||||||||
| 10.29 | ||||||||
| 10.30 | ||||||||
| 10.31 | ||||||||
| 10.32 | ||||||||
| 21.1 | ||||||||
| 23.1 | ||||||||
| 31.1 |
|
|||||||
| 31.2 |
|
|||||||
| 32.1 | ||||||||
| 101.INS | XBRL Instance Document – the instance document does not appear in the Interactive Data File because its XBRL tags are embedded within the Inline XBRL document | |||||||
| 101.SCH | XBRL Taxonomy Extension Schema Document | |||||||
| 101.CAL | XBRL Taxonomy Extension Calculation Linkbase Document | |||||||
| 101.DEF | XBRL Taxonomy Extension Definition Linkbase Document | |||||||
98
| Exhibit Number | Description | |||||||
| 101.LAB | XBRL Taxonomy Extension Label Linkbase Document | |||||||
| 101.PRE | XBRL Taxonomy Extension Presentation Linkbase Document | |||||||
| 104 | Cover page interactive data file (formatted as Inline XBRL and contained in Exhibit 101) | |||||||
* Denotes compensatory plan or management contract
Note to recipients of Form 10-K: Copies of exhibits will be furnished upon written request and payment of reasonable expenses in furnishing such copies.
| ITEM 16. FORM 10-K SUMMARY | ||
We have elected not to include an optional Form 10-K Summary.
99
| SIGNATURES | ||
Pursuant to the requirements of Section 13 or 15(d) of the Securities Exchange Act of 1934, the registrant has duly caused this report to be signed on its behalf by the undersigned thereunto duly authorized.
| DELUXE CORPORATION | |||||
| Date: February 24, 2023 | /s/ Barry C. McCarthy | ||||
| Barry C. McCarthy, President and Chief Executive Officer | |||||
Pursuant to the requirements of the Securities Exchange Act of 1934, this report has been signed below by the following persons on behalf of the registrant and in the capacities indicated on February 24, 2023.
| Signature | Title | ||||
| /s/ Barry C. McCarthy | President and Chief Executive Officer | ||||
| Barry C. McCarthy | (Principal Executive Officer) | ||||
| /s/ William C. Zint | Senior Vice President, Chief Financial Officer | ||||
| William C. Zint | (Principal Financial Officer) | ||||
| /s/ Chad P. Kurth | Vice President, Chief Accounting Officer | ||||
| Chad P. Kurth | (Principal Accounting Officer) | ||||
| /s/ William C. Cobb | |||||
| William C. Cobb | Director | ||||
| /s/ Paul R. Garcia | |||||
| Paul R. Garcia | Director | ||||
| /s/ Cheryl Mayberry McKissack | |||||
| Cheryl Mayberry McKissack | Director | ||||
| /s/ Don J. McGrath | |||||
| Don J. McGrath | Director | ||||
| /s/ Thomas J. Reddin | |||||
| Thomas J. Reddin | Director | ||||
| /s/ Martyn R. Redgrave | |||||
| Martyn R. Redgrave | Director | ||||
| /s/ John L. Stauch | |||||
| John L. Stauch | Director | ||||
| /s/ Telisa L. Yancy | |||||
| Telisa L. Yancy | Director | ||||
100