EX-99.2
Published on December 5, 2023

INVESTOR DAY D E C E M B E R 5 , 2 0 2 3
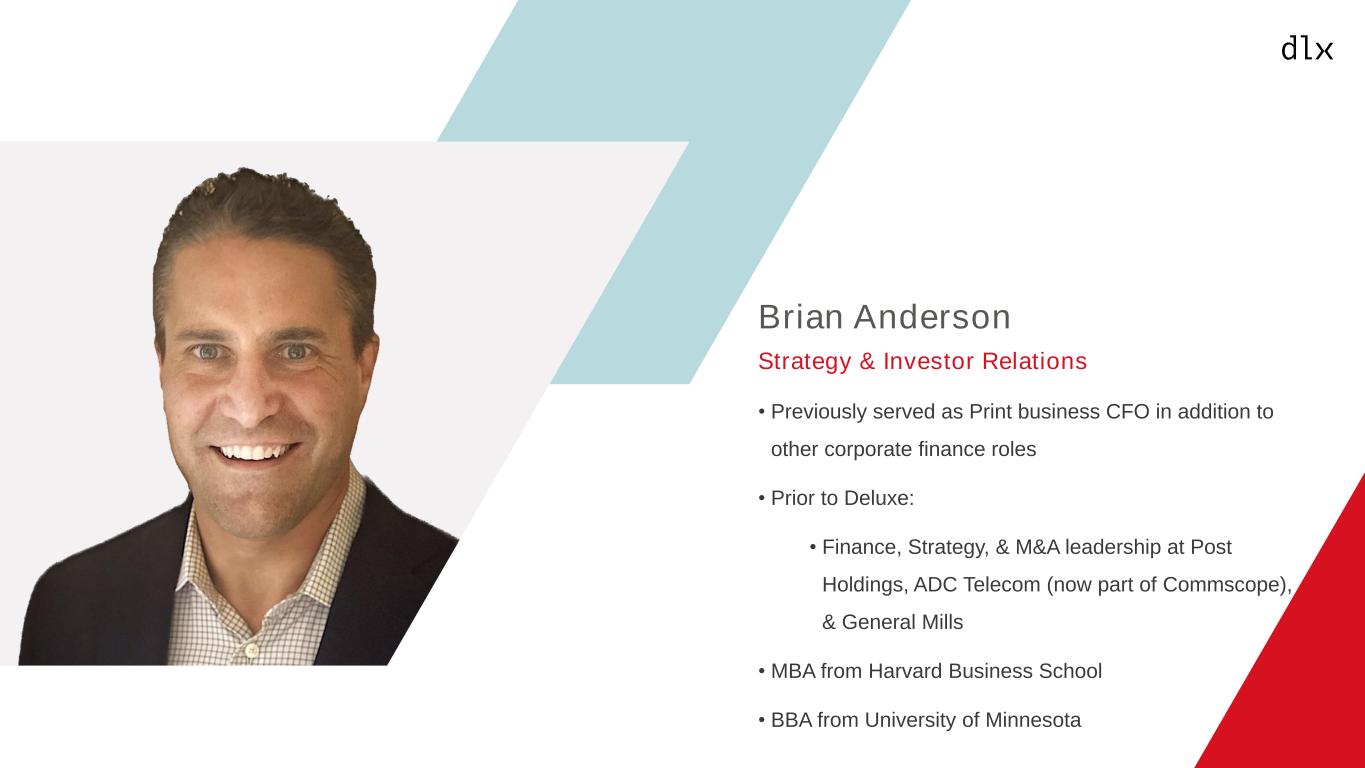
• Previously served as Print business CFO in addition to other corporate finance roles • Prior to Deluxe: • Finance, Strategy, & M&A leadership at Post Holdings, ADC Telecom (now part of Commscope), & General Mills • MBA from Harvard Business School • BBA from University of Minnesota Strategy & Investor Relations Brian Anderson
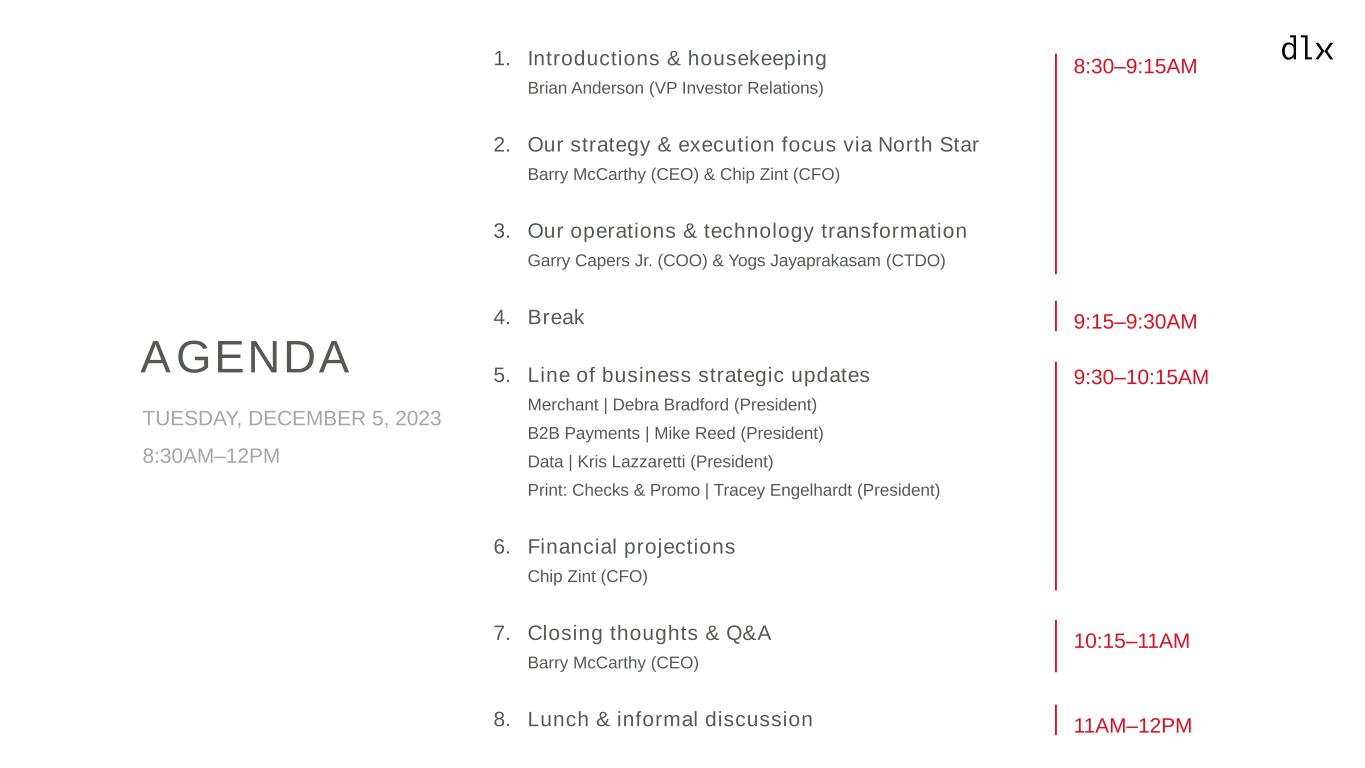
AGENDA 1. Introductions & housekeeping Brian Anderson (VP Investor Relations) 2. Our strategy & execution focus via North Star Barry McCarthy (CEO) & Chip Zint (CFO) 3. Our operations & technology transformation Garry Capers Jr. (COO) & Yogs Jayaprakasam (CTDO) 4. Break 5. Line of business strategic updates Merchant | Debra Bradford (President) B2B Payments | Mike Reed (President) Data | Kris Lazzaretti (President) Print: Checks & Promo | Tracey Engelhardt (President) 6. Financial projections Chip Zint (CFO) 7. Closing thoughts & Q&A Barry McCarthy (CEO) 8. Lunch & informal discussion TUESDAY, DECEMBER 5, 2023 8:30AM–12PM 8:30–9:15AM 9:15–9:30AM 9:30–10:15AM 10:15–11AM 11AM–12PM
Enabled by: • One Deluxe go-to-market model • Operational execution via North Star • Capital allocation discipline Built the foundation • Rationalized the portfolio • Modernized our infrastructure • Primed for growth: Acquired First American Statements made in this presentation concerning Deluxe, the company’s or management’s intentions, expectations, outlook or predictions about future results or events are “forward-looking statements” within the meaning of the Private Securities Litigation Reform Act of 1995. Such statements reflect management’s current intentions or beliefs and are subject to risks and uncertainties that could cause actual results or events to vary from stated expectations, which variations could be material and adverse. Factors that could produce such a variation include, but are not limited to, the following: potential continuing negative impacts from pandemic health issues, such as the coronavirus / COVID-19, along with the impact of related government restrictions or similar directives on our future results of operations and our future financial condition; changes in local, regional, national and international economic or political conditions, including those resulting from heightened inflation, rising interest rates, a recession, or intensified international hostilities, and the impact they may have on the company, its customers or demand for the company’s products and services; the effect of proposed and enacted legislative and regulatory actions affecting the company or the financial services industry as a whole; continuing cost increases and/or declines in the availability of materials and other services; the company’s ability to execute its transformational strategy and to realize the intended benefits; the inherent unreliability of earnings, revenue and cash flow predictions due to numerous factors, many of which are beyond the company’s control; declining demand for the compa y’s checks, check-related products and services and business forms; risks that the company’s strategies intended to drive sustained revenue and earnings growth, despite the continuing decline in checks and forms, are delayed or unsuccessful; intense competition; continued consolidation of financial institutions and/or bank failures, thereby reducing the number of potential customers and referral sources and increasing downward pressure on the company’s revenue and gross profit; risks related to acquisitions, including integration-related risks and risks that future acquisitions will not be consummated; risks that any such acquisitions do not produce the anticipated results or synergies; risks that the company’s cost reduction initiatives will be delayed or unsuccessful; risks related to any divestitures contemplated or undertaken by the company; performance shortfalls by one or more of the company’s major suppliers, licensors or service providers; continuing supply chain and labor supply issues; unanticipated delays, costs and expenses in the development and marketing of products and services, including web services and financial technology and treasury management solutions; the failure of such products and services to deliver the expected revenues and other financial targets; risks related to security breaches, computer malware or other cyber-attacks; risks of interruptions to the company’s website operations or information technology systems; and risks of unfavorable outcomes and the costs to defend litigation and other disputes. The company’s forward-looking statements speak only as of the time made, and management assumes no obligation to publicly update any such statements. Additional information concerning these and other factors that could cause actual results and events to differ materially from the company’s current expectations are contained in the company’s Form 10-K for the year ended December 31, 2022, and other filings made with the SEC. The company undertakes no obligation to update or revise any forward-looking statements to reflect subsequent events, new information or future circumstances. Portions of the financial and statistical information that will be discussed during this call are addressed in more detail within our quarterly press release posted on our investor relations website at www.investors.deluxe.com. This information was also furnished to the SEC on the Form 8-K filed by the Company this morning. Any references to non-GAAP financial measures are reconciled to the comparable GAAP financial measures in the quarterly press release and related SEC filings. CAUTIONARY STATEMENT
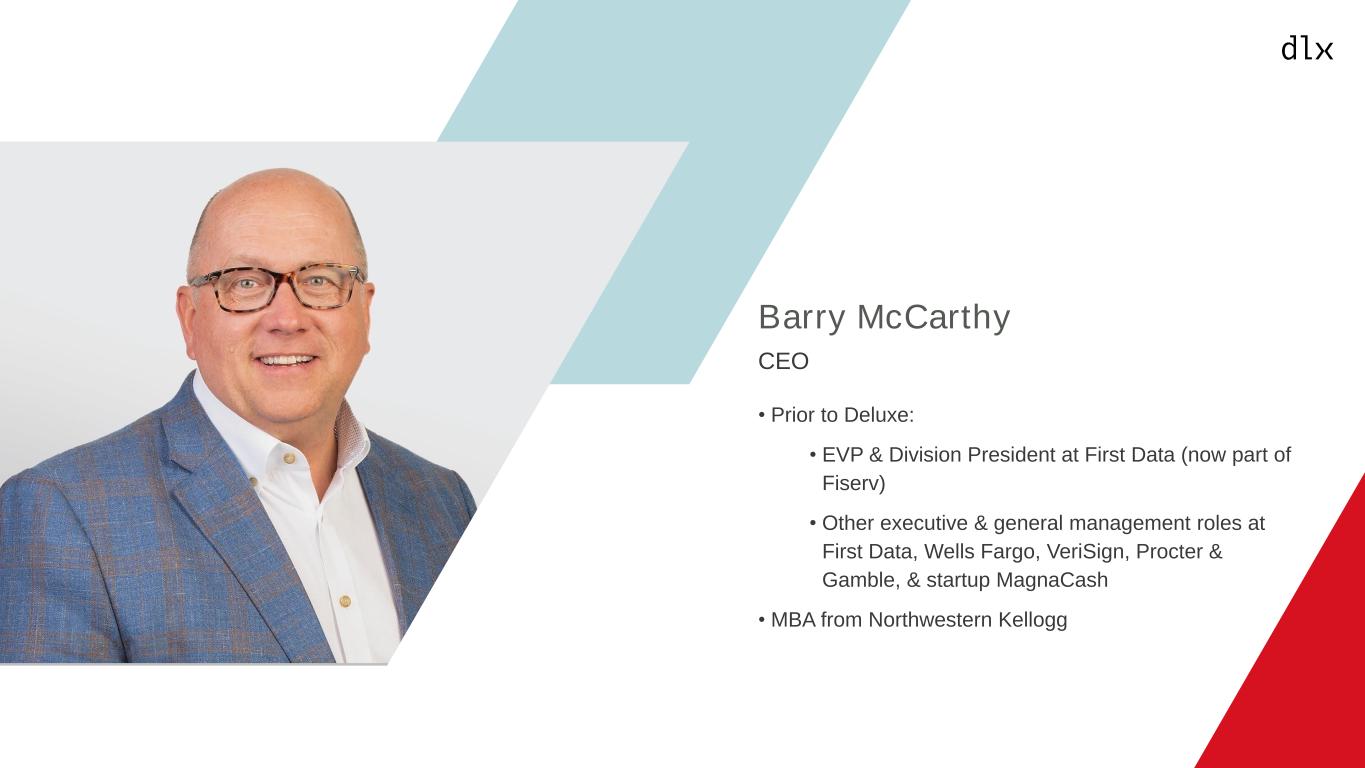
• Prior to Deluxe: • EVP & Division President at First Data (now part of Fiserv) • Other executive & general management roles at First Data, Wells Fargo, VeriSign, Procter & Gamble, & startup MagnaCash • MBA from Northwestern Kellogg CEO Barry McCarthy

P R O P O S A L WE ARE NOT THE DELUXE YOU ONCE KNEW NOW AN ORGANIC EBITDA GROWTH & DELEVERAGING STORY
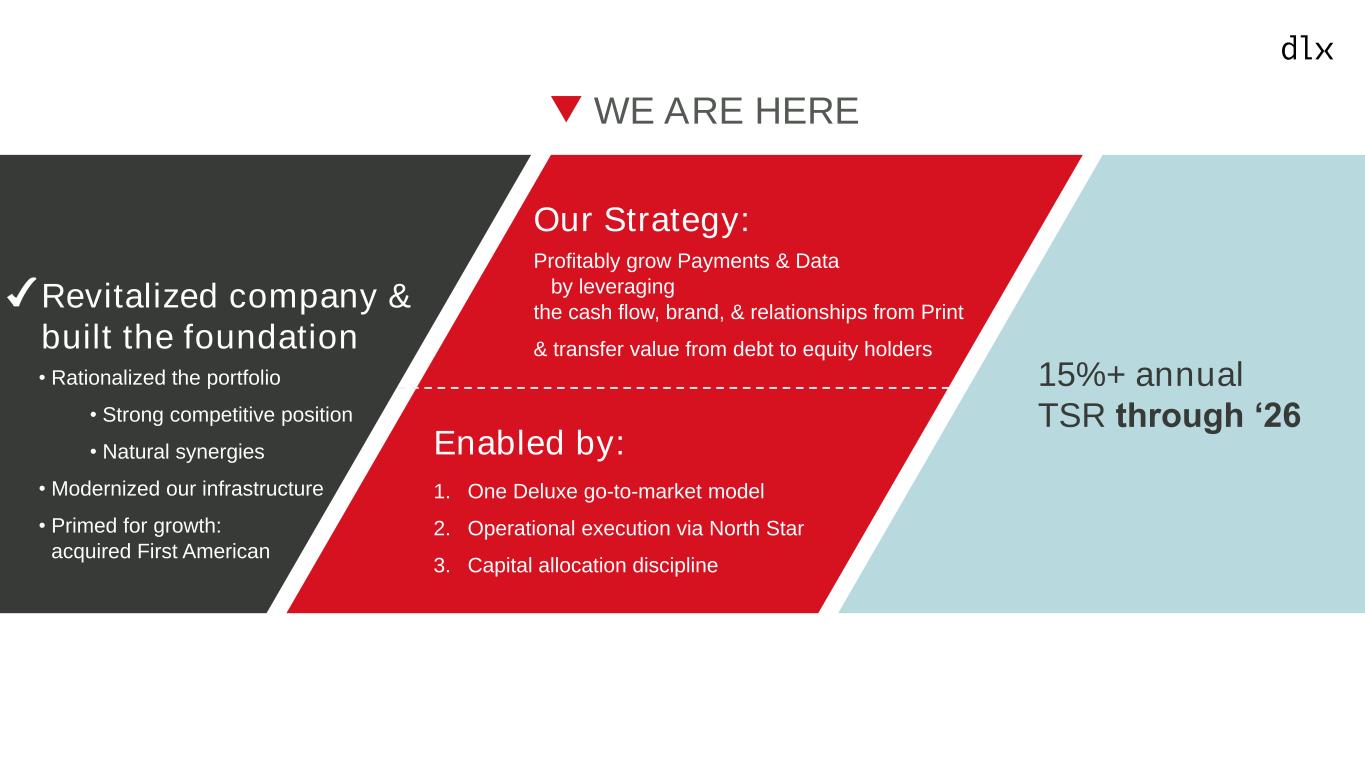
15%+ annual TSR through ‘26 WE ARE HERE Enabled by: 1. One Deluxe go-to-market model 2. Operational execution via North Star 3. Capital allocation discipline Profitably grow Payments & Data by leveraging the cash flow, brand, & relationships from Print & transfer value from debt to equity holders Our Strategy: Revitalized company & built the foundation • Rationalized the portfolio • Strong competitive position • Natural synergies • Modernized our infrastructure • Primed for growth: acquired First American
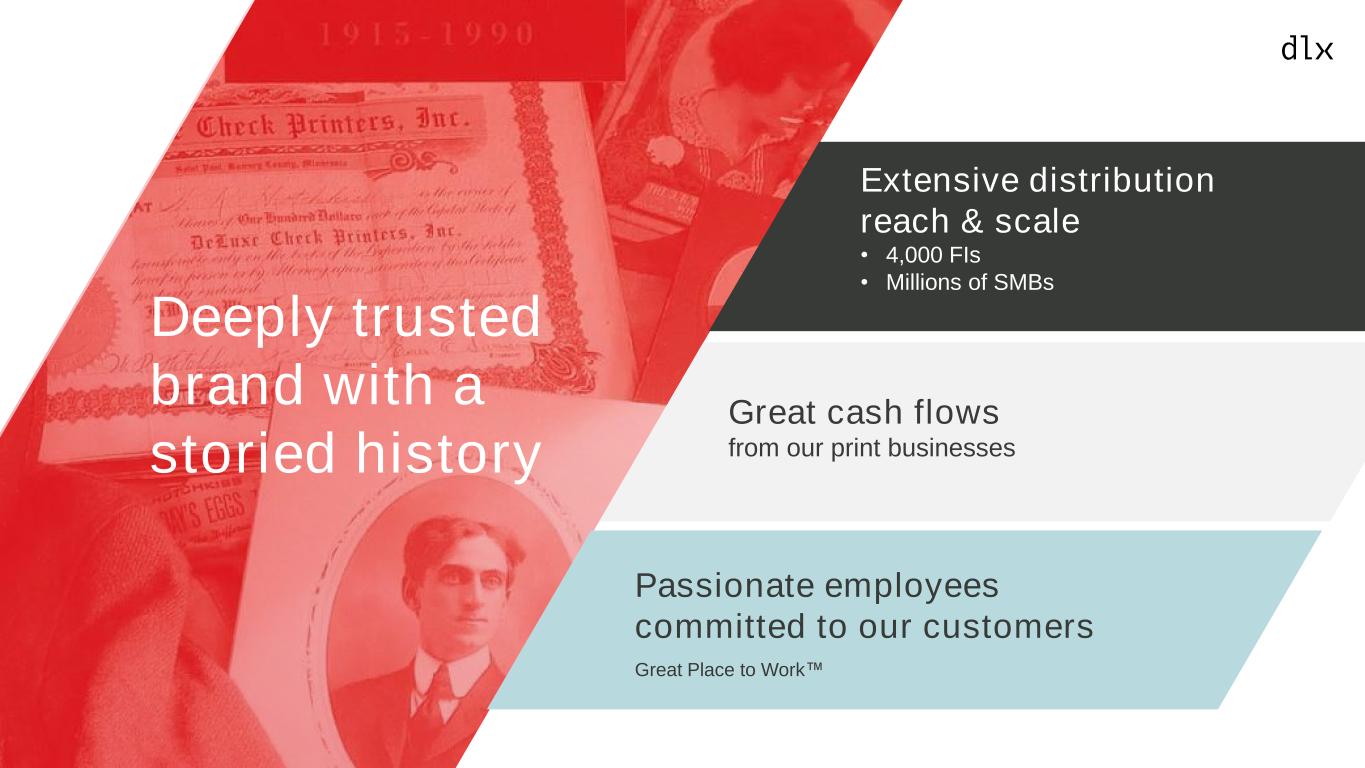
Deeply trusted brand with a storied history Passionate employees committed to our customers Great Place to Work™ Extensive distribution reach & scale • 4,000 FIs • Millions of SMBs Great cash flows from our print businesses
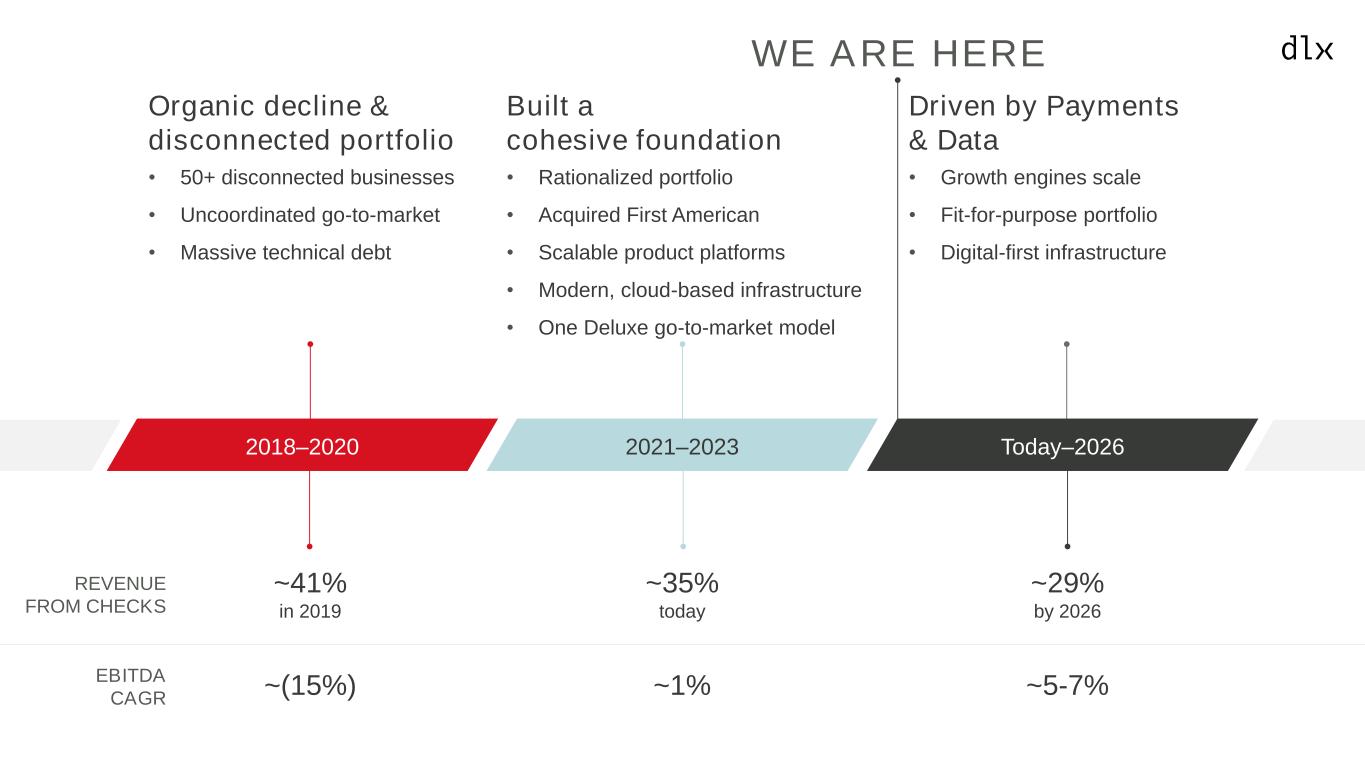
Organic decline & disconnected portfolio • 50+ disconnected businesses • Uncoordinated go-to-market • Massive technical debt ~41% in 2019 ~(15%) Built a cohesive foundation • Rationalized portfolio • Acquired First American • Scalable product platforms • Modern, cloud-based infrastructure • One Deluxe go-to-market model Driven by Payments & Data • Growth engines scale • Fit-for-purpose portfolio • Digital-first infrastructure 2018–2020 2021–2023 Today–2026 ~35% today ~1% ~29% by 2026 ~5-7% WE ARE HERE REVENUE FROM CHECKS EBITDA CAGR
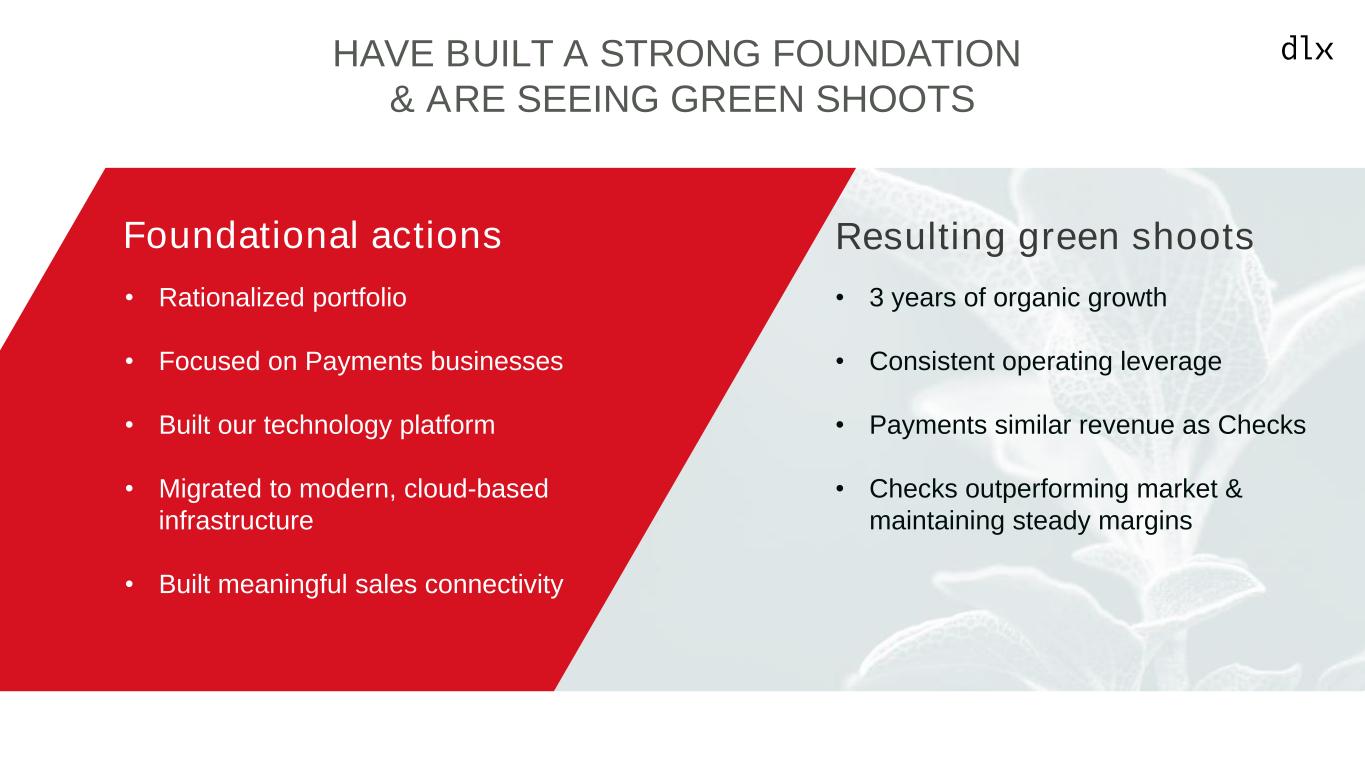
HAVE BUILT A STRONG FOUNDATION & ARE SEEING GREEN SHOOTS Foundational actions • Rationalized portfolio • Focused on Payments businesses • Built our technology platform • Migrated to modern, cloud-based infrastructure • Built meaningful sales connectivity Resulting green shoots • 3 years of organic growth • Consistent operating leverage • Payments similar revenue as Checks • Checks outperforming market & maintaining steady margins
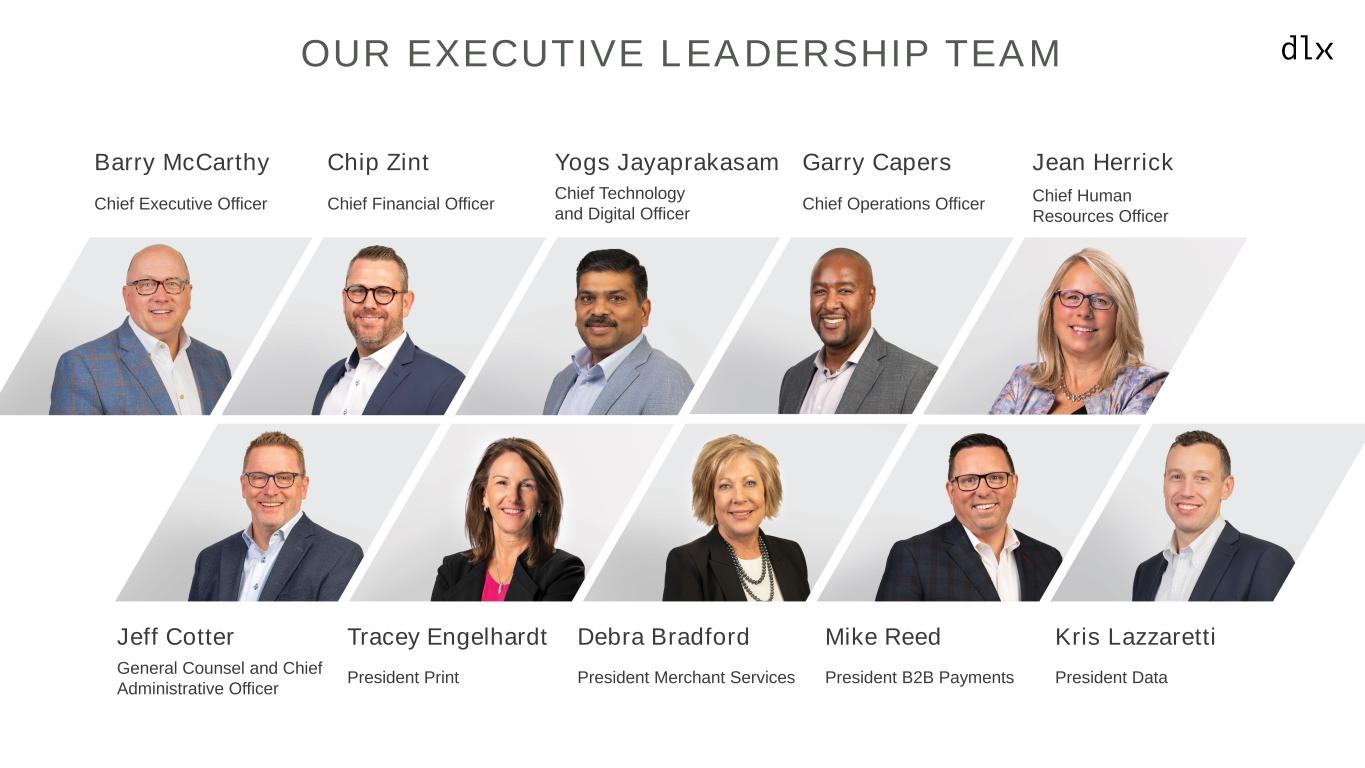
OUR EXECUTIVE LEADERSHIP TEAM Chip Zint Chief Financial Officer Yogs Jayaprakasam Chief Technology and Digital Officer Jean Herrick Chief Human Resources Officer Garry Capers Chief Operations Officer Barry McCarthy Chief Executive Officer Tracey Engelhardt President Print Debra Bradford President Merchant Services Kris Lazzaretti President Data Mike Reed President B2B Payments Jeff Cotter General Counsel and Chief Administrative Officer
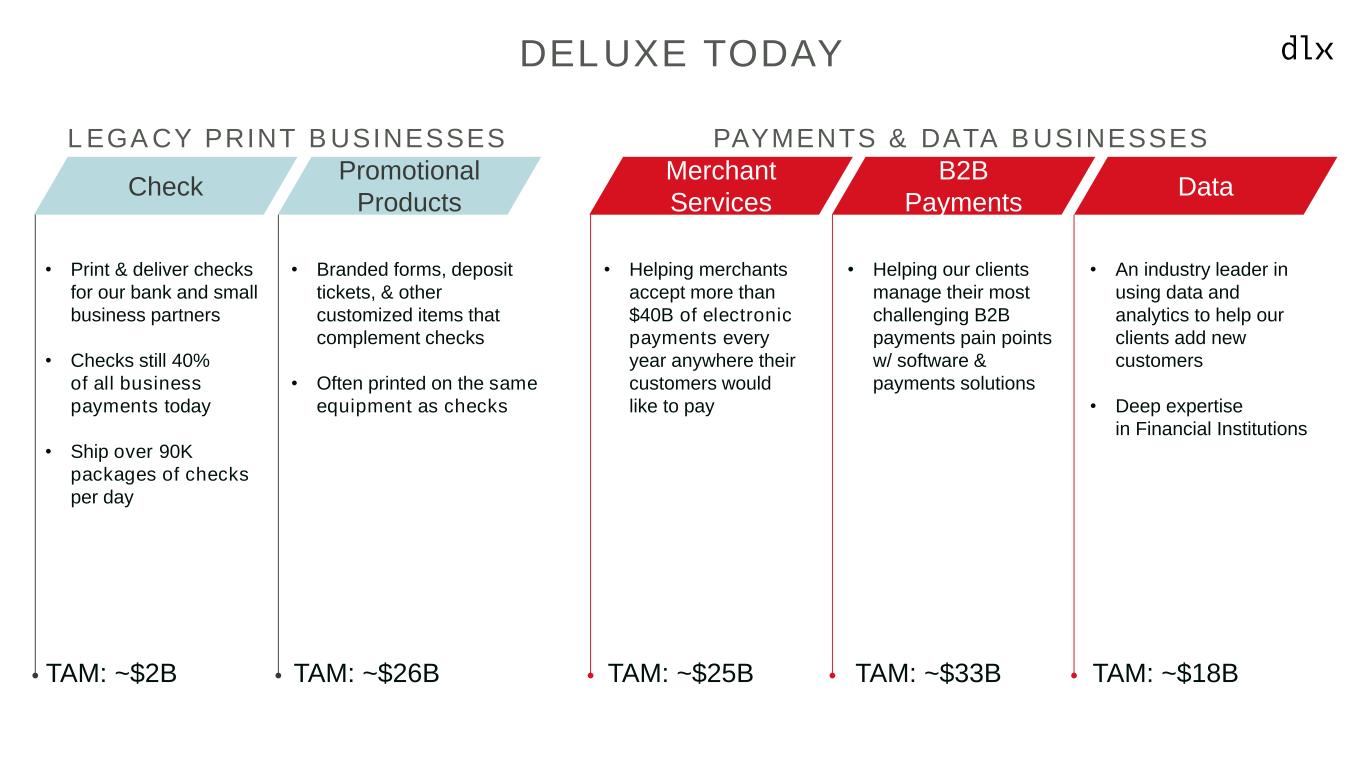
DELUXE TODAY TAM: ~$2B TAM: ~$26B TAM: ~$25B TAM: ~$33B TAM: ~$18B • Print & deliver checks for our bank and small business partners • Checks still 40% of all business payments today • Ship over 90K packages of checks per day • Branded forms, deposit tickets, & other customized items that complement checks • Often printed on the same equipment as checks • Helping merchants accept more than $40B of electronic payments every year anywhere their customers would like to pay • Helping our clients manage their most challenging B2B payments pain points w/ software & payments solutions • An industry leader in using data and analytics to help our clients add new customers • Deep expertise in Financial Institutions PAYMENTS & DATA BUSINESSESLEGACY PRINT BUSINESSES Check Promotional Products Merchant Services B2B Payments Data
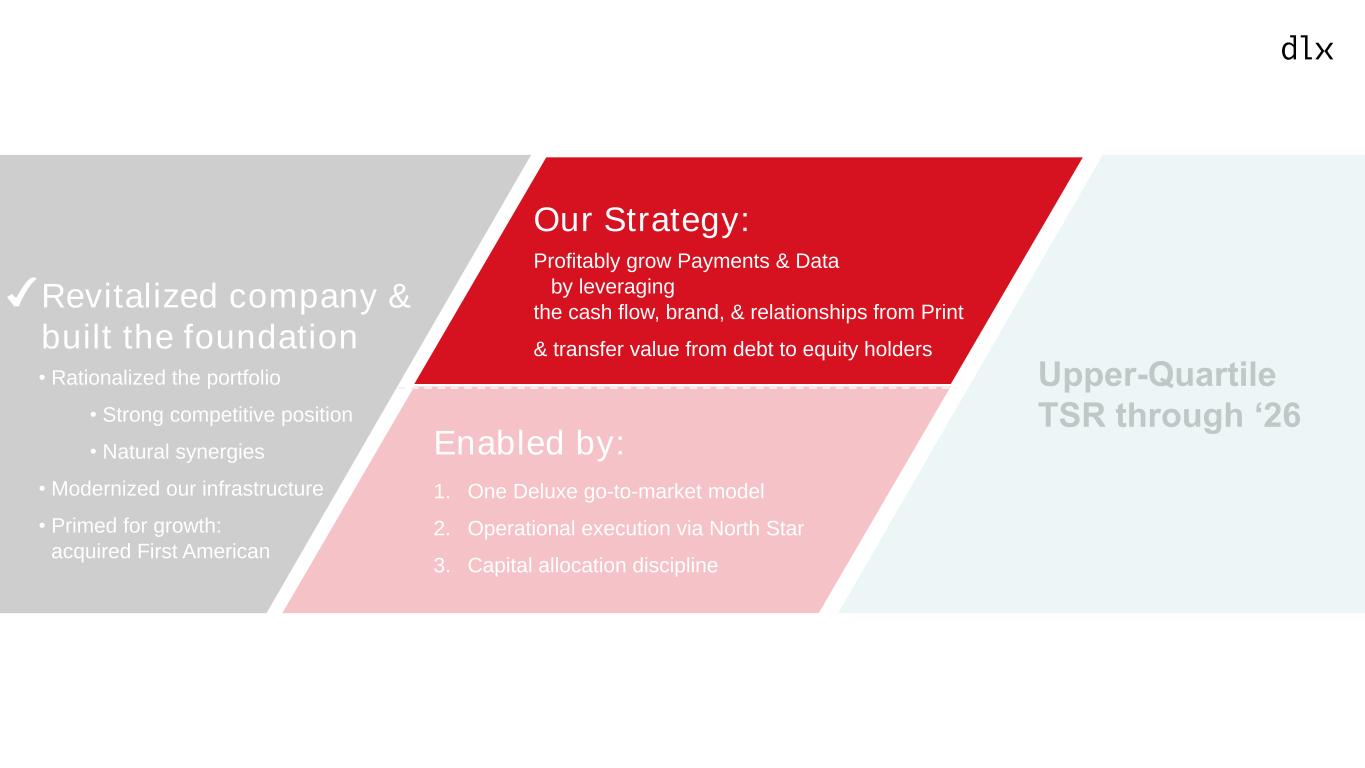
Enabled by: 1. One Deluxe go-to-market model 2. Operational execution via North Star 3. Capital allocation discipline Our Strategy: Revitalized company & built the foundation • Rationalized the portfolio • Strong competitive position • Natural synergies • Modernized our infrastructure • Primed for growth: acquired First American Profitably grow Payments & Data by leveraging the cash flow, brand, & relationships from Print & transfer value from debt to equity holders

• Reliable cash flows to pay down debt and re-invest in Payments & Data businesses • Large installed base of FIs & SMBs Merchant Services PAYMENTS & DATA BUSINESSESLEGACY PRINT BUSINESSES B2B Payments DataCheck Promotional Products Corporate CORPORATE Secular growth markets • Merchant: Deep vertical expertise • B2B Payments: Software & payments that ease complex customer pain points • Data: Market leader in financial institutions • ~15-20% corporate cost reduction by '26 OUR STRATEGY IS SIMPLE GROW PAYMENTS & DATA, PAY DOWN DEBT, & CUT CORPORATE COSTS OUR BUSINESSES VALUE DRIVERS ’23 REVENUE ‘23–’26 EST. CAGR ‘23 COMPARABLE ADJUSTED EBITDA ‘23 COMP ADJ. EBITDA MARGIN % ~$1.3B (1-5%) ~425–430MM ~33% ~$0.9B 6–10% ~$150–155MM ~19% - - (~$190–195MM) - v
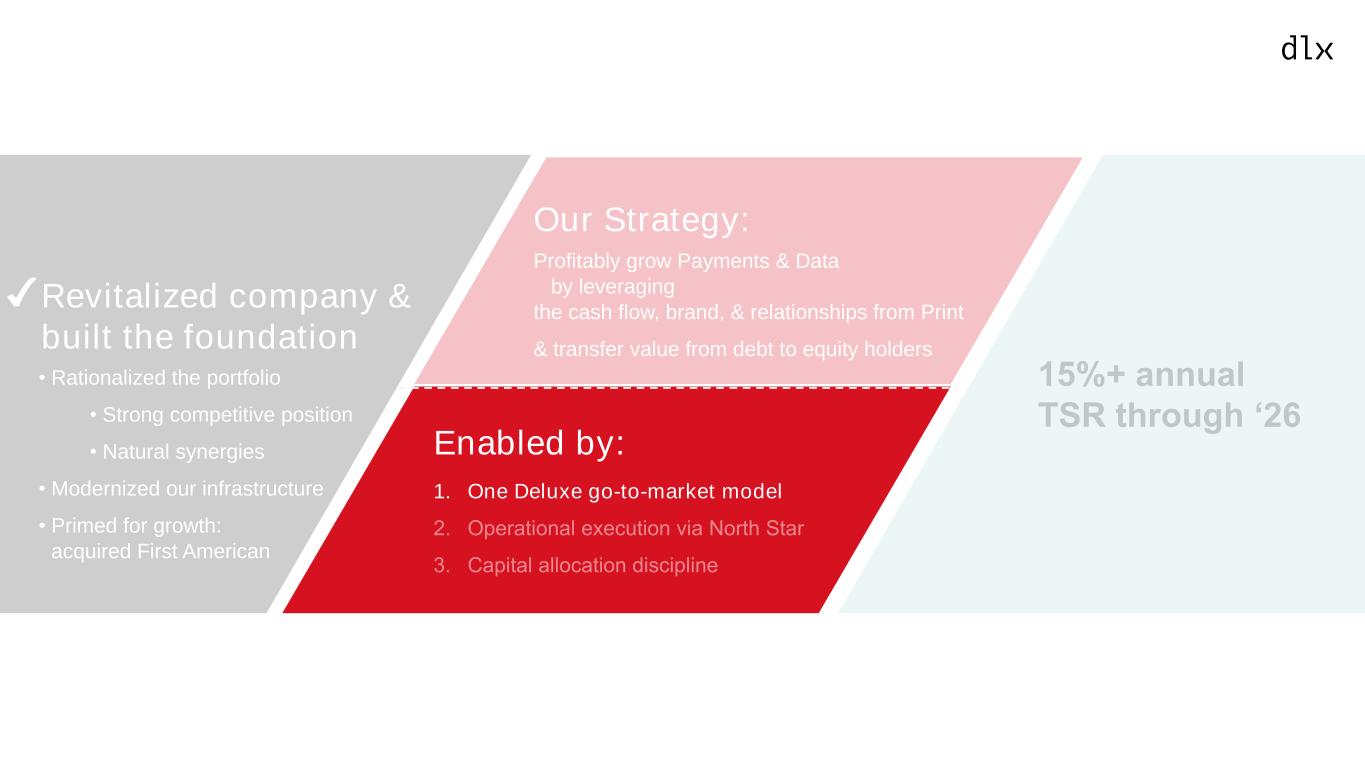
Enabled by: 1. One Deluxe go-to-market model Our Strategy: Revitalized company & built the foundation • Rationalized the portfolio • Strong competitive position • Natural synergies • Modernized our infrastructure • Primed for growth: acquired First American Profitably grow Payments & Data by leveraging the cash flow, brand, & relationships from Print & transfer value from debt to equity holders
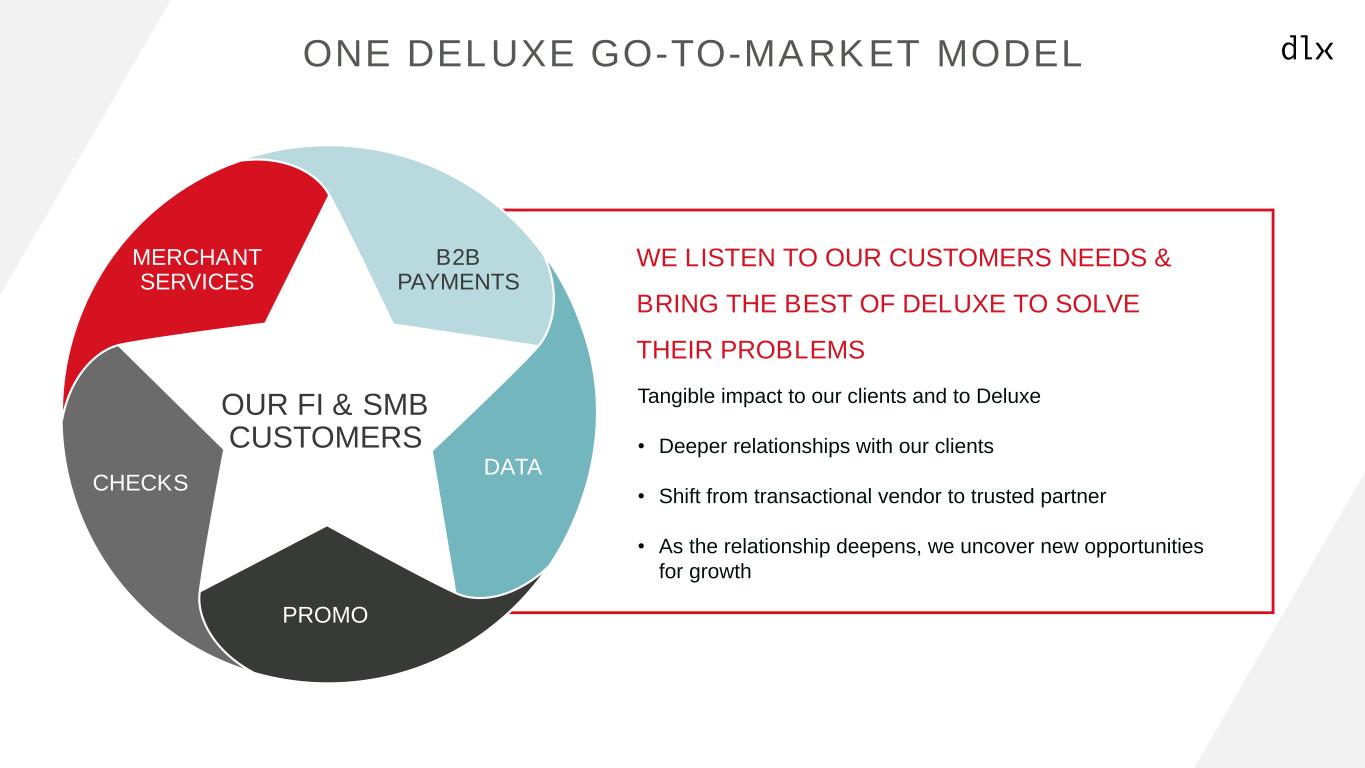
WE LISTEN TO OUR CUSTOMERS NEEDS & BRING THE BEST OF DELUXE TO SOLVE THEIR PROBLEMS Tangible impact to our clients and to Deluxe • Deeper relationships with our clients • Shift from transactional vendor to trusted partner • As the relationship deepens, we uncover new opportunities for growth OUR FI & SMB CUSTOMERS MERCHANT SERVICES B2B PAYMENTS CHECKS DATA PROMO ONE DELUXE GO-TO-MARKET MODEL
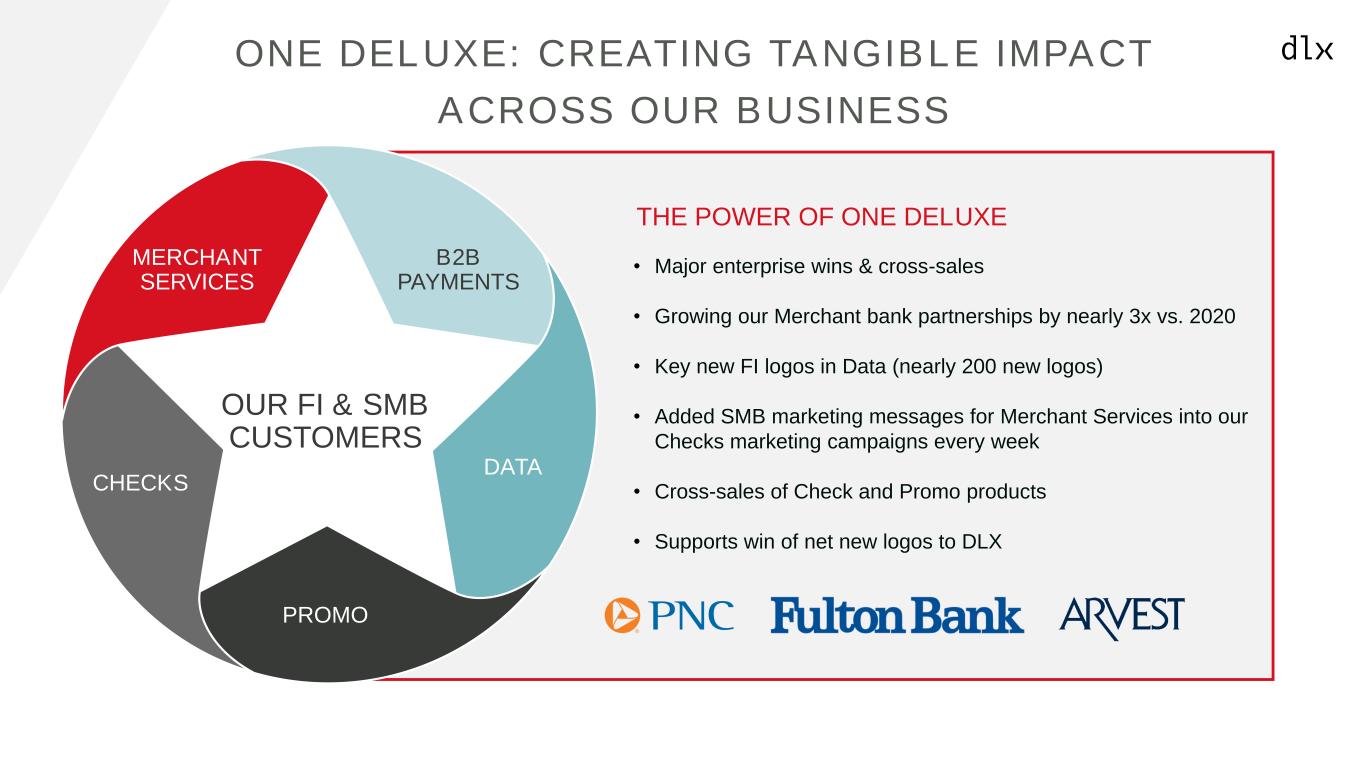
THE POWER OF ONE DELUXE • Major enterprise wins & cross-sales • Growing our Merchant bank partnerships by nearly 3x vs. 2020 • Key new FI logos in Data (nearly 200 new logos) • Added SMB marketing messages for Merchant Services into our Checks marketing campaigns every week • Cross-sales of Check and Promo products • Supports win of net new logos to DLX MERCHANT SERVICES B2B PAYMENTS CHECKS DATA PROMO ONE DELUXE: CREATING TANGIBLE IMPACT ACROSS OUR BUSINESS OUR FI & SMB CUSTOMERS
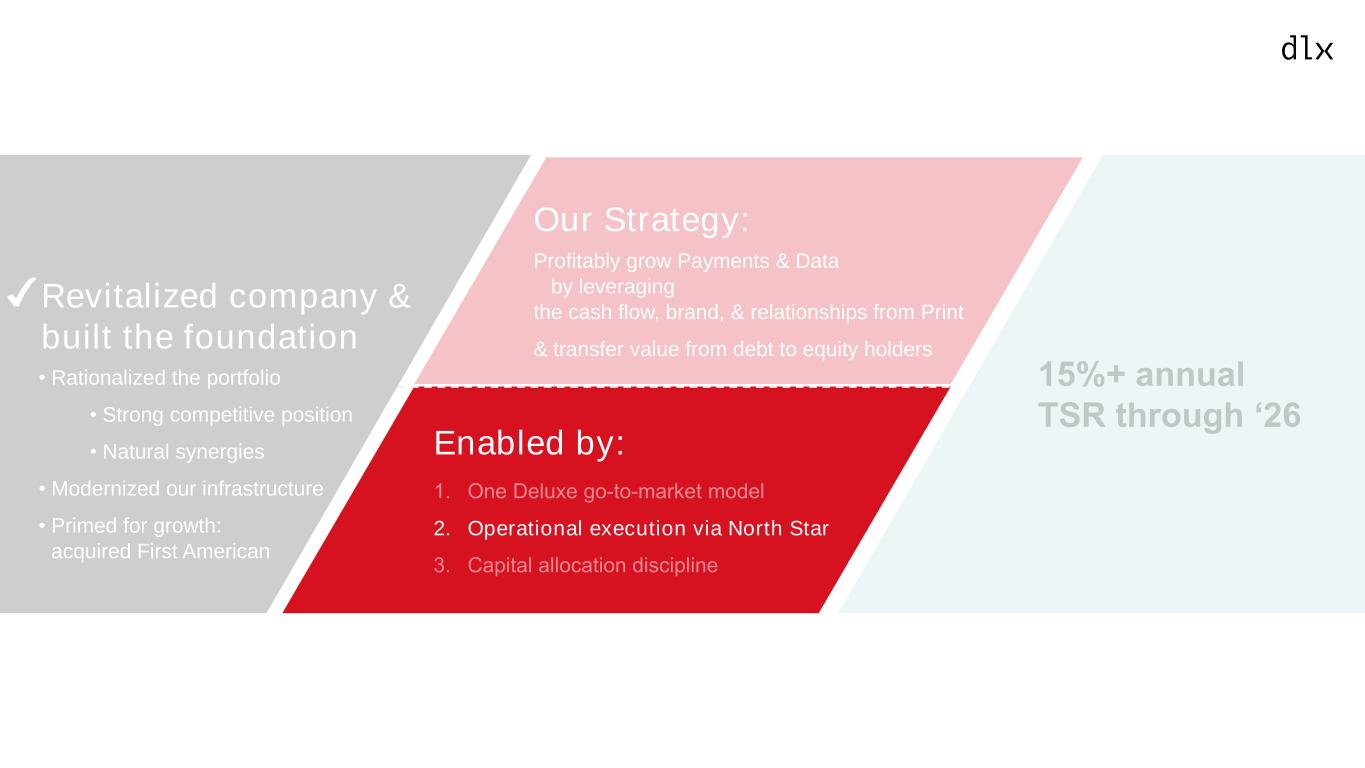
Enabled by: 2. Operational execution via North Star Our Strategy: Revitalized company & built the foundation • Rationalized the portfolio • Strong competitive position • Natural synergies • Modernized our infrastructure • Primed for growth: acquired First American Profitably grow Payments & Data by leveraging the cash flow, brand, & relationships from Print & transfer value from debt to equity holders
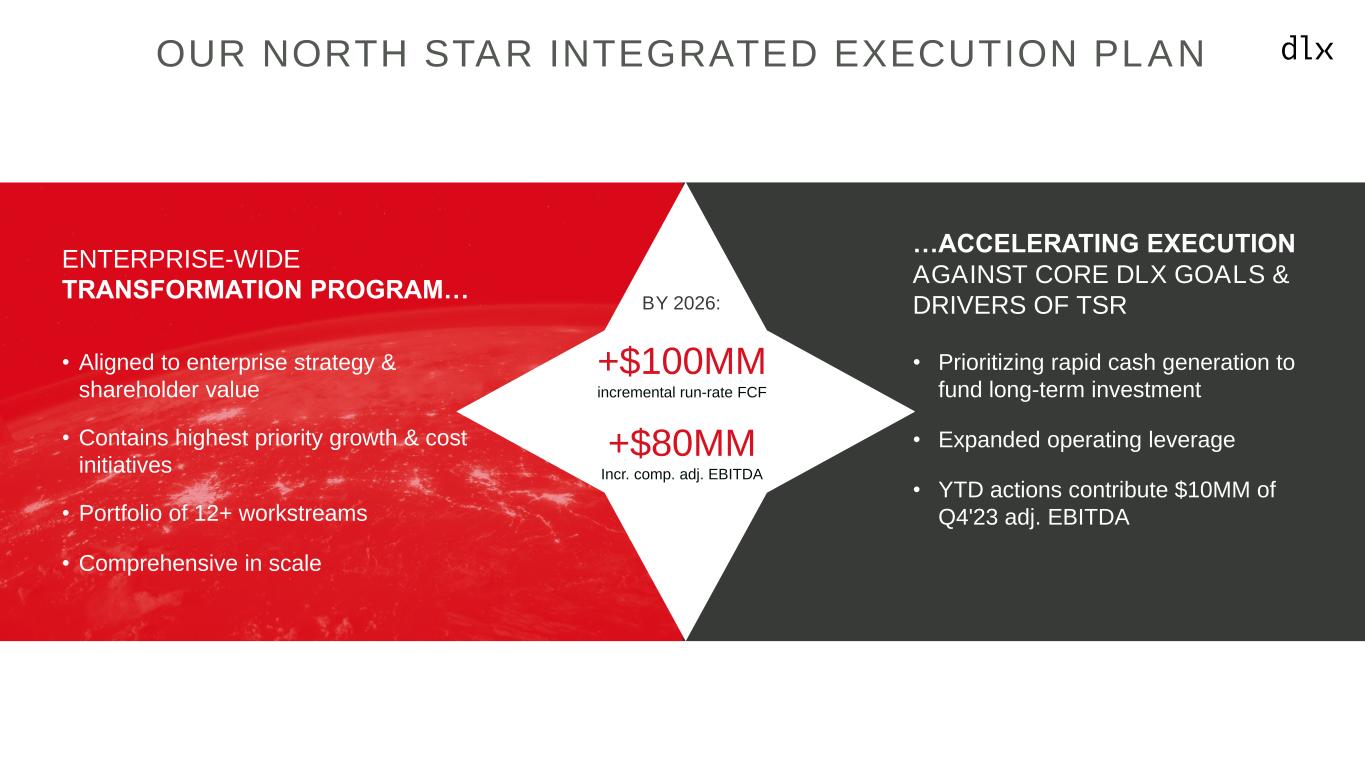
ENTERPRISE-WIDE TRANSFORMATION PROGRAM… • Aligned to enterprise strategy & shareholder value • Contains highest priority growth & cost initiatives • Portfolio of 12+ workstreams • Comprehensive in scale OUR NORTH STAR INTEGRATED EXECUTION PLAN +$100MM incremental run-rate FCF +$80MM Incr. comp. adj. EBITDA BY 2026: …ACCELERATING EXECUTION AGAINST CORE DLX GOALS & DRIVERS OF TSR • Prioritizing rapid cash generation to fund long-term investment • Expanded operating leverage • YTD actions contribute $10MM of Q4'23 adj. EBITDA
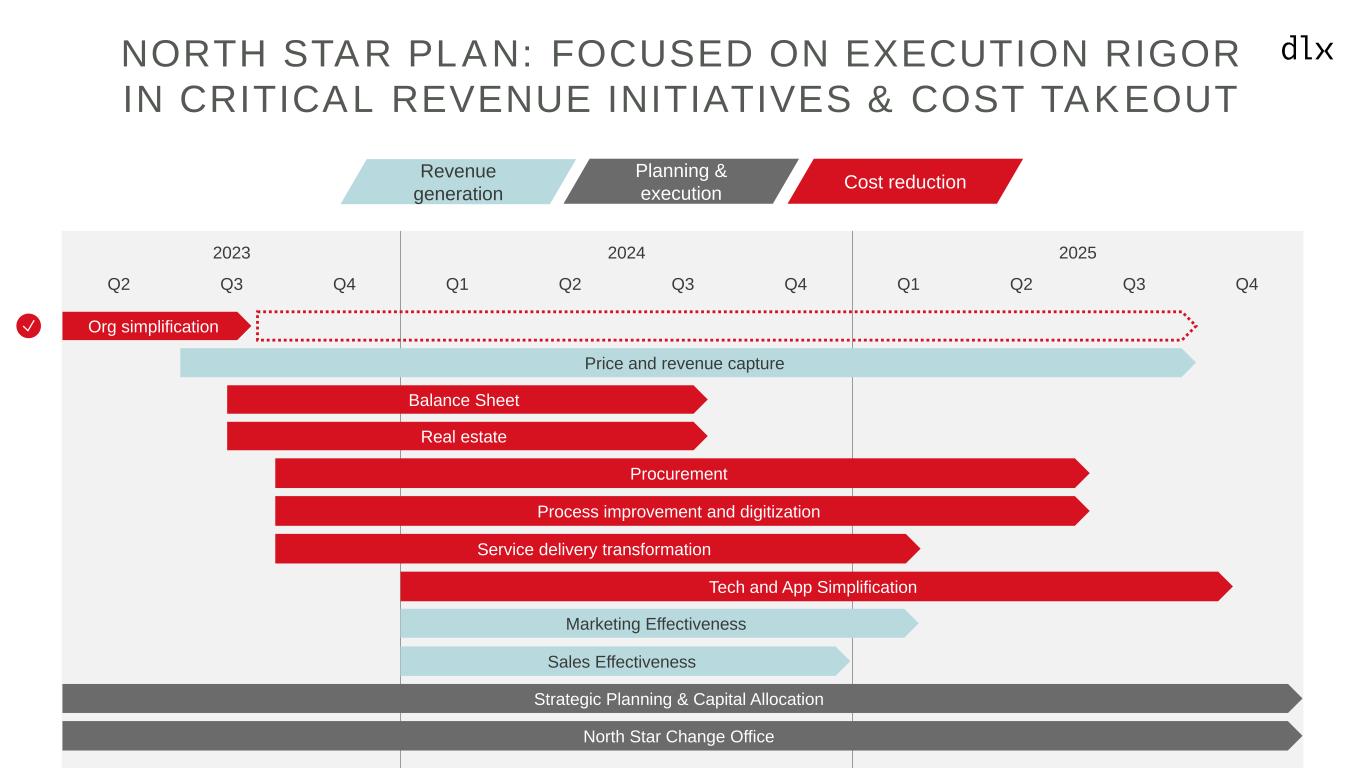
Revenue generation Planning & execution Cost reduction 2023 2024 2025 Q2 Q3 Q4 Q1 Q2 Q3 Q4 Q1 Q2 Q3 Q4 Org simplification NORTH STAR PLAN: FOCUSED ON EXECUTION RIGOR IN CRITICAL REVENUE INITIATIVES & COST TAKEOUT Price and revenue capture Balance Sheet Real estate Procurement Process improvement and digitization Service delivery transformation Tech and App Simplification Marketing Effectiveness Sales Effectiveness North Star Change Office Strategic Planning & Capital Allocation
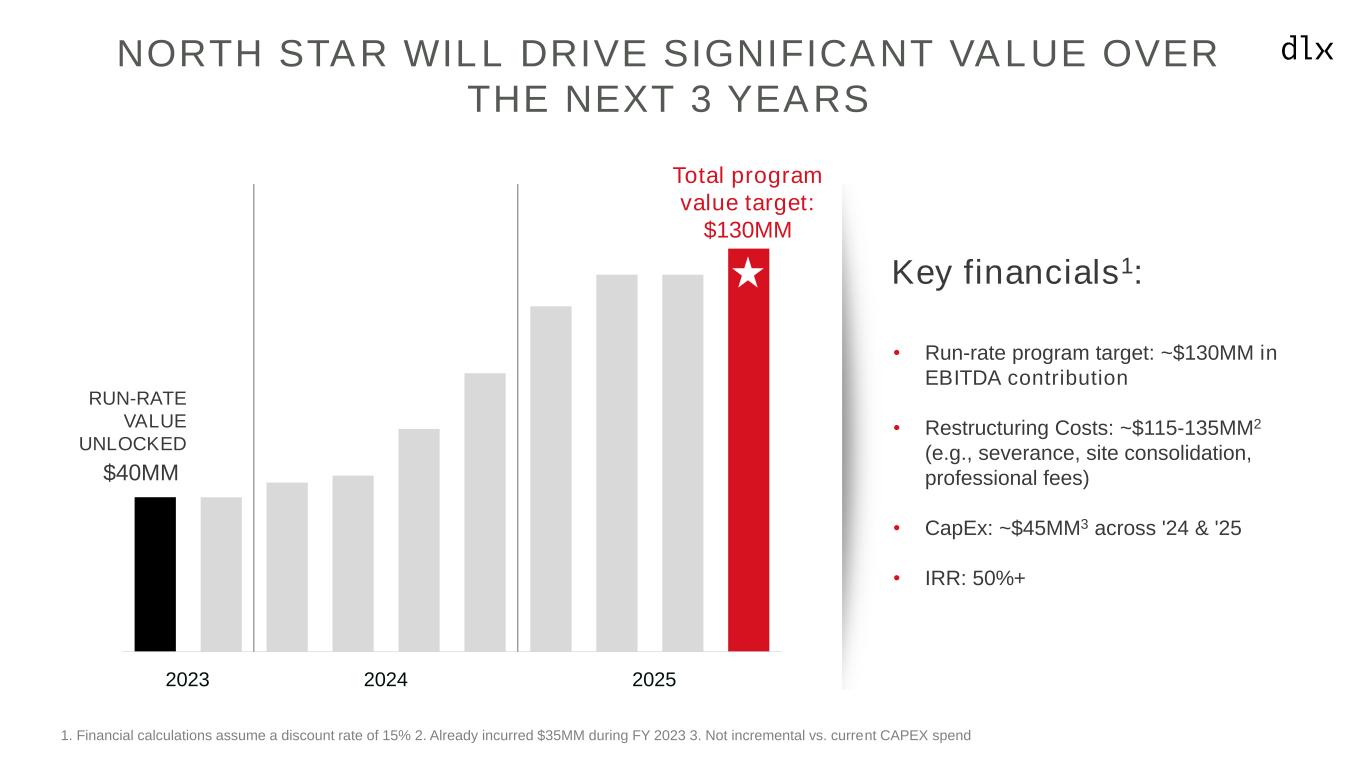
NORTH STAR WILL DRIVE SIGNIFICANT VALUE OVER THE NEXT 3 YEARS 2023 2024 2025 $40MM Total program value target: $130MM RUN-RATE VALUE UNLOCKED 1. Financial calculations assume a discount rate of 15% 2. Already incurred $35MM during FY 2023 3. Not incremental vs. current CAPEX spend Key financials1: • Run-rate program target: ~$130MM in EBITDA contribution • Restructuring Costs: ~$115-135MM2 (e.g., severance, site consolidation, professional fees) • CapEx: ~$45MM3 across '24 & '25 • IRR: 50%+
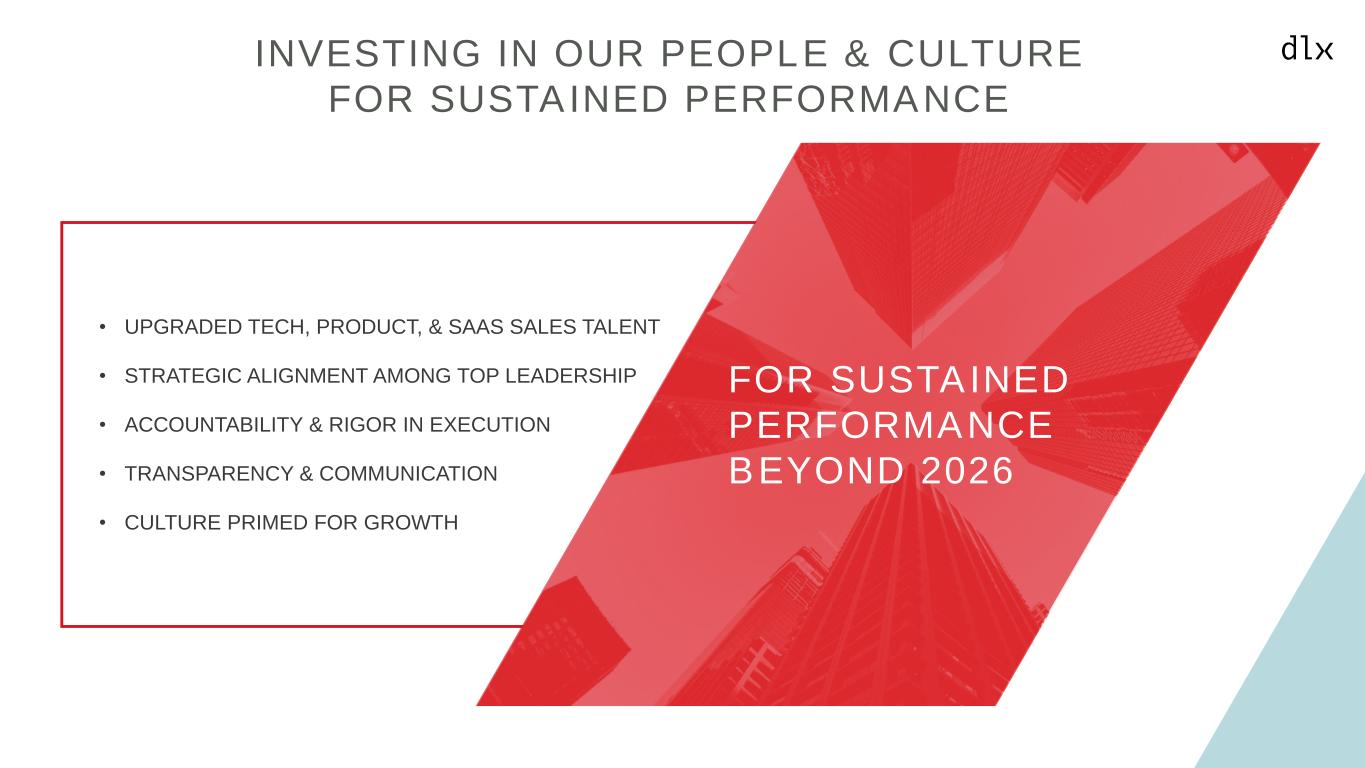
• UPGRADED TECH, PRODUCT, & SAAS SALES TALENT • STRATEGIC ALIGNMENT AMONG TOP LEADERSHIP • ACCOUNTABILITY & RIGOR IN EXECUTION • TRANSPARENCY & COMMUNICATION • CULTURE PRIMED FOR GROWTH FOR SUSTAINED PERFORMANCE BEYOND 2026 INVESTING IN OUR PEOPLE & CULTURE FOR SUSTAINED PERFORMANCE
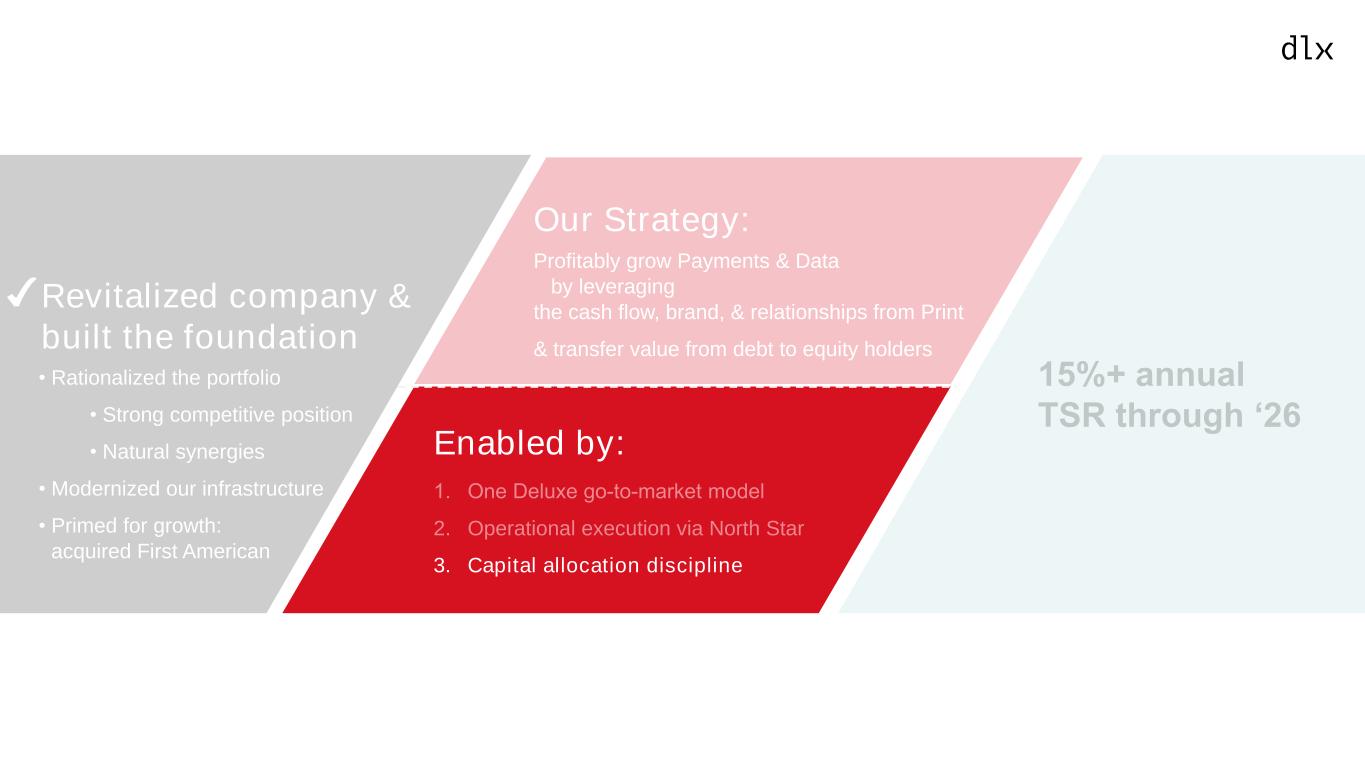
Enabled by: 2. Operational execution via North Star 3. Capital allocation discipline Our Strategy: Revitalized company & built the foundation • Rationalized the portfolio • Strong competitive position • Natural synergies • Modernized our infrastructure • Primed for growth: acquired First American Profitably grow Payments & Data by leveraging the cash flow, brand, & relationships from Print & transfer value from debt to equity holders
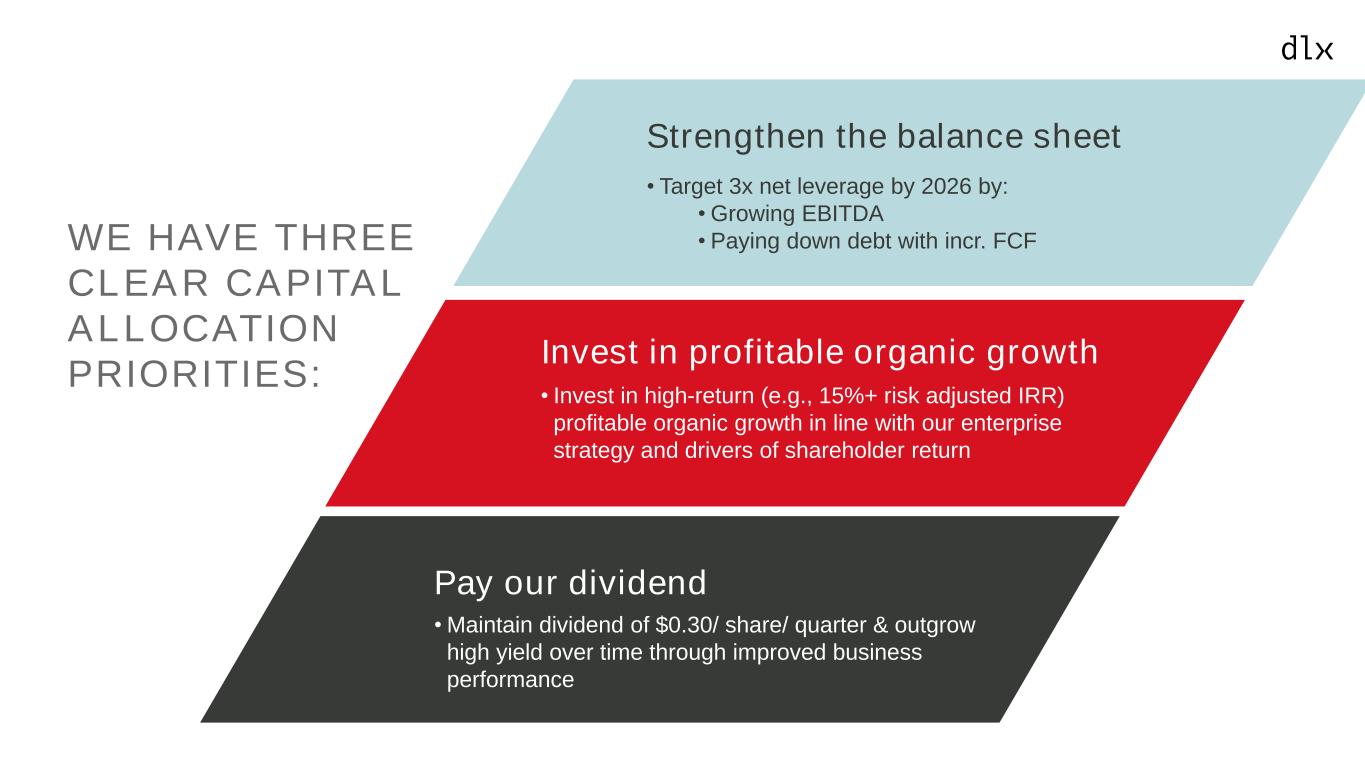
WE HAVE THREE CLEAR CAPITAL ALLOCATION PRIORITIES: Strengthen the balance sheet • Target 3x net leverage by 2026 by: • Growing EBITDA • Paying down debt with incr. FCF Invest in profitable organic growth • Invest in high-return (e.g., 15%+ risk adjusted IRR) profitable organic growth in line with our enterprise strategy and drivers of shareholder return Pay our dividend • Maintain dividend of $0.30/ share/ quarter & outgrow high yield over time through improved business performance
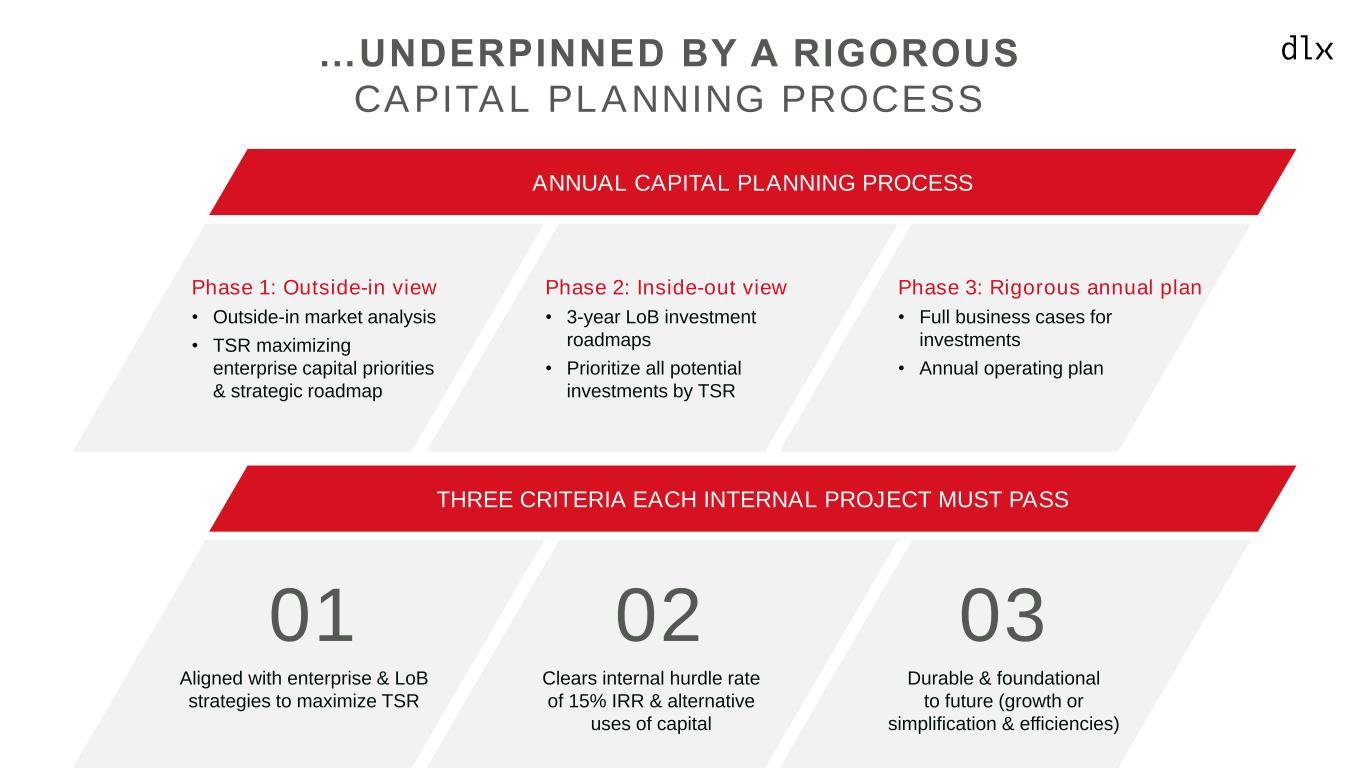
ANNUAL CAPITAL PLANNING PROCESS Phase 1: Outside-in view • Outside-in market analysis • TSR maximizing enterprise capital priorities & strategic roadmap Phase 2: Inside-out view • 3-year LoB investment roadmaps • Prioritize all potential investments by TSR Phase 3: Rigorous annual plan • Full business cases for investments • Annual operating plan …UNDERPINNED BY A RIGOROUS CAPITAL PLANNING PROCESS THREE CRITERIA EACH INTERNAL PROJECT MUST PASS Aligned with enterprise & LoB strategies to maximize TSR Clears internal hurdle rate of 15% IRR & alternative uses of capital Durable & foundational to future (growth or simplification & efficiencies) 01 02 03
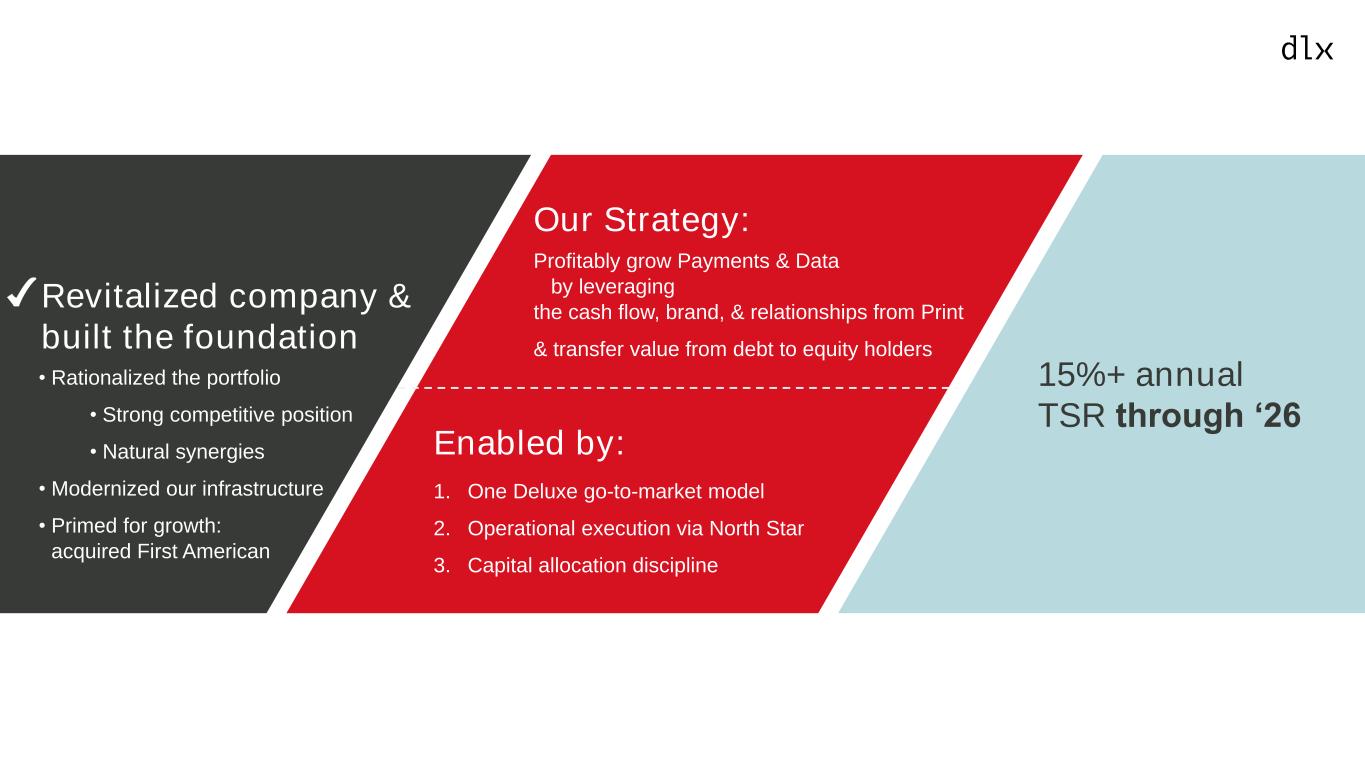
15%+ annual TSR through ‘26 Enabled by: 1. One Deluxe go-to-market model 2. Operational execution via North Star 3. Capital allocation discipline Our Strategy: Revitalized company & built the foundation • Rationalized the portfolio • Strong competitive position • Natural synergies • Modernized our infrastructure • Primed for growth: acquired First American Profitably grow Payments & Data by leveraging the cash flow, brand, & relationships from Print & transfer value from debt to equity holders
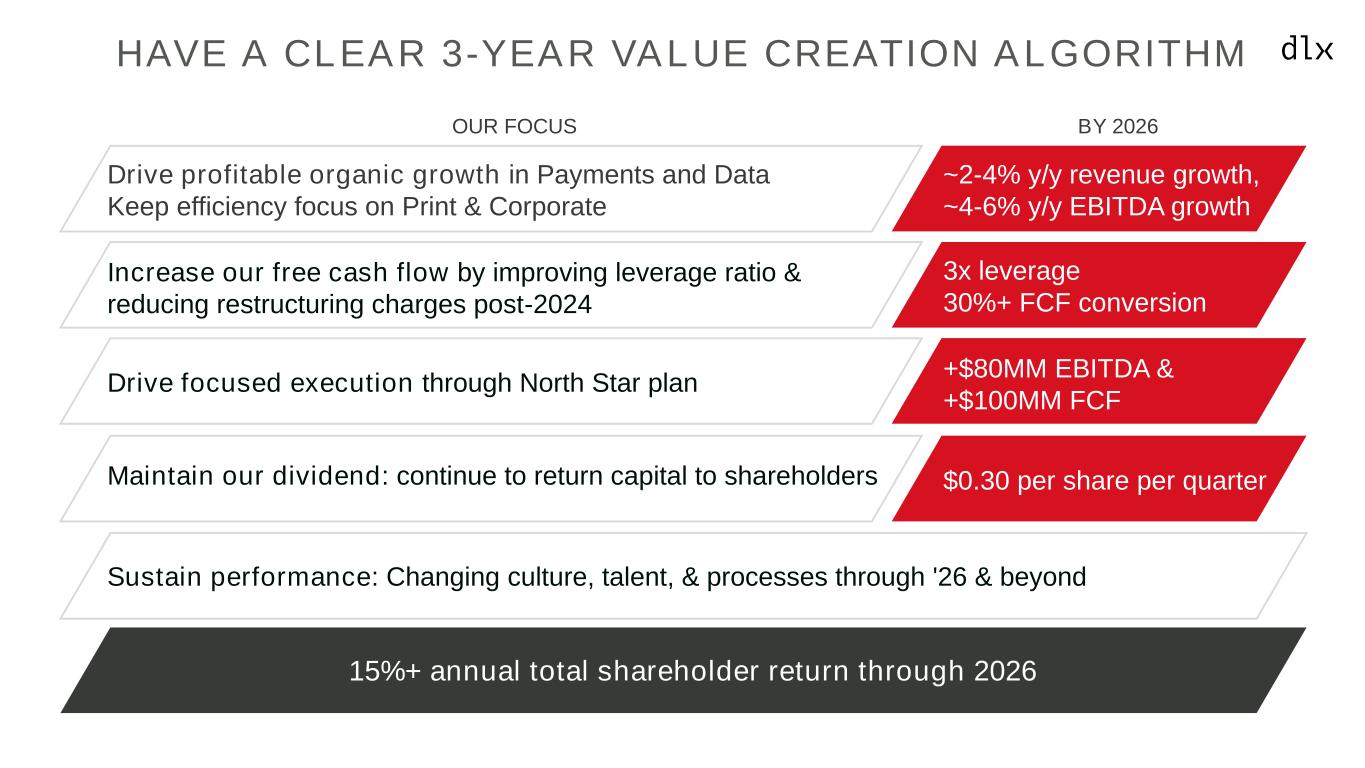
Drive profitable organic growth in Payments and Data Keep efficiency focus on Print & Corporate Increase our free cash flow by improving leverage ratio & reducing restructuring charges post-2024 Drive focused execution through North Star plan Maintain our dividend: continue to return capital to shareholders Sustain performance: Changing culture, talent, & processes through '26 & beyond OUR FOCUS BY 2026 ~2-4% y/y revenue growth, ~4-6% y/y EBITDA growth 3x leverage 30%+ FCF conversion +$80MM EBITDA & +$100MM FCF $0.30 per share per quarter 15%+ annual total shareholder return through 2026 HAVE A CLEAR 3-YEAR VALUE CREATION ALGORITHM
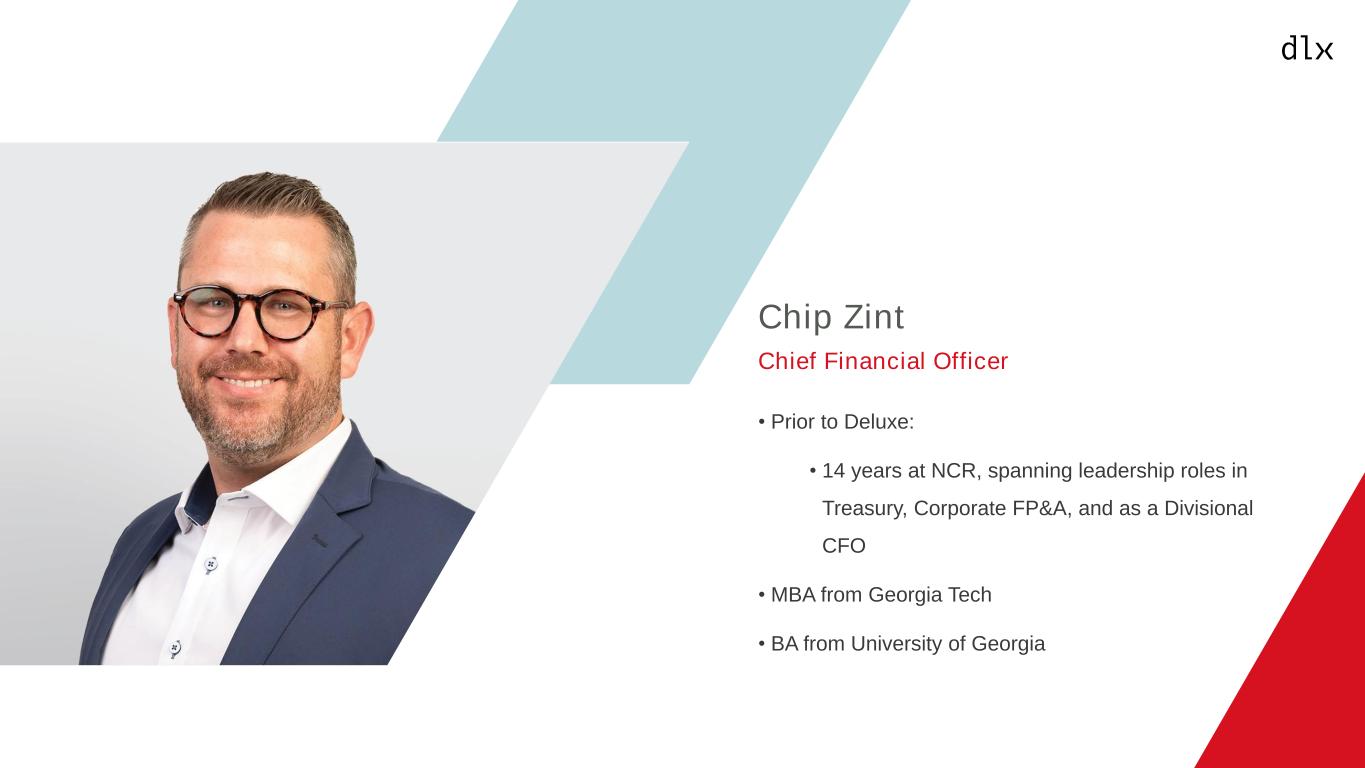
• Prior to Deluxe: • 14 years at NCR, spanning leadership roles in Treasury, Corporate FP&A, and as a Divisional CFO • MBA from Georgia Tech • BA from University of Georgia Chief Financial Officer Chip Zint

OUR OPERATIONS & TECHNOLOGY TRANSFORMATION
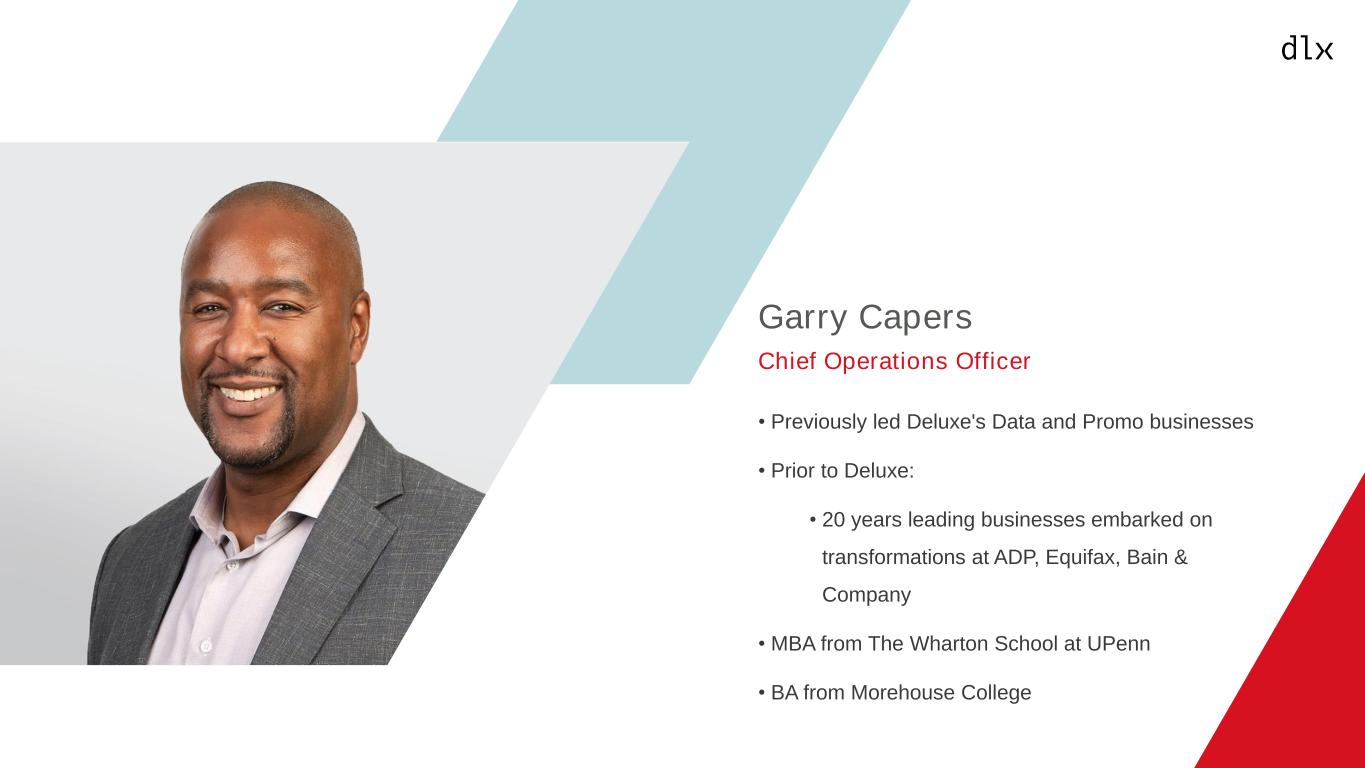
• Previously led Deluxe's Data and Promo businesses • Prior to Deluxe: • 20 years leading businesses embarked on transformations at ADP, Equifax, Bain & Company • MBA from The Wharton School at UPenn • BA from Morehouse College Chief Operations Officer Garry Capers
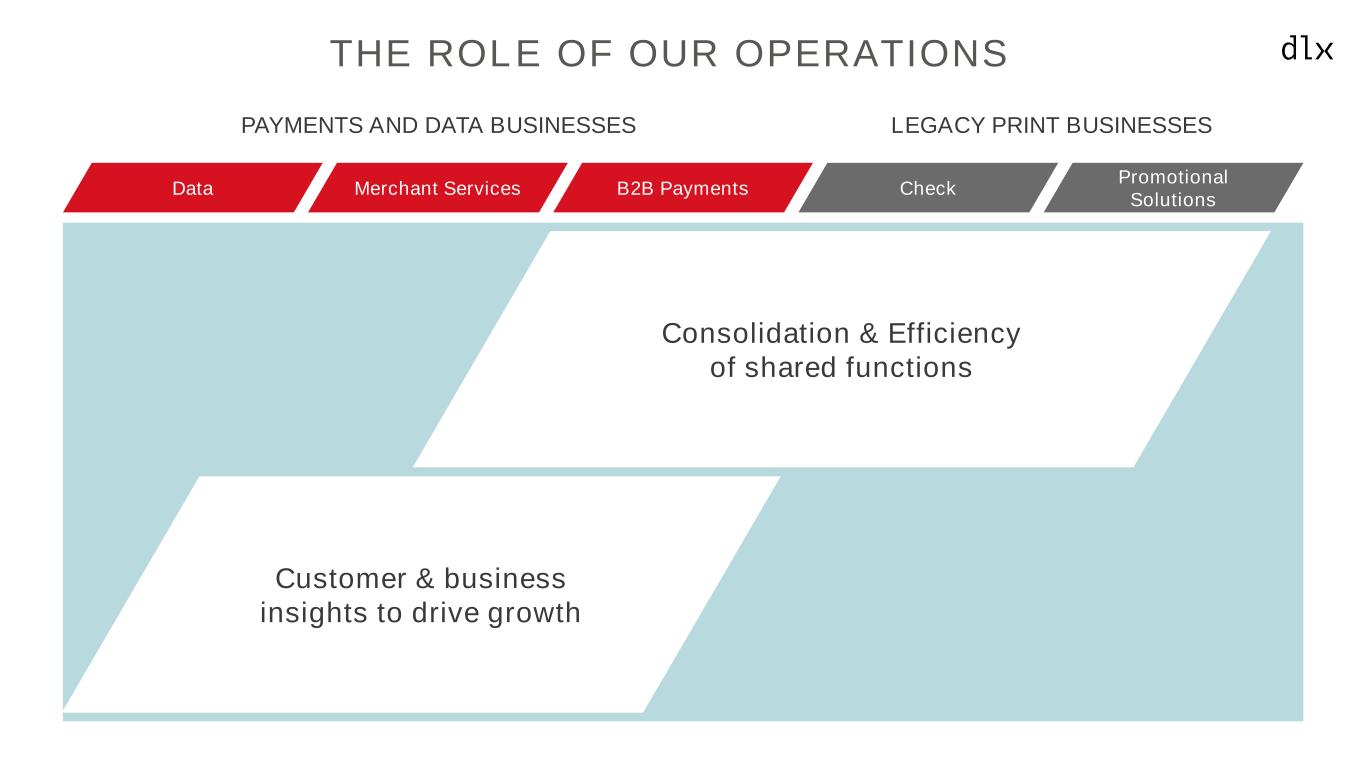
THE ROLE OF OUR OPERATIONS Data PAYMENTS AND DATA BUSINESSES LEGACY PRINT BUSINESSES Merchant Services B2B Payments Check Promotional Solutions Consolidation & Efficiency of shared functions Customer & business insights to drive growth
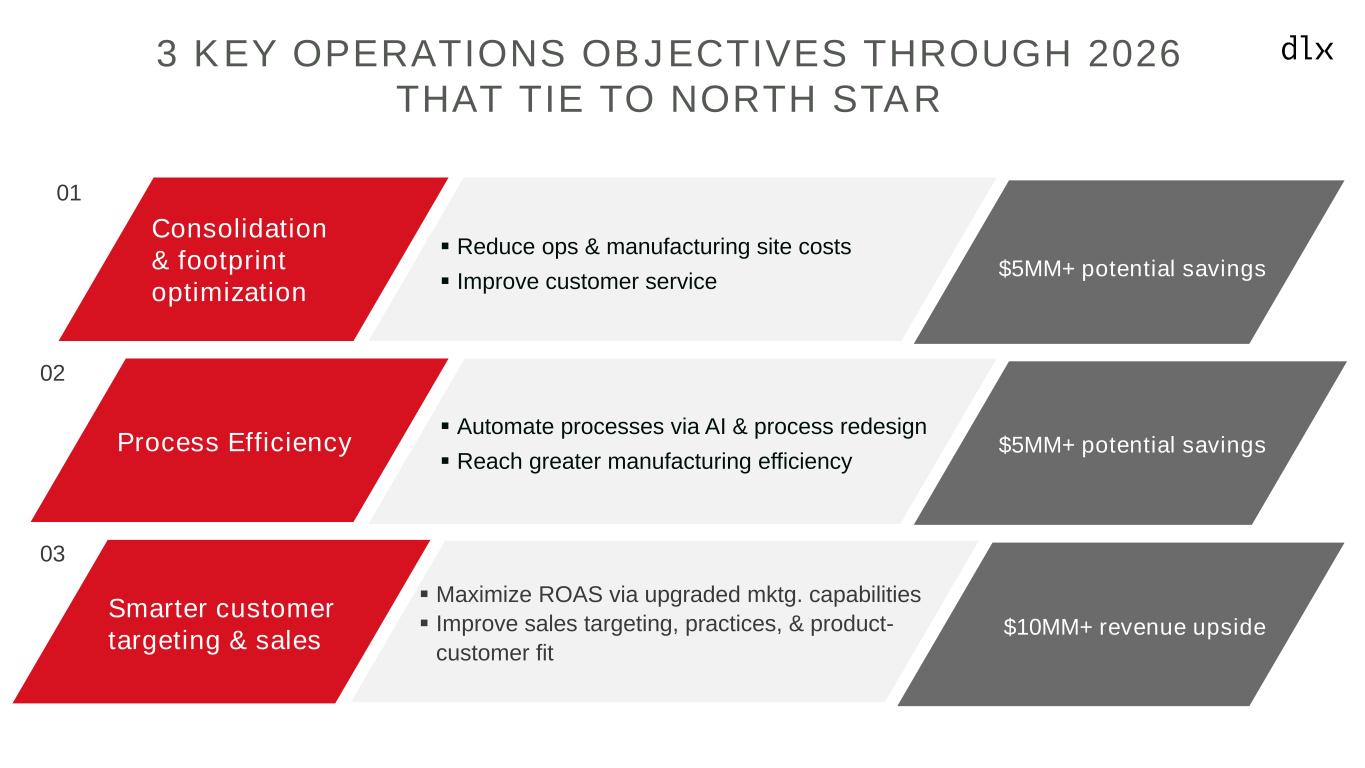
$5MM+ potential savings $10MM+ revenue upside $5MM+ potential savings 01 02 03 Consolidation & footprint optimization Smarter customer targeting & sales ▪ Reduce ops & manufacturing site costs ▪ Improve customer service Process Efficiency ▪ Maximize ROAS via upgraded mktg. capabilities ▪ Improve sales targeting, practices, & product- customer fit 3 KEY OPERATIONS OBJECTIVES THROUGH 2026 THAT TIE TO NORTH STAR ▪ Automate processes via AI & process redesign ▪ Reach greater manufacturing efficiency
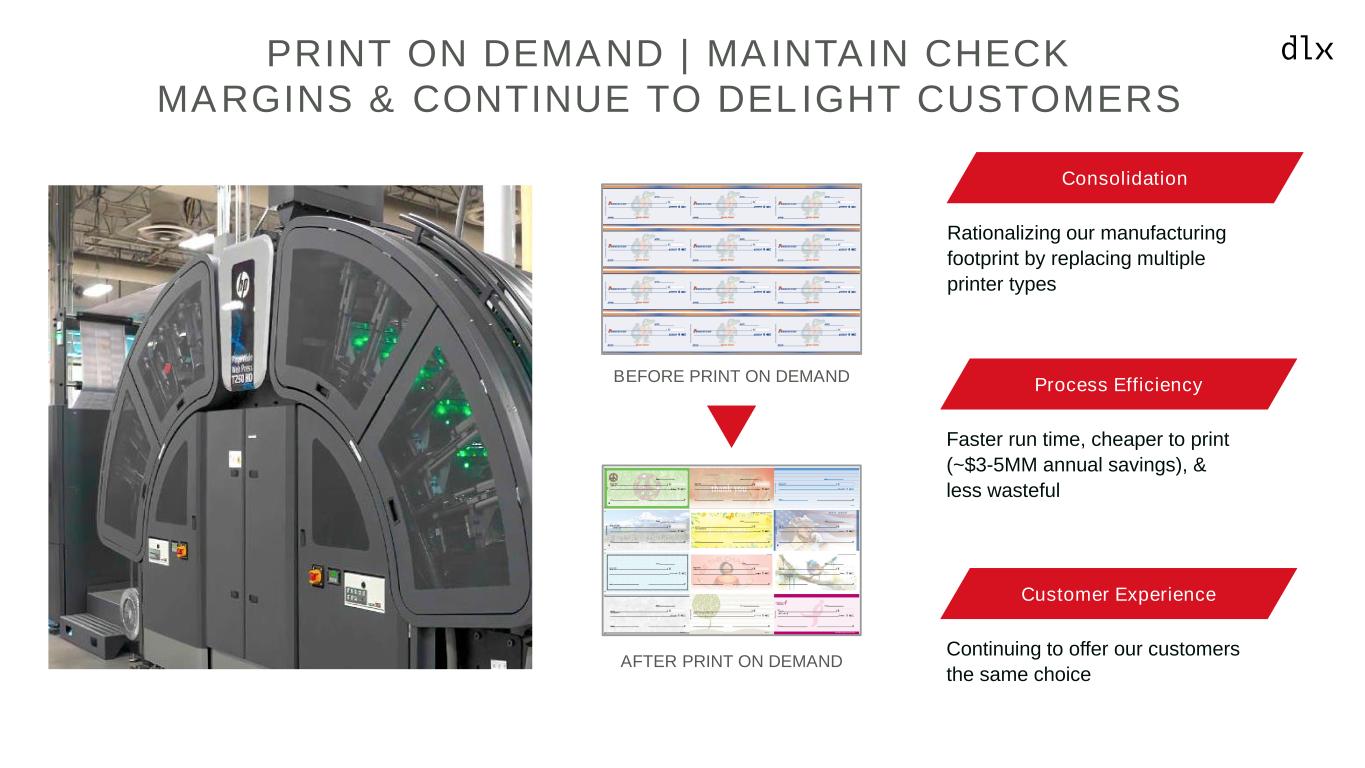
Consolidation Process Efficiency Customer Experience Rationalizing our manufacturing footprint by replacing multiple printer types Faster run time, cheaper to print (~$3-5MM annual savings), & less wasteful Continuing to offer our customers the same choice BEFORE PRINT ON DEMAND AFTER PRINT ON DEMAND PRINT ON DEMAND | MAINTAIN CHECK MARGINS & CONTINUE TO DELIGHT CUSTOMERS

P R O P O S A L OUR MISSION Efficiency first, always in the service of our customers & business partners OUTCOMES Return cash to shareholders & Invest in our Payments & Data businesses OPERATIONS SUPPORT OUR INVESTMENT THESIS

• Prior to Deluxe: • 20 years of leadership at American Express (LoB CIO), Cognizant, GE • CTO Certification from UCal Berkeley • Masters in Computer Applications from Bharathidasan University • BSc in Physics from University of Madras Chief Technology & Digital Officer Yogs Jayaprakasam
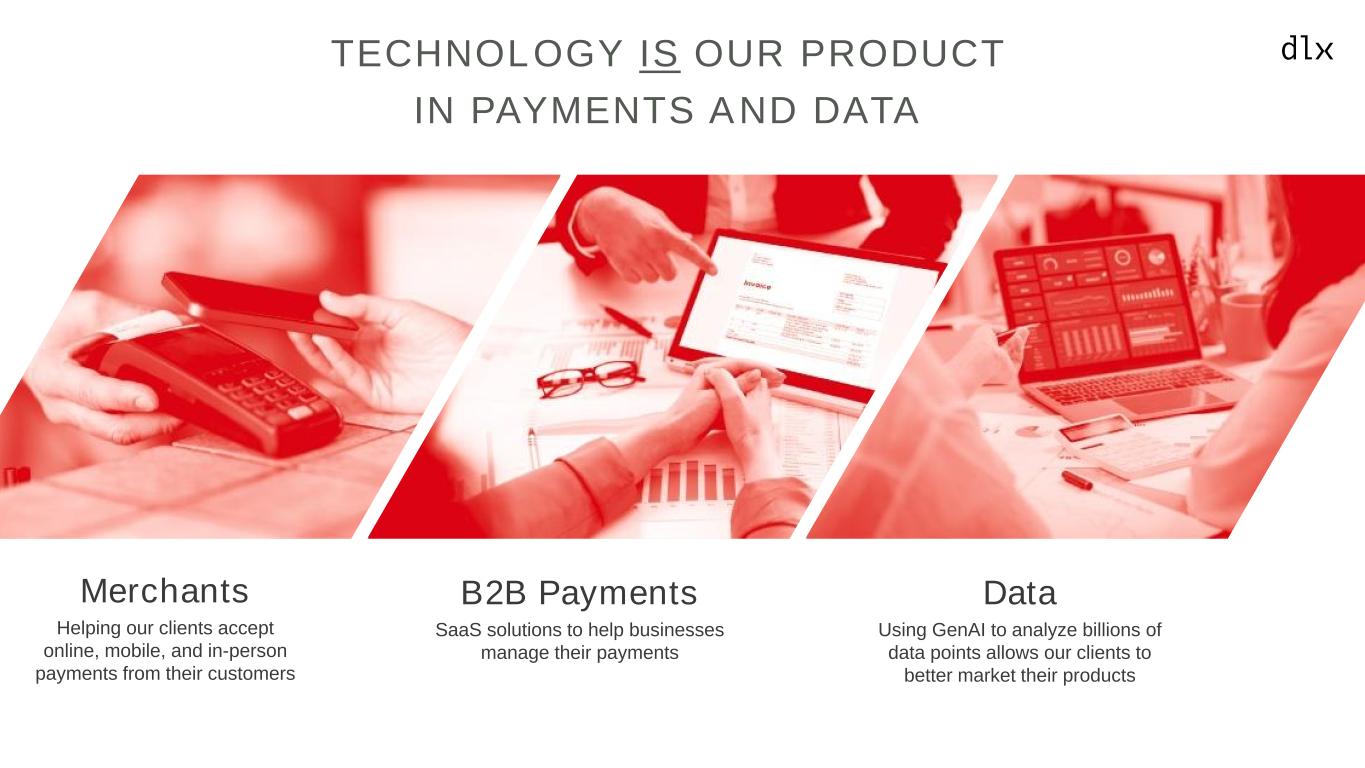
Merchants Helping our clients accept online, mobile, and in-person payments from their customers B2B Payments SaaS solutions to help businesses manage their payments Data Using GenAI to analyze billions of data points allows our clients to better market their products TECHNOLOGY IS OUR PRODUCT IN PAYMENTS AND DATA
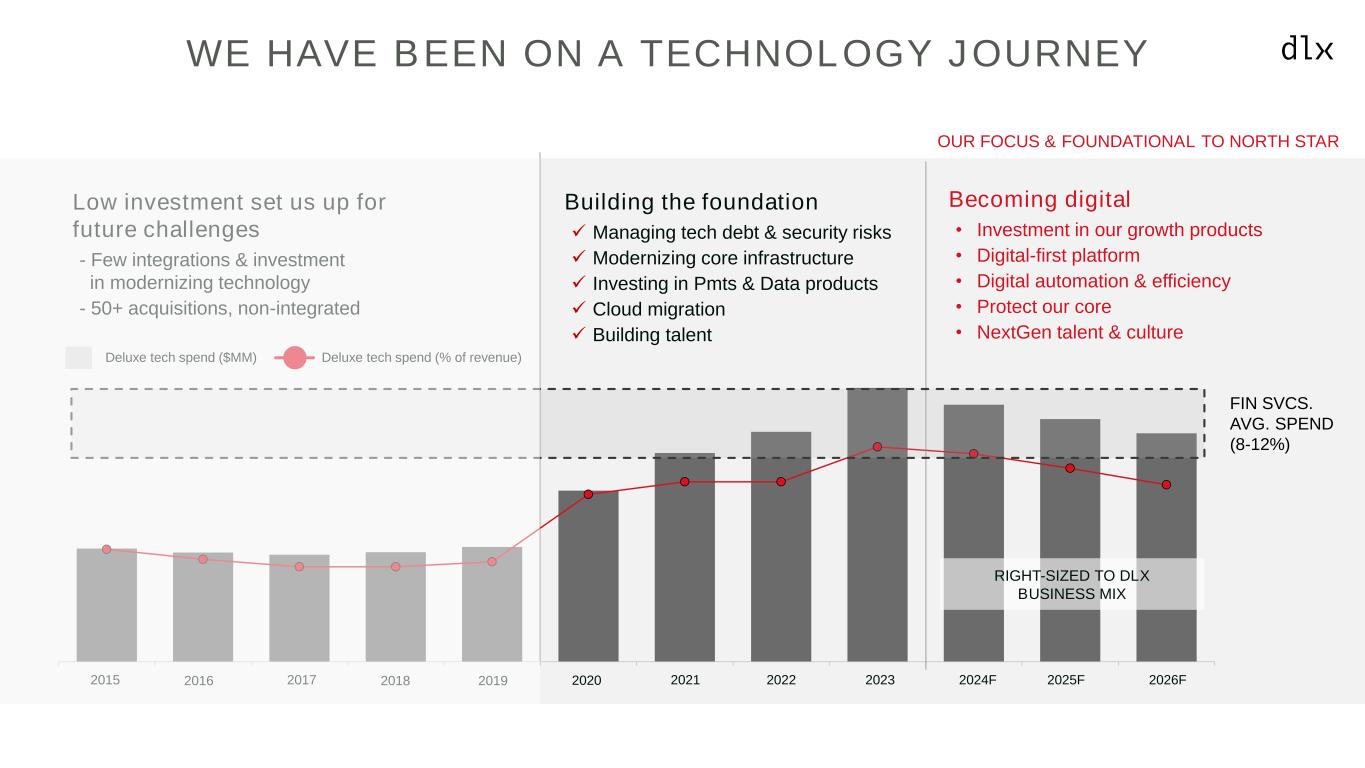
Building the foundation ✓ Managing tech debt & security risks ✓ Modernizing core infrastructure ✓ Investing in Pmts & Data products ✓ Cloud migration ✓ Building talent Deluxe tech spend ($MM) Deluxe tech spend (% of revenue) 2015 2016 2017 2018 2019 2020 2021 2022 2023 2024F 2025F 2026F OUR FOCUS & FOUNDATIONAL TO NORTH STAR FIN SVCS. AVG. SPEND (8-12%) RIGHT-SIZED TO DLX BUSINESS MIX WE HAVE BEEN ON A TECHNOLOGY JOURNEY Becoming digital • Investment in our growth products • Digital-first platform • Digital automation & efficiency • Protect our core • NextGen talent & culture Low investment set us up for future challenges - Few integrations & investment in modernizing technology - 50+ acquisitions, non-integrated
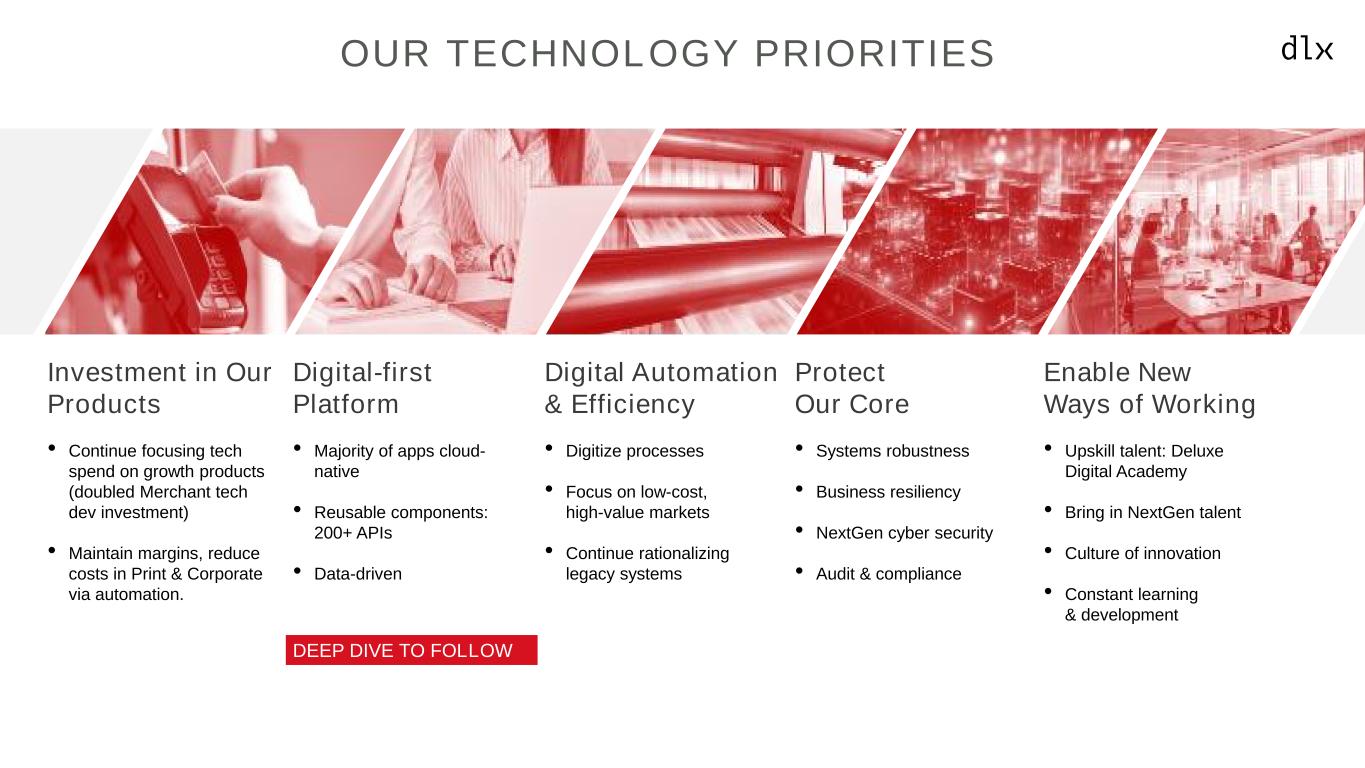
OUR TECHNOLOGY PRIORITIES Investment in Our Products • Continue focusing tech spend on growth products (doubled Merchant tech dev investment) • Maintain margins, reduce costs in Print & Corporate via automation. Digital-first Platform • Majority of apps cloud- native • Reusable components: 200+ APIs • Data-driven Digital Automation & Efficiency • Digitize processes • Focus on low-cost, high-value markets • Continue rationalizing legacy systems Protect Our Core • Systems robustness • Business resiliency • NextGen cyber security • Audit & compliance Enable New Ways of Working • Upskill talent: Deluxe Digital Academy • Bring in NextGen talent • Culture of innovation • Constant learning & development DEEP DIVE TO FOLLOW
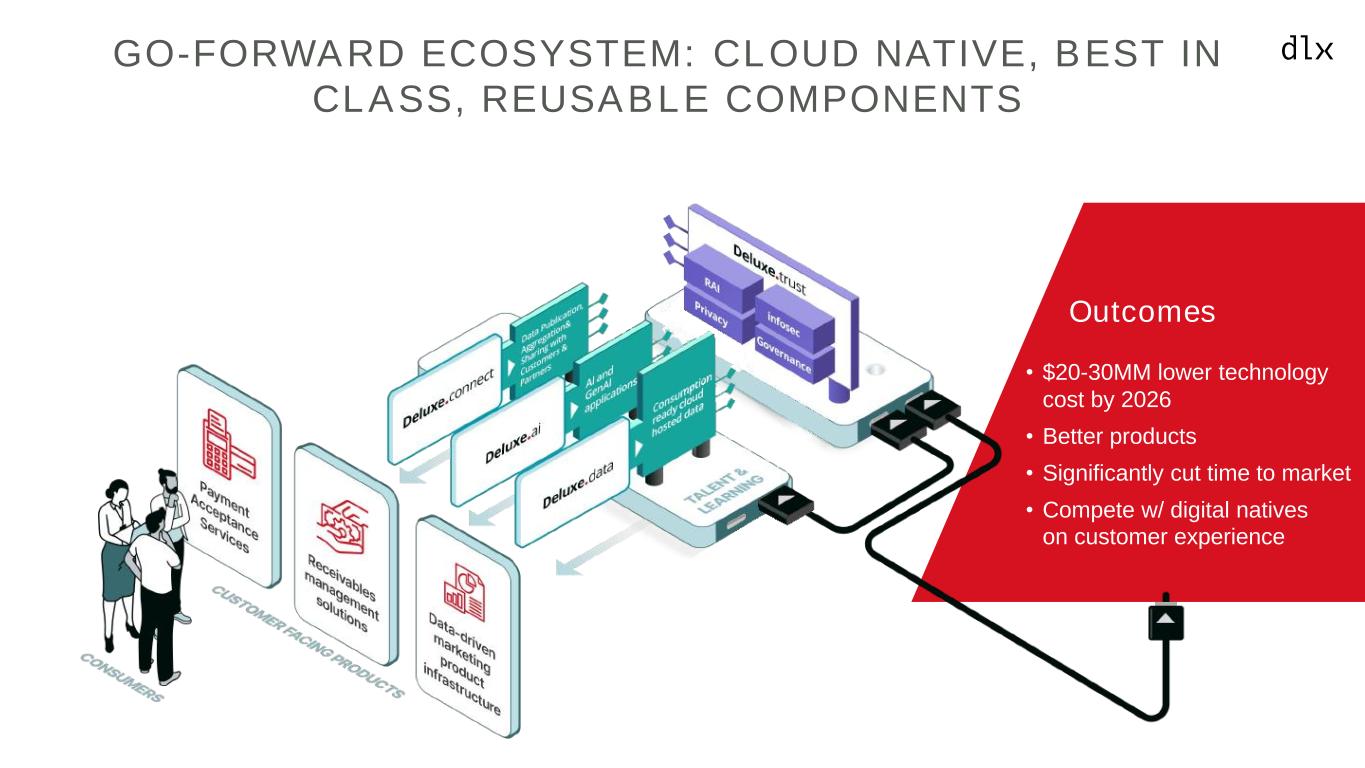
Outcomes • $20-30MM lower technology cost by 2026 • Better products • Significantly cut time to market • Compete w/ digital natives on customer experience GO-FORWARD ECOSYSTEM: CLOUD NATIVE, BEST IN CLASS, REUSABLE COMPONENTS
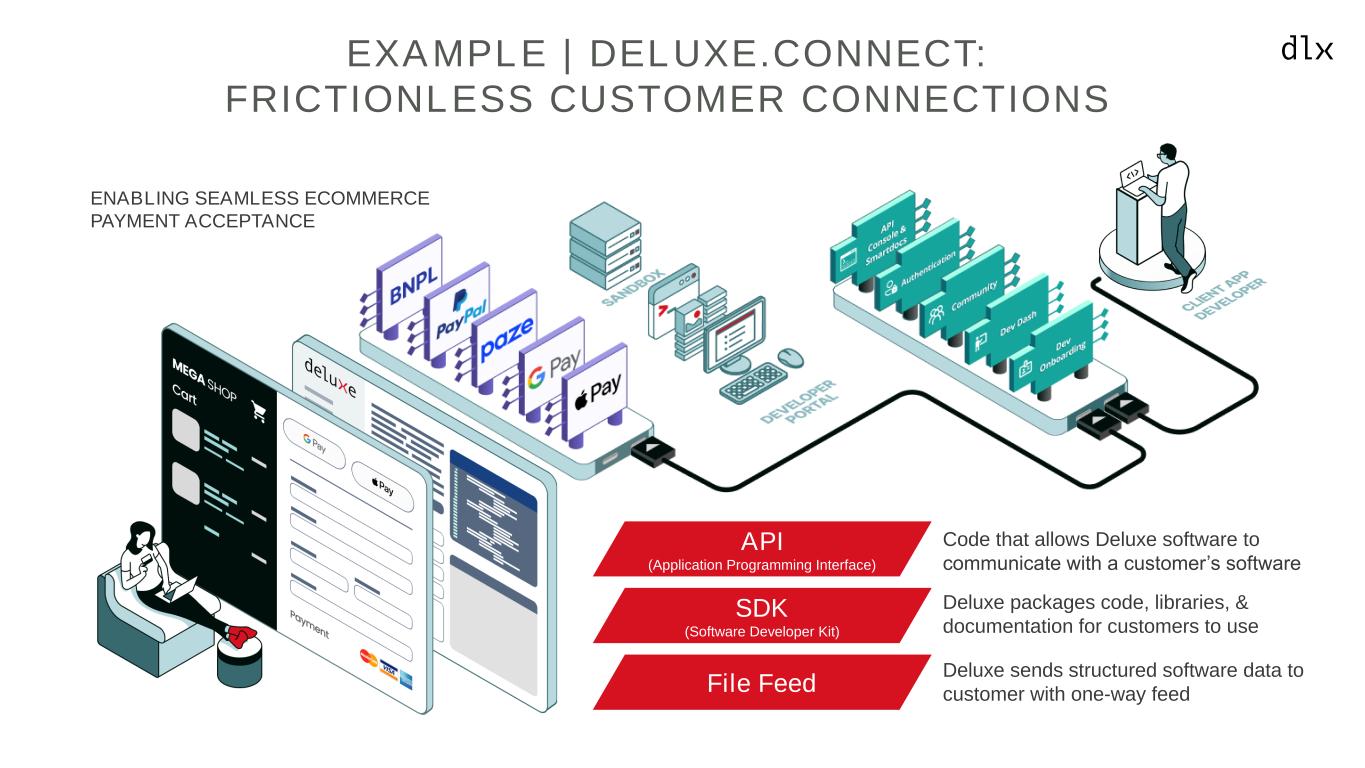
API (Application Programming Interface) SDK (Software Developer Kit) File Feed EXAMPLE | DELUXE.CONNECT: FRICTIONLESS CUSTOMER CONNECTIONS Code that allows Deluxe software to communicate with a customer’s software Deluxe packages code, libraries, & documentation for customers to use Deluxe sends structured software data to customer with one-way feed ENABLING SEAMLESS ECOMMERCE PAYMENT ACCEPTANCE
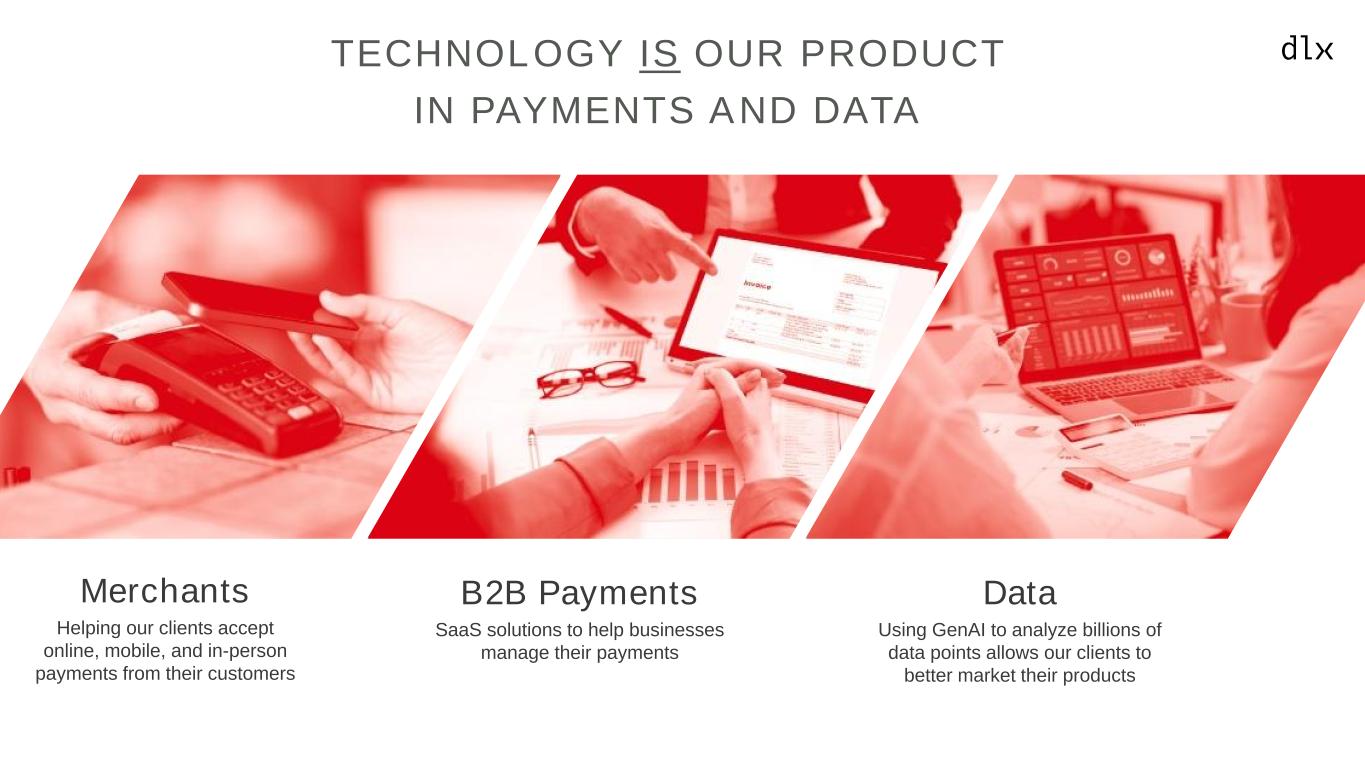
Merchants Helping our clients accept online, mobile, and in-person payments from their customers B2B Payments SaaS solutions to help businesses manage their payments Data Using GenAI to analyze billions of data points allows our clients to better market their products TECHNOLOGY IS OUR PRODUCT IN PAYMENTS AND DATA
AGENDA 1. Introductions & housekeeping Brian Anderson (VP Investor Relations) 2. Our strategy & execution focus via North Star Barry McCarthy (CEO) & Chip Zint (CFO) 3. Our operations & technology transformation Garry Capers Jr. (COO) & Yogs Jayaprakasam (CTDO) 4. Break 5. Line of business strategic updates Merchant | Debra Bradford (President) B2B Payments | Mike Reed (President) Data | Kris Lazzaretti (President) Print: Checks & Promo | Tracey Engelhardt (President) 6. Financial projections Chip Zint (CFO) 7. Closing thoughts & Q&A Barry McCarthy (CEO) 8. Lunch & informal discussion TUESDAY, DECEMBER 5, 2023 8:30AM–12PM 8:30–9:15AM 9:15–9:30AM 9:30–10:15AM 10:15–11AM 11AM–12PM

BREAK
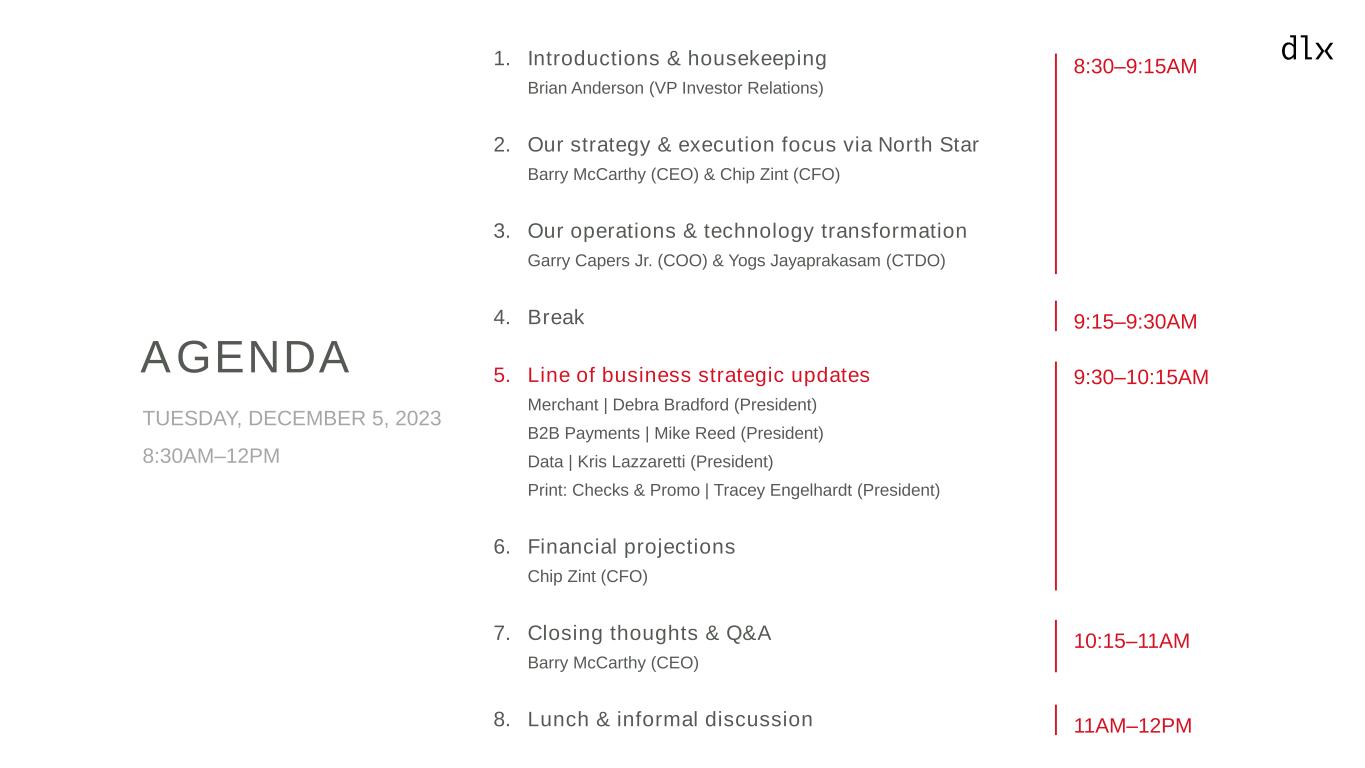
AGENDA 1. Introductions & housekeeping Brian Anderson (VP Investor Relations) 2. Our strategy & execution focus via North Star Barry McCarthy (CEO) & Chip Zint (CFO) 3. Our operations & technology transformation Garry Capers Jr. (COO) & Yogs Jayaprakasam (CTDO) 4. Break 5. Line of business strategic updates Merchant | Debra Bradford (President) B2B Payments | Mike Reed (President) Data | Kris Lazzaretti (President) Print: Checks & Promo | Tracey Engelhardt (President) 6. Financial projections Chip Zint (CFO) 7. Closing thoughts & Q&A Barry McCarthy (CEO) 8. Lunch & informal discussion TUESDAY, DECEMBER 5, 2023 8:30AM–12PM 8:30–9:15AM 9:15–9:30AM 9:30–10:15AM 10:15–11AM 11AM–12PM

MERCHANT SERVICES
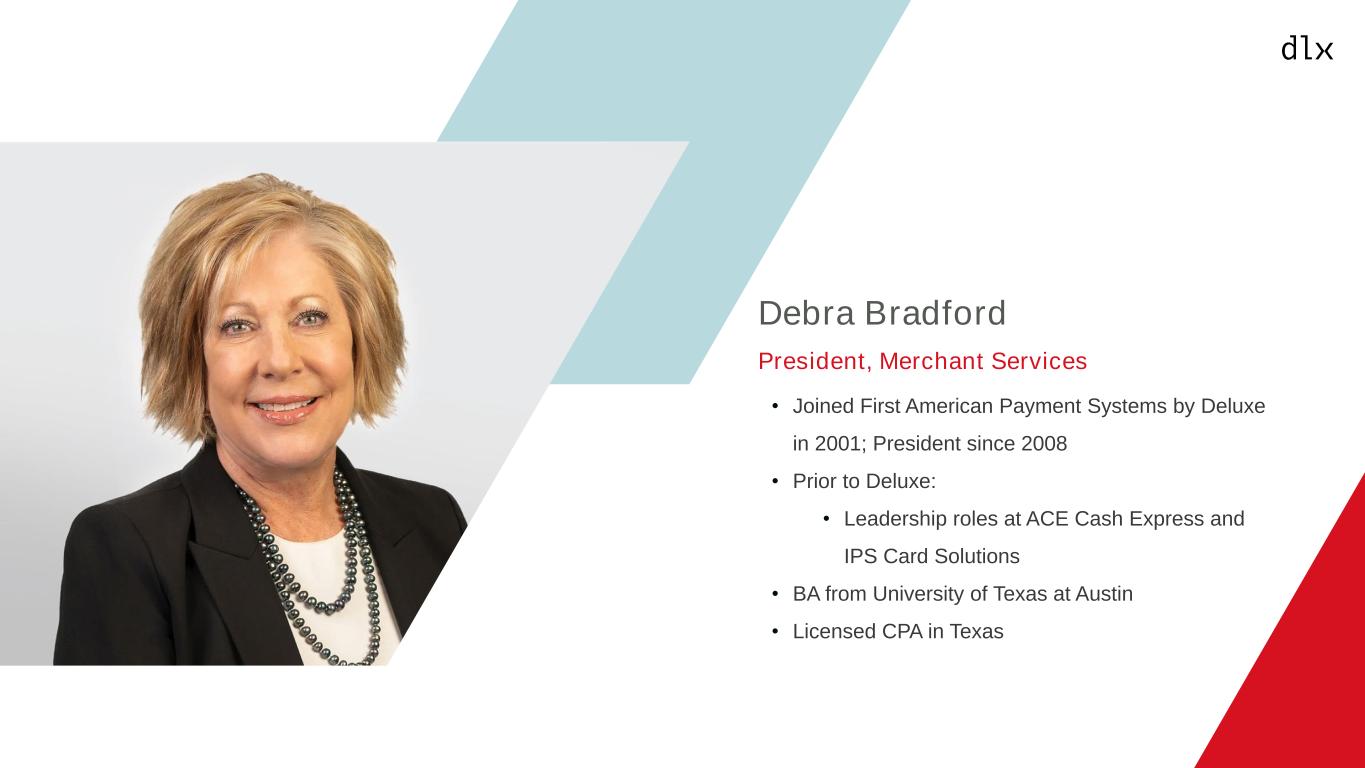
• Joined First American Payment Systems by Deluxe in 2001; President since 2008 • Prior to Deluxe: • Leadership roles at ACE Cash Express and IPS Card Solutions • BA from University of Texas at Austin • Licensed CPA in Texas President, Merchant Services Debra Bradford

WE HELP BUSINESSES & GOVERNMENTS ACCEPT DIGITAL PAYMENTS FROM CONSUMERS Cardholder Buys goods / services Pays 100% Merchant Provides goods / services Receives ~97.50% Acquirer/ Processor Enables pmt. acceptance Receives ~0.40% Network Routes payment among issuing and acquiring banks Receives ~0.15% Issuer Consumer payment method Retains interchange Receives ~1.95% WHERE WE PLAY DEPOSITS FUNDS IN MERCHANT ACCOUNT ROUTES PAYMENT TO ISSUER ENABLES MERCHANT TO ACCEPT PAYMENT 1. Significant dispersion in practice vs. economics shown in illustrative example above (e.g., fees typically higher for smaller merchants, lower for larger merchants) Values illustrative for an ‘average’ transaction
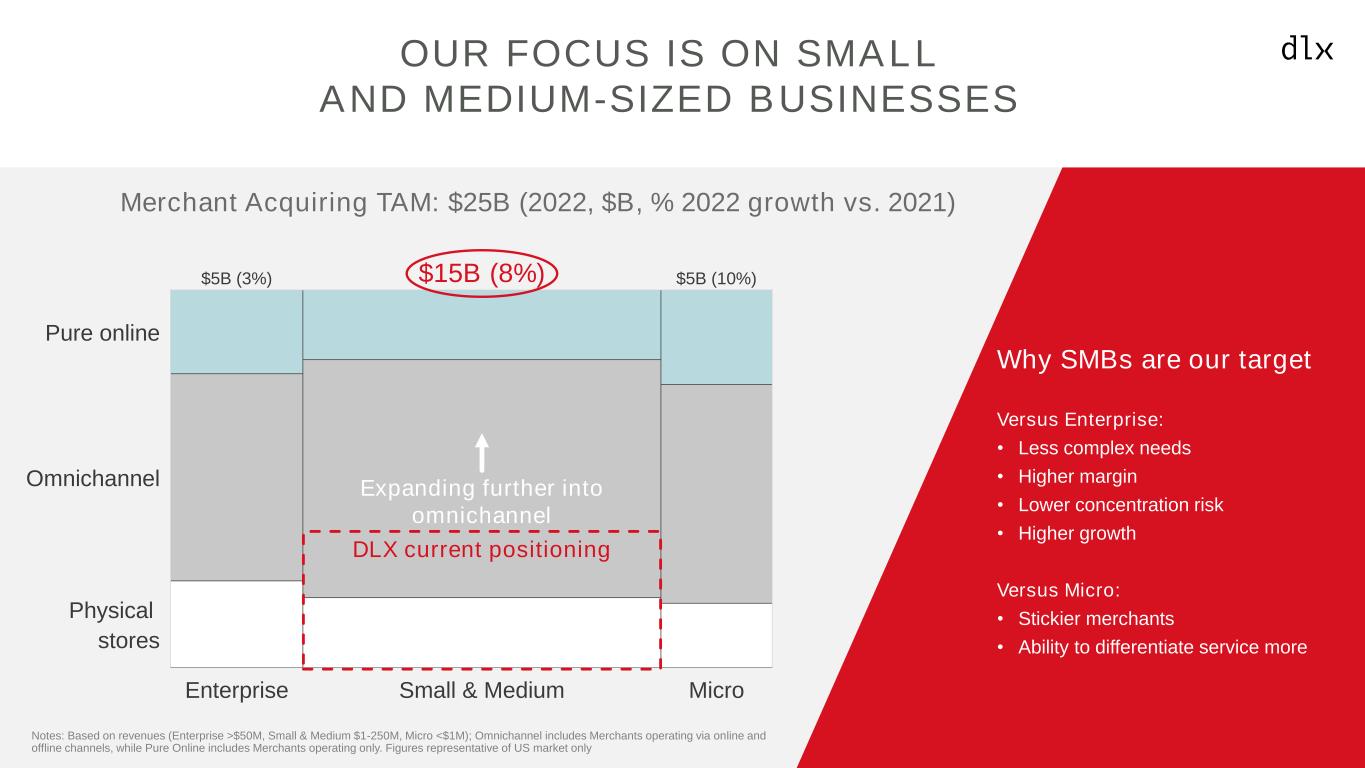
Notes: Based on revenues (Enterprise >$50M, Small & Medium $1-250M, Micro <$1M); Omnichannel includes Merchants operating via online and offline channels, while Pure Online includes Merchants operating only. Figures representative of US market only Merchant Acquiring TAM: $25B (2022, $B, % 2022 growth vs. 2021) OUR FOCUS IS ON SMALL AND MEDIUM-SIZED BUSINESSES Enterprise Small & Medium Micro Pure online Omnichannel Physical stores $5B (10%)$5B (3%) Expanding further into omnichannel Why SMBs are our target Versus Enterprise: • Less complex needs • Higher margin • Lower concentration risk • Higher growth Versus Micro: • Stickier merchants • Ability to differentiate service more $15B (8%) DLX current positioning
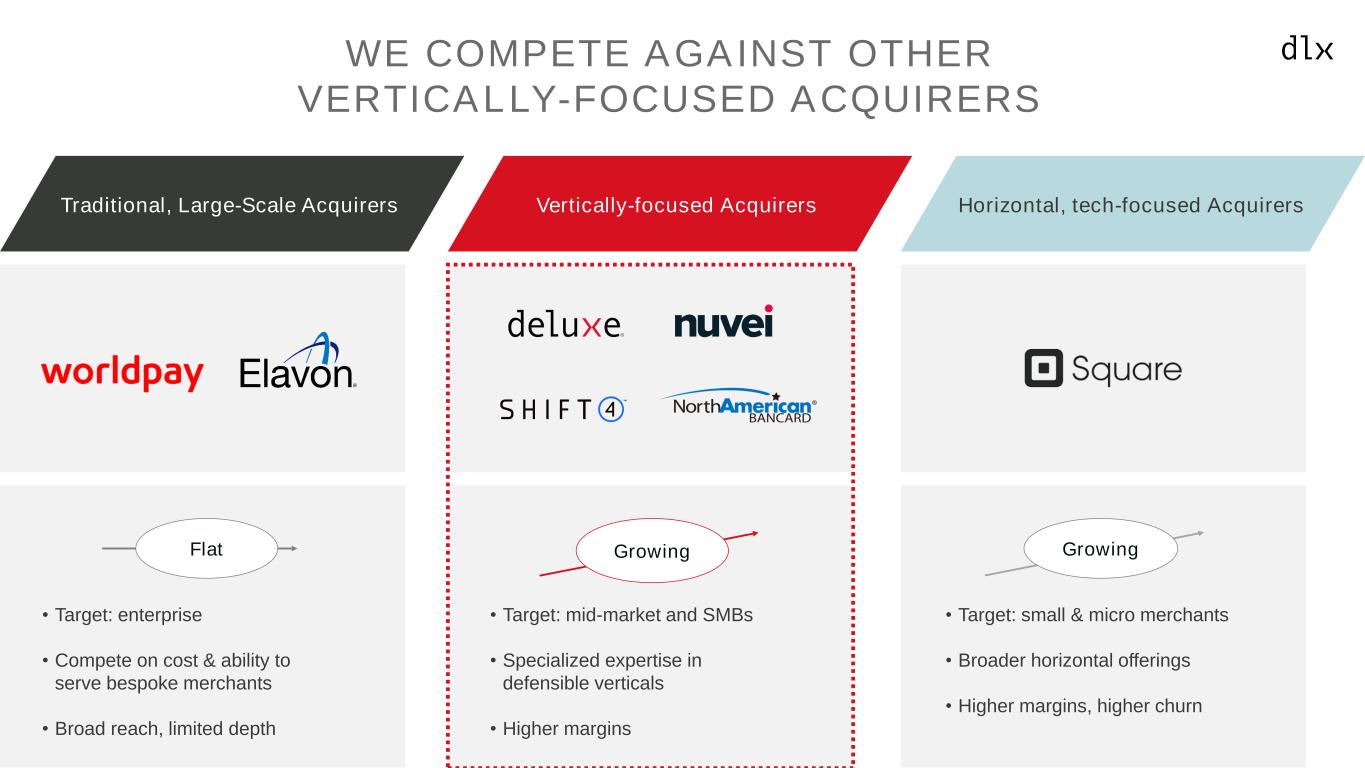
WE COMPETE AGAINST OTHER VERTICALLY-FOCUSED ACQUIRERS Vertically-focused Acquirers • Target: mid-market and SMBs • Specialized expertise in defensible verticals • Higher margins Growing Traditional, Large-Scale Acquirers • Target: enterprise • Compete on cost & ability to serve bespoke merchants • Broad reach, limited depth Flat Horizontal, tech-focused Acquirers • Target: small & micro merchants • Broader horizontal offerings • Higher margins, higher churn Growing
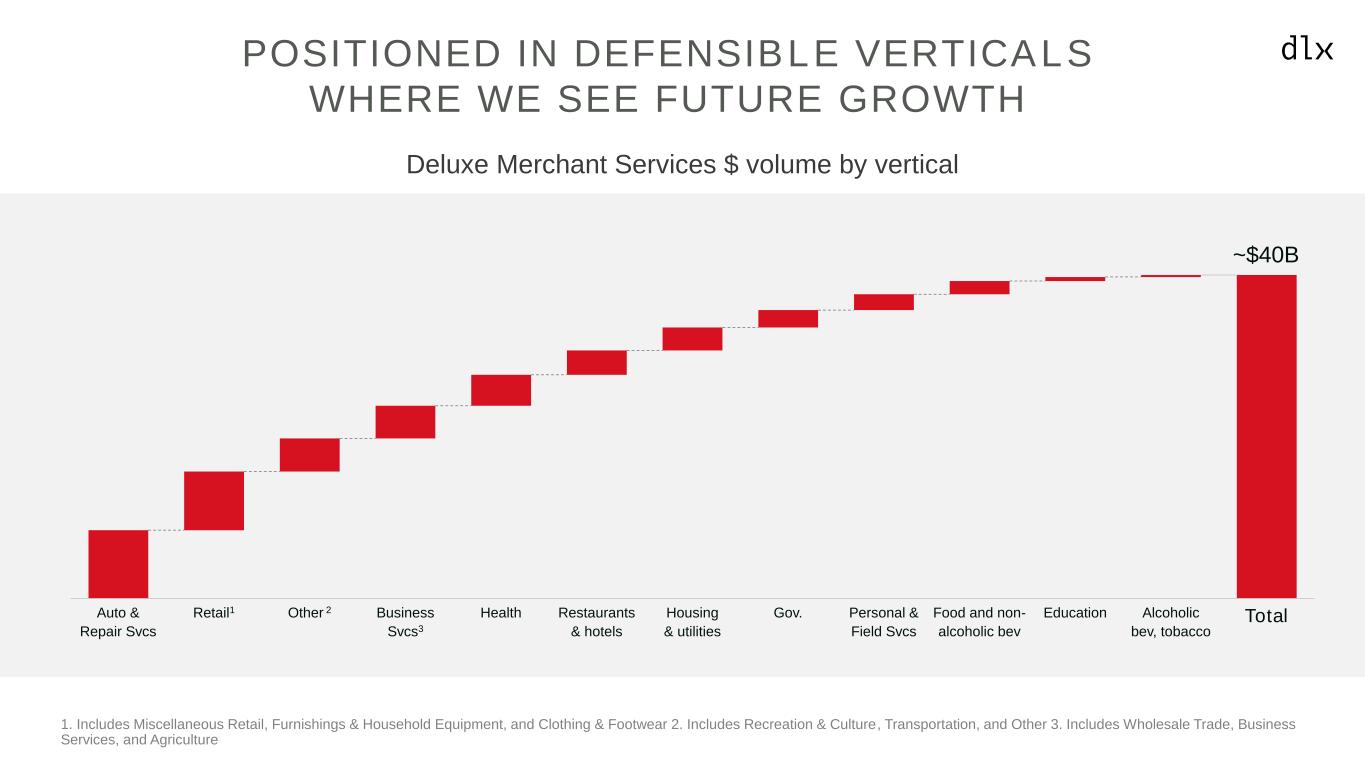
POSITIONED IN DEFENSIBLE VERTICALS WHERE WE SEE FUTURE GROWTH Auto & Repair Svcs Retail1 Other 2 Business Svcs3 Health Restaurants & hotels Housing & utilities Gov. Personal & Field Svcs Food and non- alcoholic bev Education Alcoholic bev, tobacco Total ~$40B Deluxe Merchant Services $ volume by vertical 1. Includes Miscellaneous Retail, Furnishings & Household Equipment, and Clothing & Footwear 2. Includes Recreation & Culture, Transportation, and Other 3. Includes Wholesale Trade, Business Services, and Agriculture
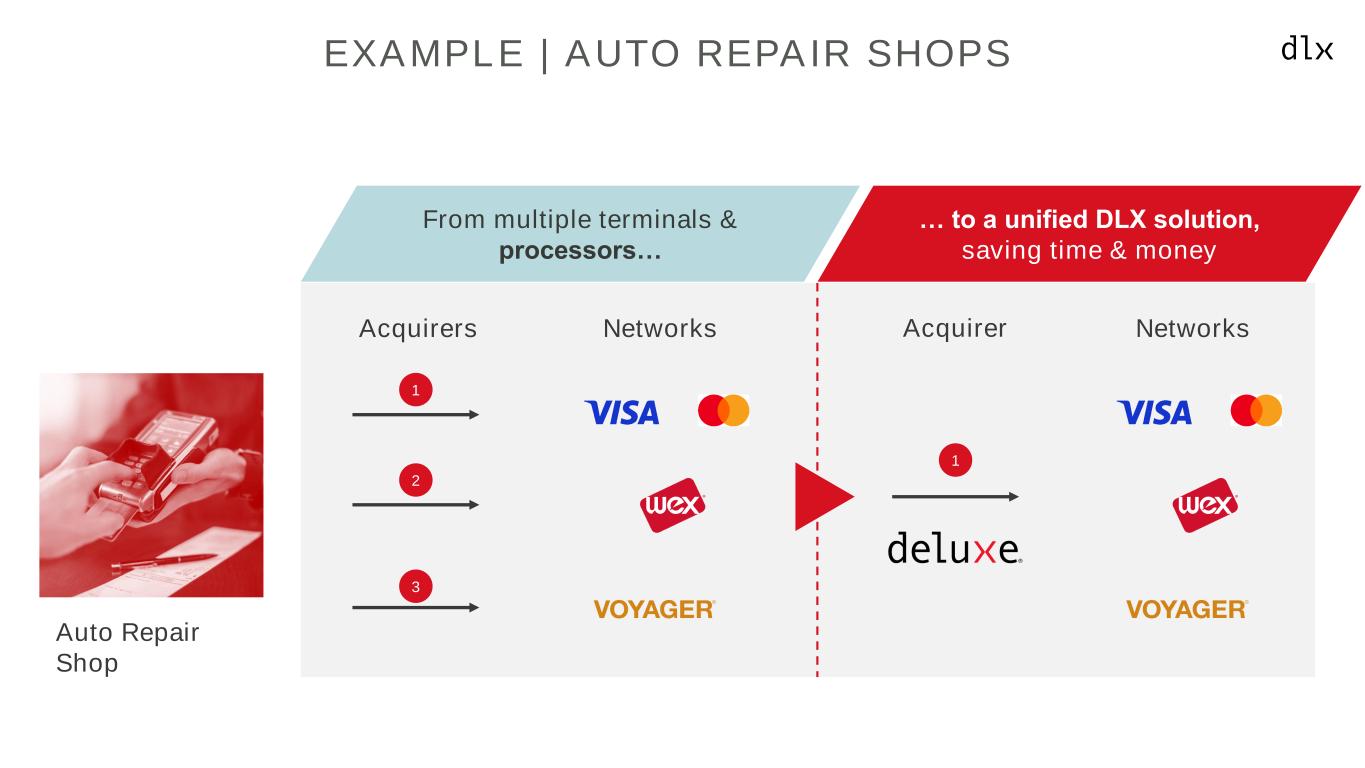
Auto Repair Shop NetworksAcquirers 1 2 3 Acquirer 1 … to a unified DLX solution, saving time & money Networks EXAMPLE | AUTO REPAIR SHOPS From multiple terminals & processors…
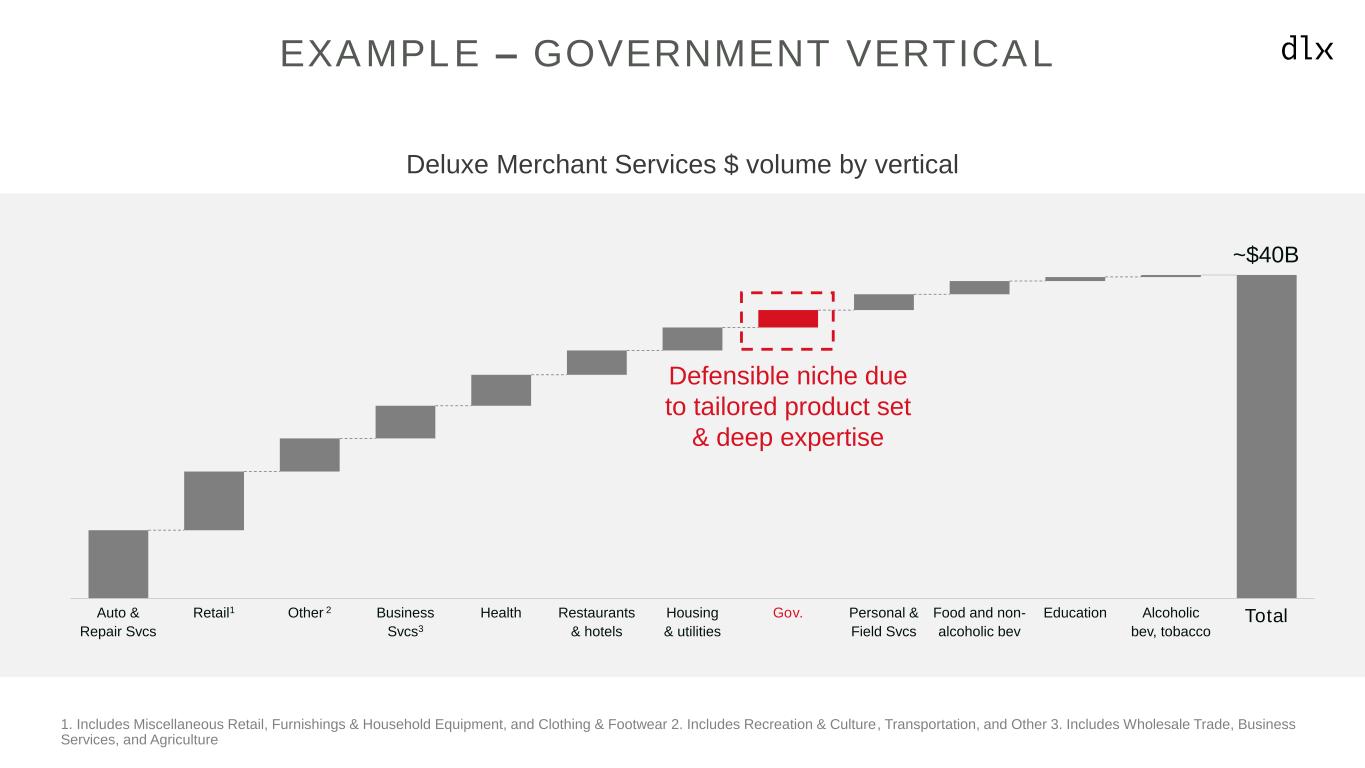
EXAMPLE – GOVERNMENT VERTICAL Auto & Repair Svcs Retail1 Other 2 Business Svcs3 Health Restaurants & hotels Housing & utilities Gov. Personal & Field Svcs Food and non- alcoholic bev Education Alcoholic bev, tobacco Total ~$40B Deluxe Merchant Services $ volume by vertical 1. Includes Miscellaneous Retail, Furnishings & Household Equipment, and Clothing & Footwear 2. Includes Recreation & Culture, Transportation, and Other 3. Includes Wholesale Trade, Business Services, and Agriculture Defensible niche due to tailored product set & deep expertise
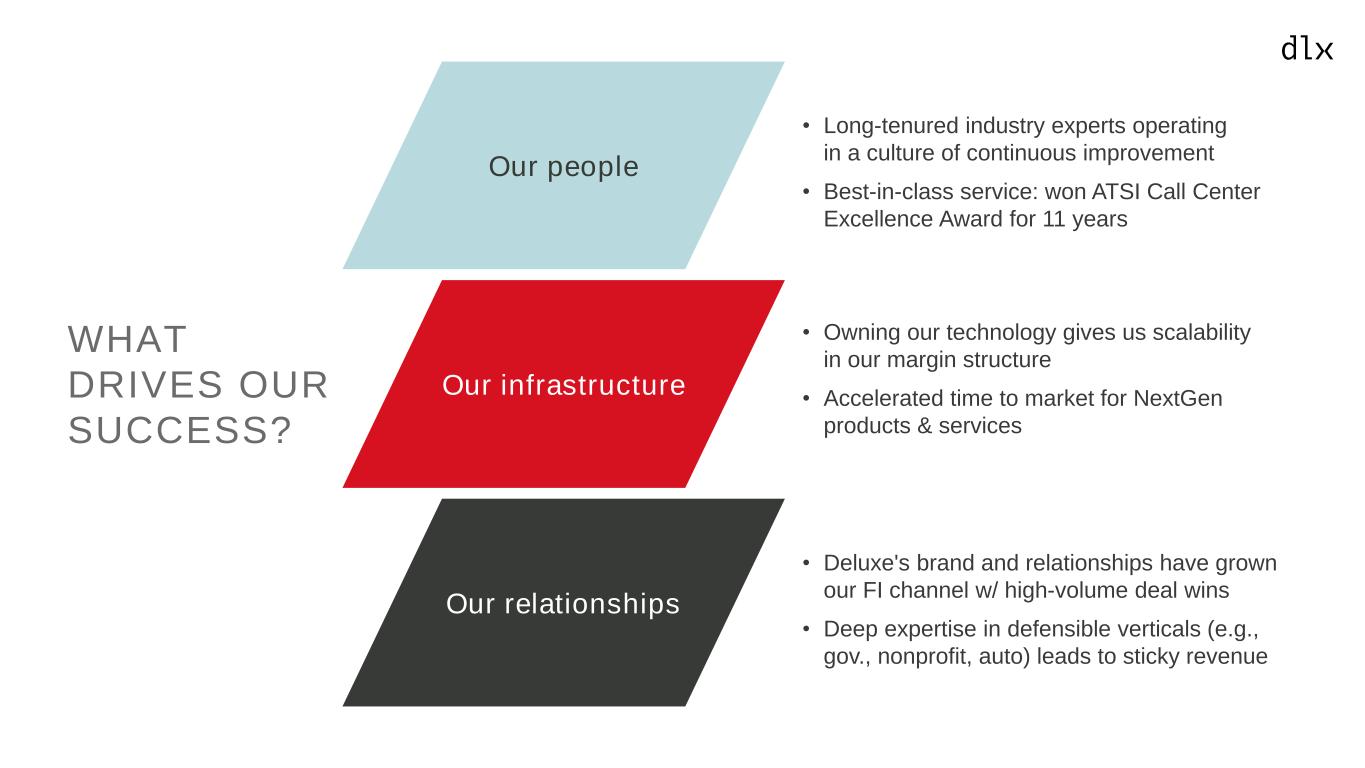
WHAT DRIVES OUR SUCCESS? • Long-tenured industry experts operating in a culture of continuous improvement • Best-in-class service: won ATSI Call Center Excellence Award for 11 years Our people Our infrastructure Our relationships • Owning our technology gives us scalability in our margin structure • Accelerated time to market for NextGen products & services • Deluxe's brand and relationships have grown our FI channel w/ high-volume deal wins • Deep expertise in defensible verticals (e.g., gov., nonprofit, auto) leads to sticky revenue
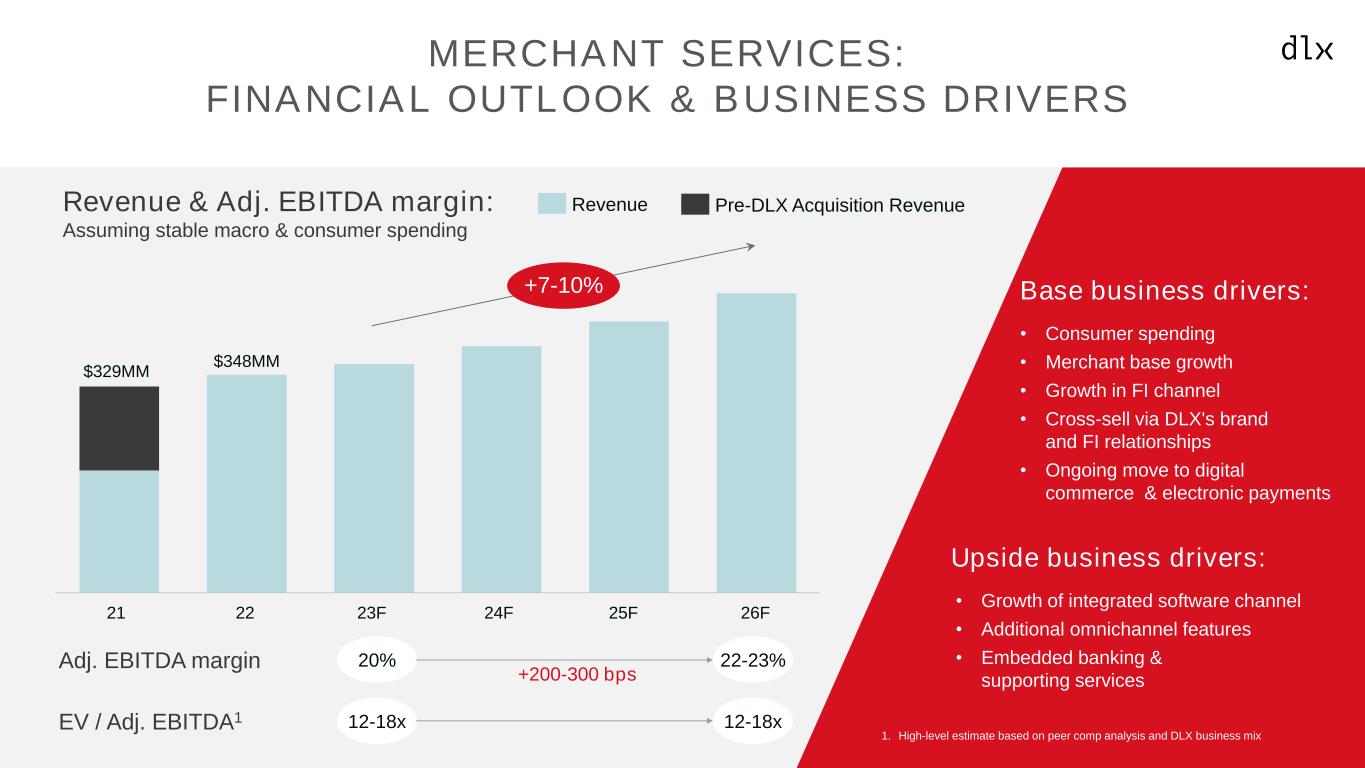
Base business drivers: • Consumer spending • Merchant base growth • Growth in FI channel • Cross-sell via DLX's brand and FI relationships • Ongoing move to digital commerce & electronic payments Upside business drivers: • Growth of integrated software channel • Additional omnichannel features • Embedded banking & supporting services MERCHANT SERVICES: FINANCIAL OUTLOOK & BUSINESS DRIVERS $348MM 21 22 23F 24F 25F 26F $329MM +7-10% Revenue & Adj. EBITDA margin: Assuming stable macro & consumer spending Adj. EBITDA margin 20% 22-23% Revenue Pre-DLX Acquisition Revenue EV / Adj. EBITDA1 12-18x 12-18x +200-300 bps 1. High-level estimate based on peer comp analysis and DLX business mix

B2B PAYMENTS
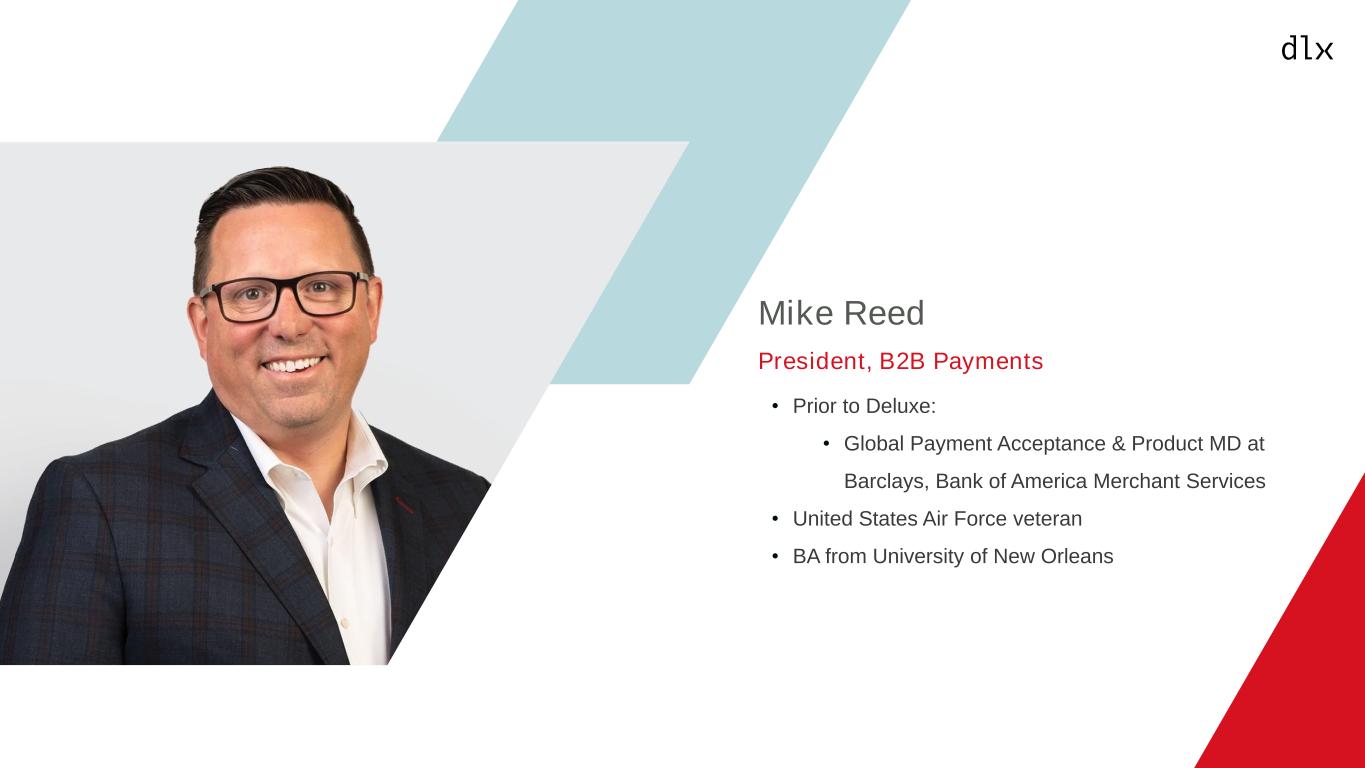
• Prior to Deluxe: • Global Payment Acceptance & Product MD at Barclays, Bank of America Merchant Services • United States Air Force veteran • BA from University of New Orleans President, B2B Payments Mike Reed
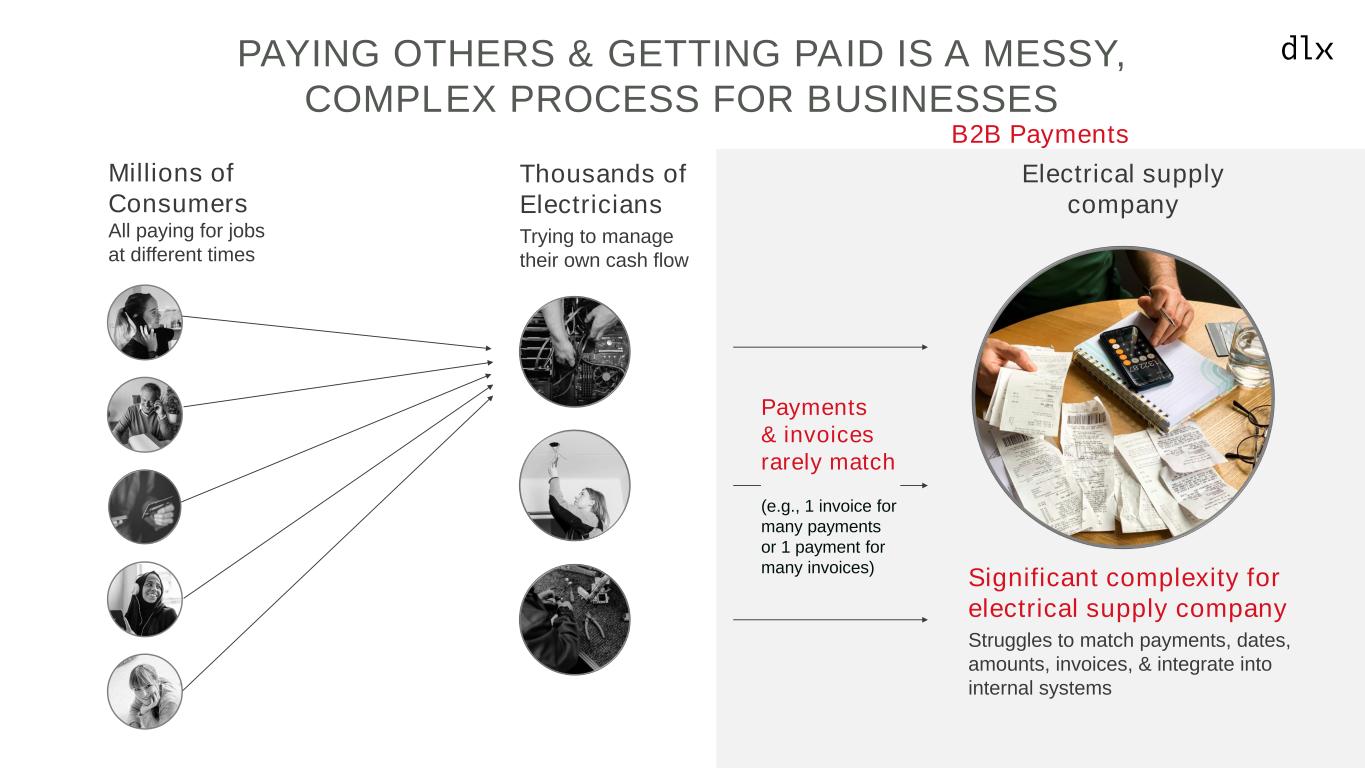
PAYING OTHERS & GETTING PAID IS A MESSY, COMPLEX PROCESS FOR BUSINESSES Thousands of Electricians Trying to manage their own cash flow Millions of Consumers All paying for jobs at different times Significant complexity for electrical supply company Struggles to match payments, dates, amounts, invoices, & integrate into internal systems Payments & invoices rarely match (e.g., 1 invoice for many payments or 1 payment for many invoices) B2B Payments Electrical supply company
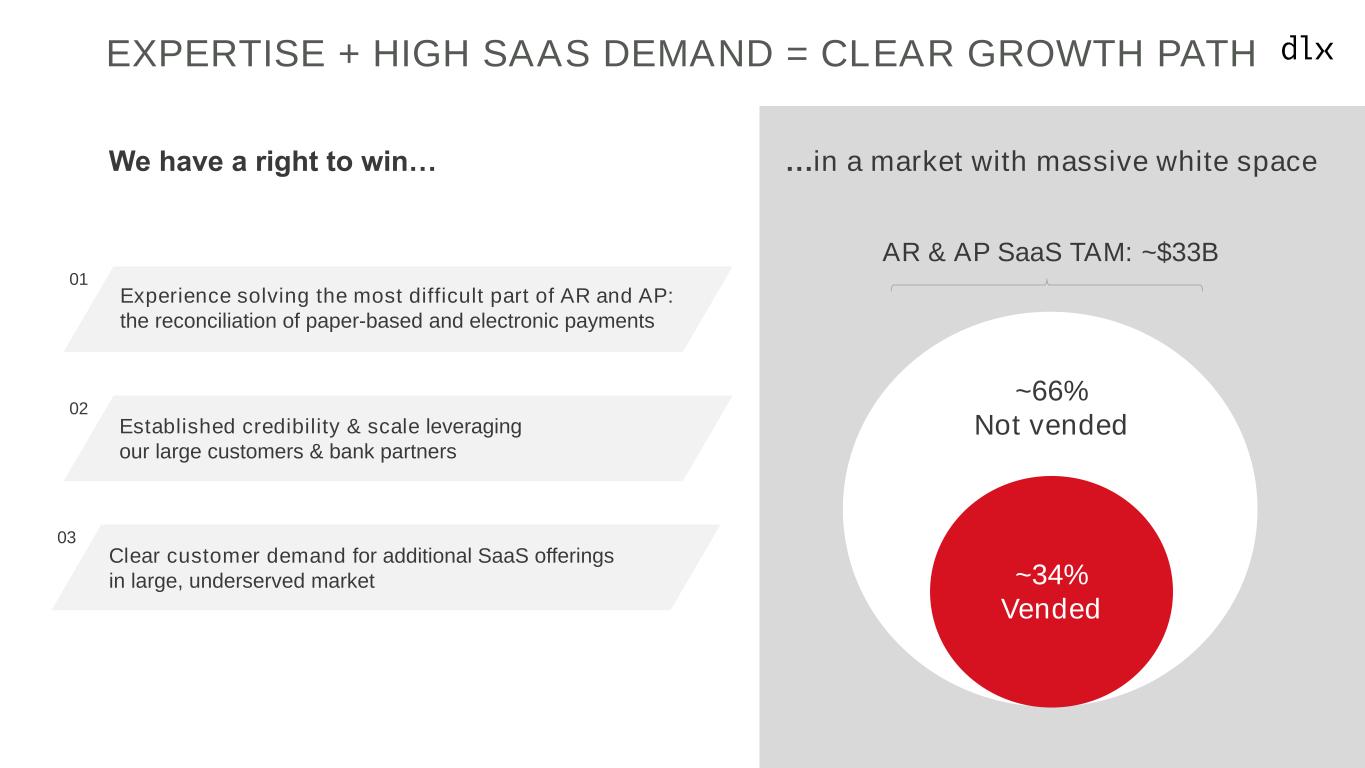
…in a market with massive white space AR & AP SaaS TAM: ~$33B ~66% Not vended ~34% Vended 01 02 03 Experience solving the most difficult part of AR and AP: the reconciliation of paper-based and electronic payments Established credibility & scale leveraging our large customers & bank partners Clear customer demand for additional SaaS offerings in large, underserved market We have a right to win… EXPERTISE + HIGH SAAS DEMAND = CLEAR GROWTH PATH
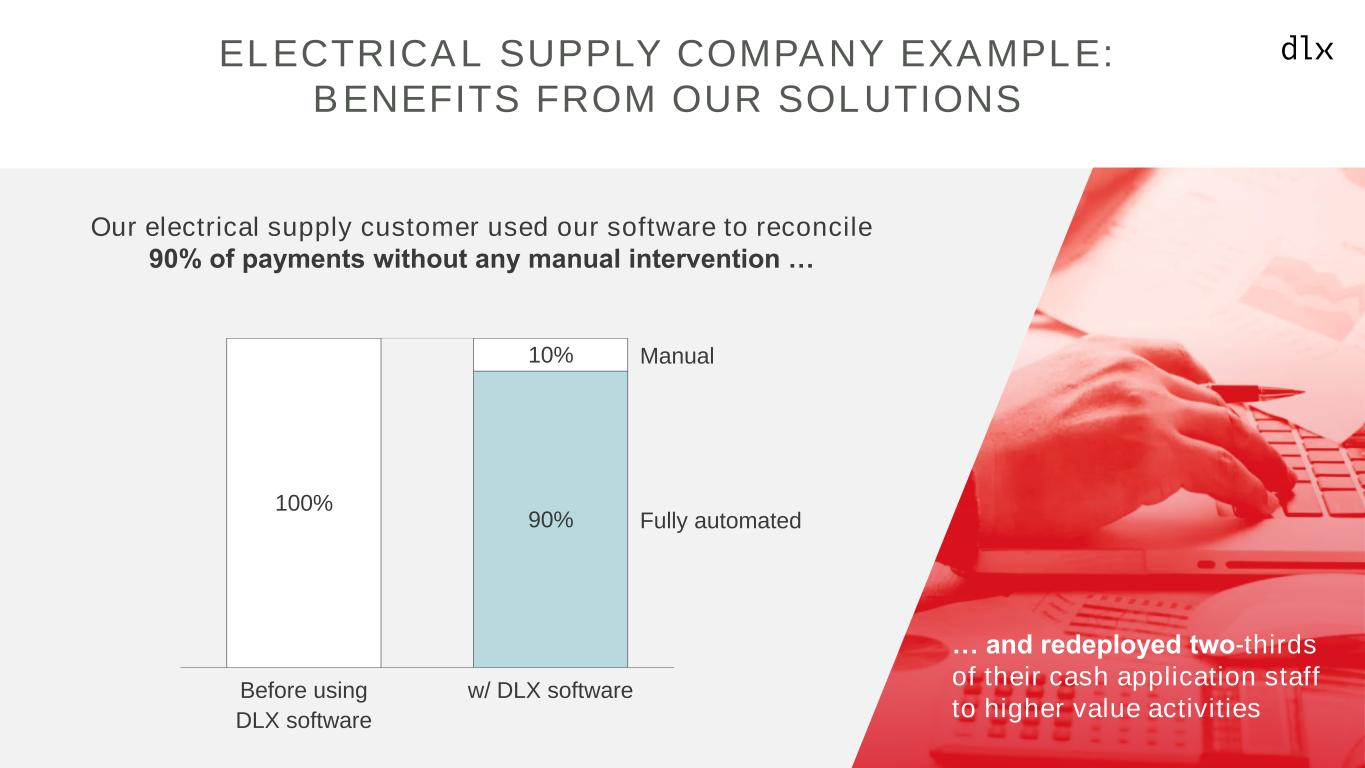
ELECTRICAL SUPPLY COMPANY EXAMPLE: BENEFITS FROM OUR SOLUTIONS 100% 90% 10% Before using DLX software w/ DLX software Manual Fully automated Our electrical supply customer used our software to reconcile 90% of payments without any manual intervention … … and redeployed two-thirds of their cash application staff to higher value activities
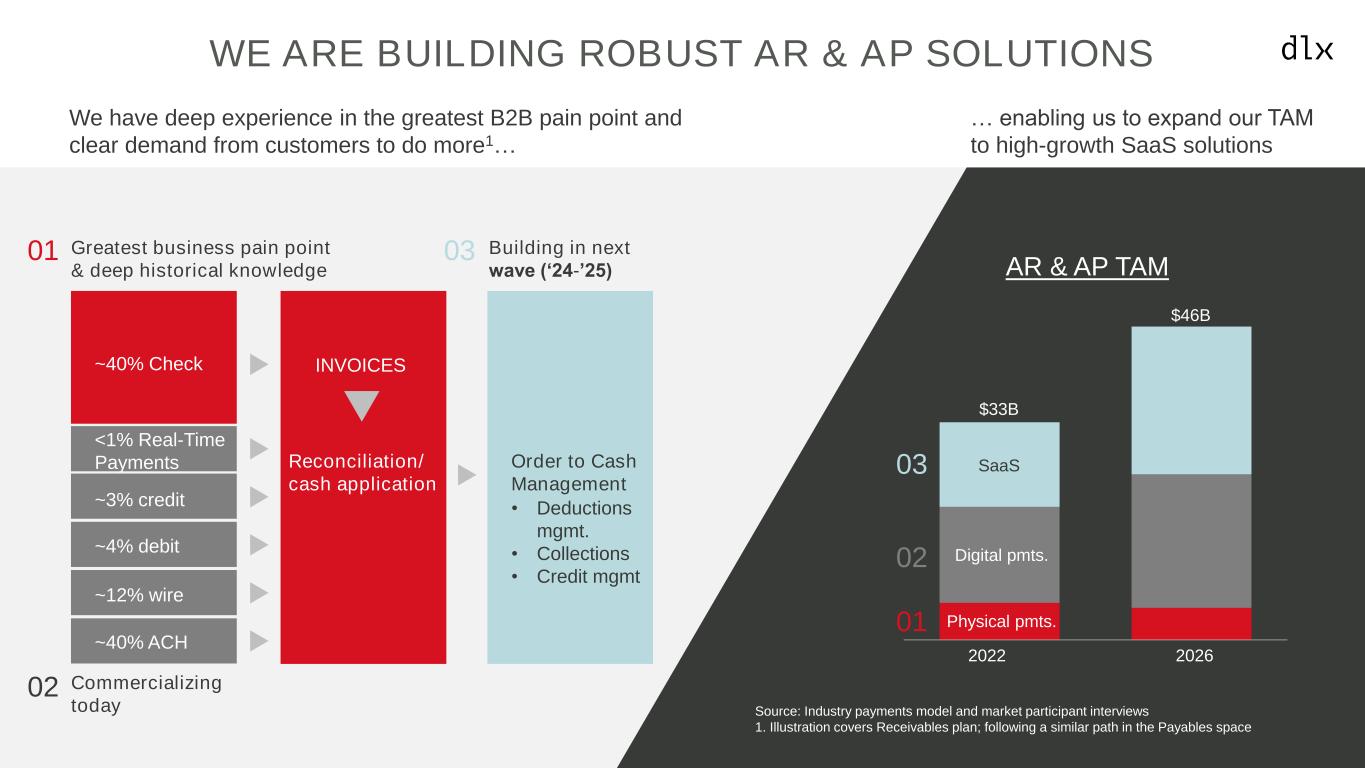
Greatest business pain point & deep historical knowledge 01 Commercializing today 02 Building in next wave (‘24-’25) 03 ~40% Check Reconciliation/ cash application Order to Cash Management • Deductions mgmt. • Collections • Credit mgmt INVOICES … enabling us to expand our TAM to high-growth SaaS solutions We have deep experience in the greatest B2B pain point and clear demand from customers to do more1… AR & AP TAM Physical pmts. Digital pmts. SaaS 2022 2026 $33B $46B 01 02 03 WE ARE BUILDING ROBUST AR & AP SOLUTIONS Source: Industry payments model and market participant interviews 1. Illustration covers Receivables plan; following a similar path in the Payables space <1% Real-Time Payments ~3% credit ~4% debit ~12% wire ~40% ACH
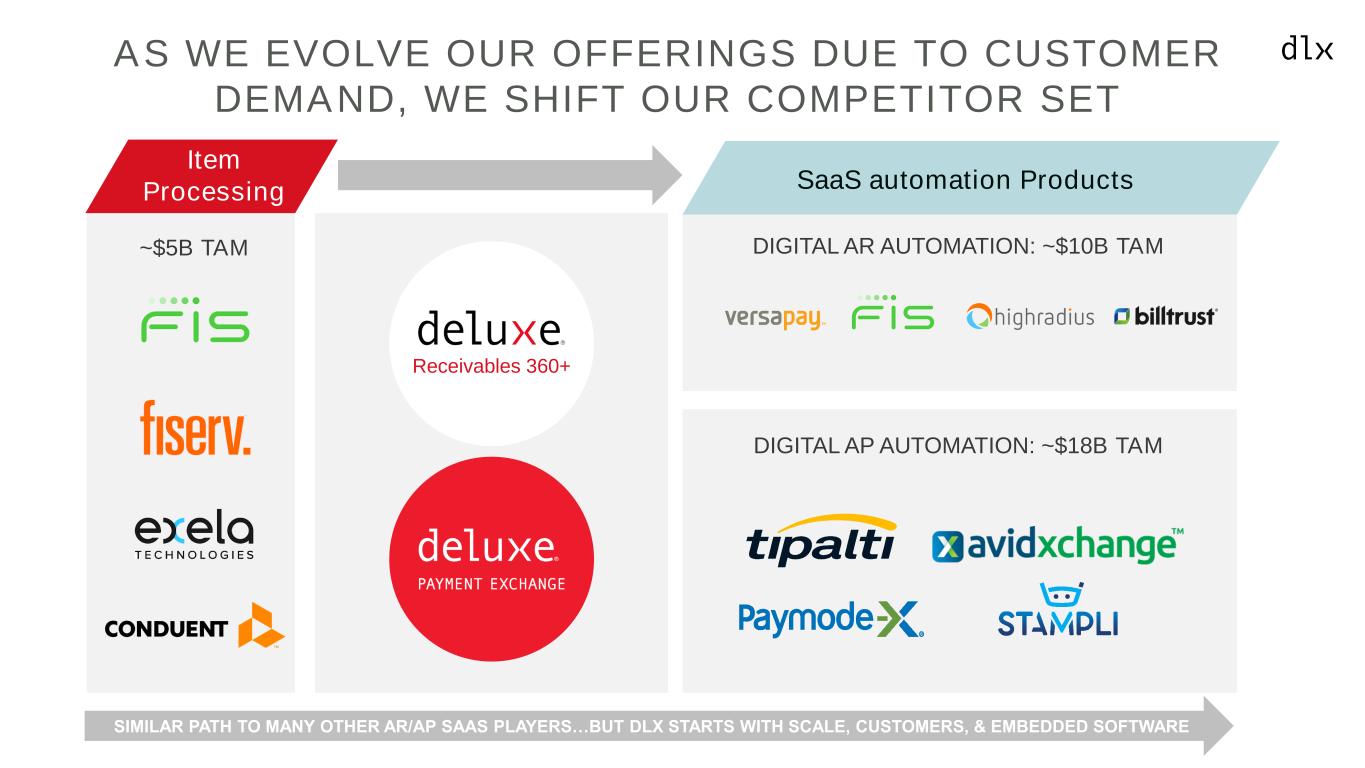
SaaS automation Products AS WE EVOLVE OUR OFFERINGS DUE TO CUSTOMER DEMAND, WE SHIFT OUR COMPETITOR SET Item Processing Receivables 360+ ~$5B TAM DIGITAL AR AUTOMATION: ~$10B TAM DIGITAL AP AUTOMATION: ~$18B TAM SIMILAR PATH TO MANY OTHER AR/AP SAAS PLAYERS…BUT DLX STARTS WITH SCALE, CUSTOMERS, & EMBEDDED SOFTWARE
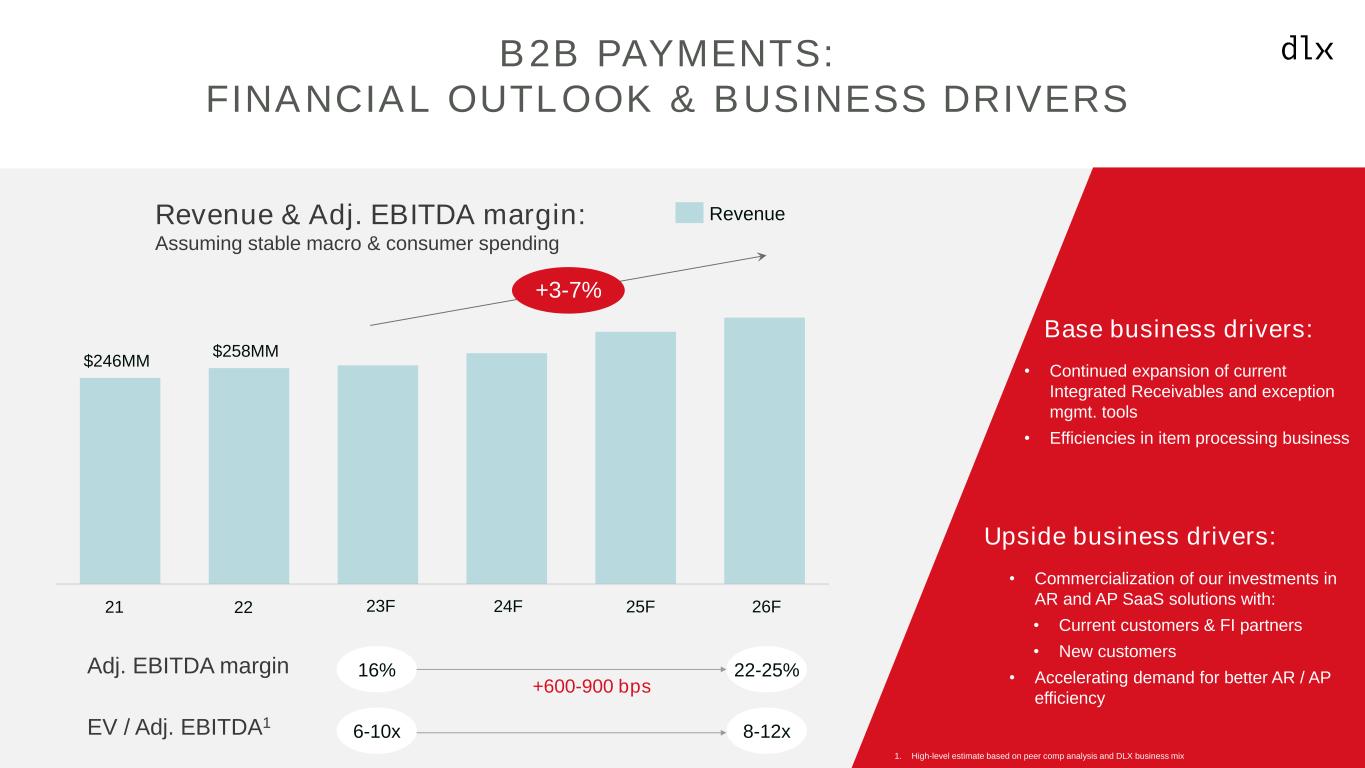
Revenue & Adj. EBITDA margin: Assuming stable macro & consumer spending Revenue 21 22 23F 24F 25F 26F $258MM Adj. EBITDA margin 16% 22-25% EV / Adj. EBITDA1 6-10x 8-12x +600-900 bps +3-7% B2B PAYMENTS: FINANCIAL OUTLOOK & BUSINESS DRIVERS Base business drivers: • Continued expansion of current Integrated Receivables and exception mgmt. tools • Efficiencies in item processing business Upside business drivers: • Commercialization of our investments in AR and AP SaaS solutions with: • Current customers & FI partners • New customers • Accelerating demand for better AR / AP efficiency 1. High-level estimate based on peer comp analysis and DLX business mix $246MM
DATA
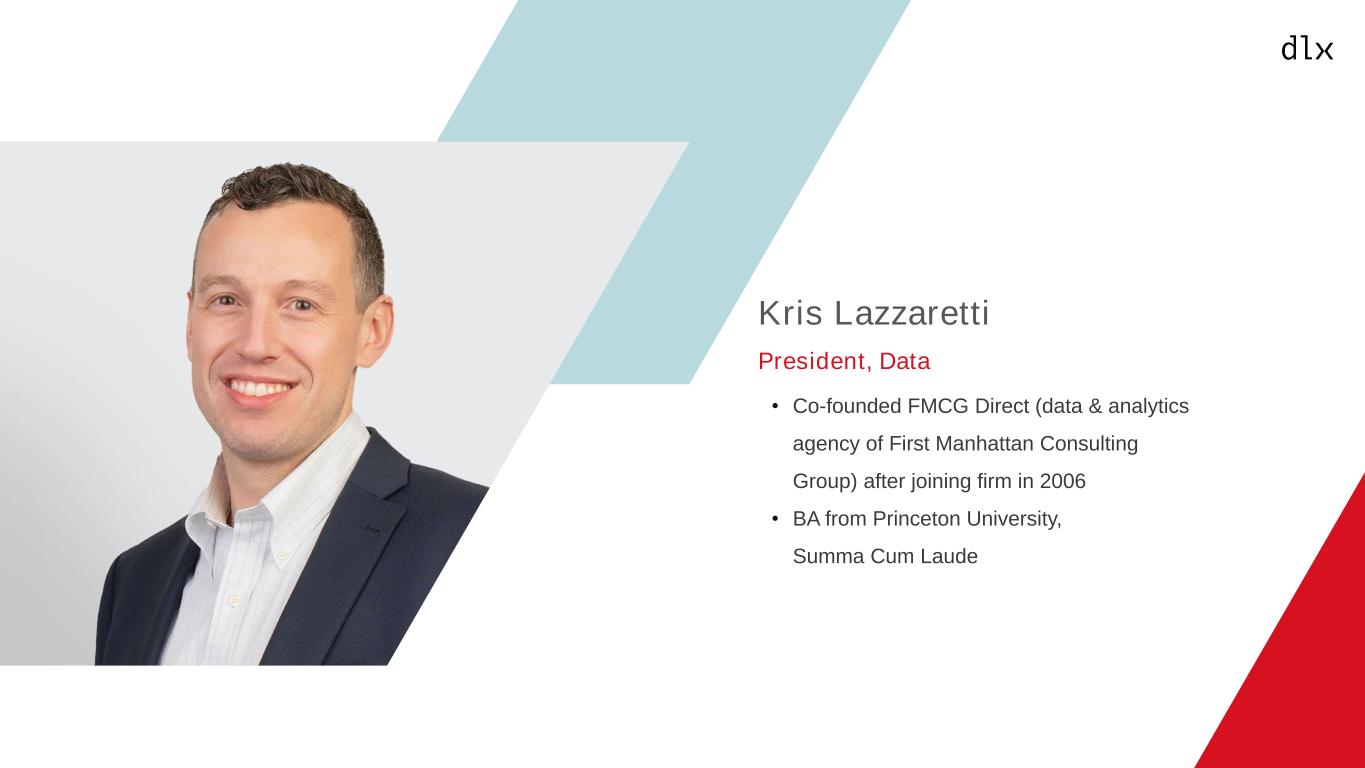
• Co-founded FMCG Direct (data & analytics agency of First Manhattan Consulting Group) after joining firm in 2006 • BA from Princeton University, Summa Cum Laude President, Data Kris Lazzaretti
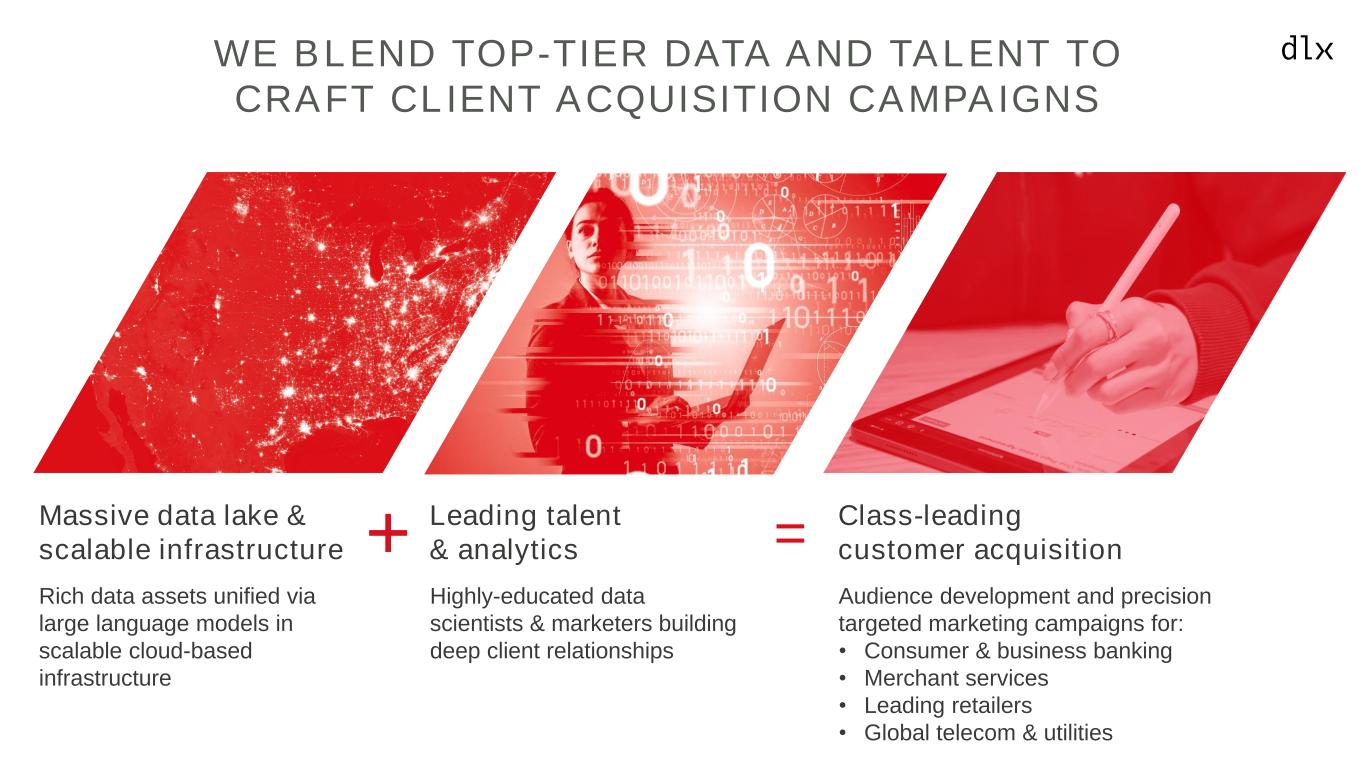
Massive data lake & scalable infrastructure Leading talent & analytics Class-leading customer acquisition WE BLEND TOP-TIER DATA AND TALENT TO CRAFT CLIENT ACQUISITION CAMPAIGNS Rich data assets unified via large language models in scalable cloud-based infrastructure Highly-educated data scientists & marketers building deep client relationships Audience development and precision targeted marketing campaigns for: • Consumer & business banking • Merchant services • Leading retailers • Global telecom & utilities =
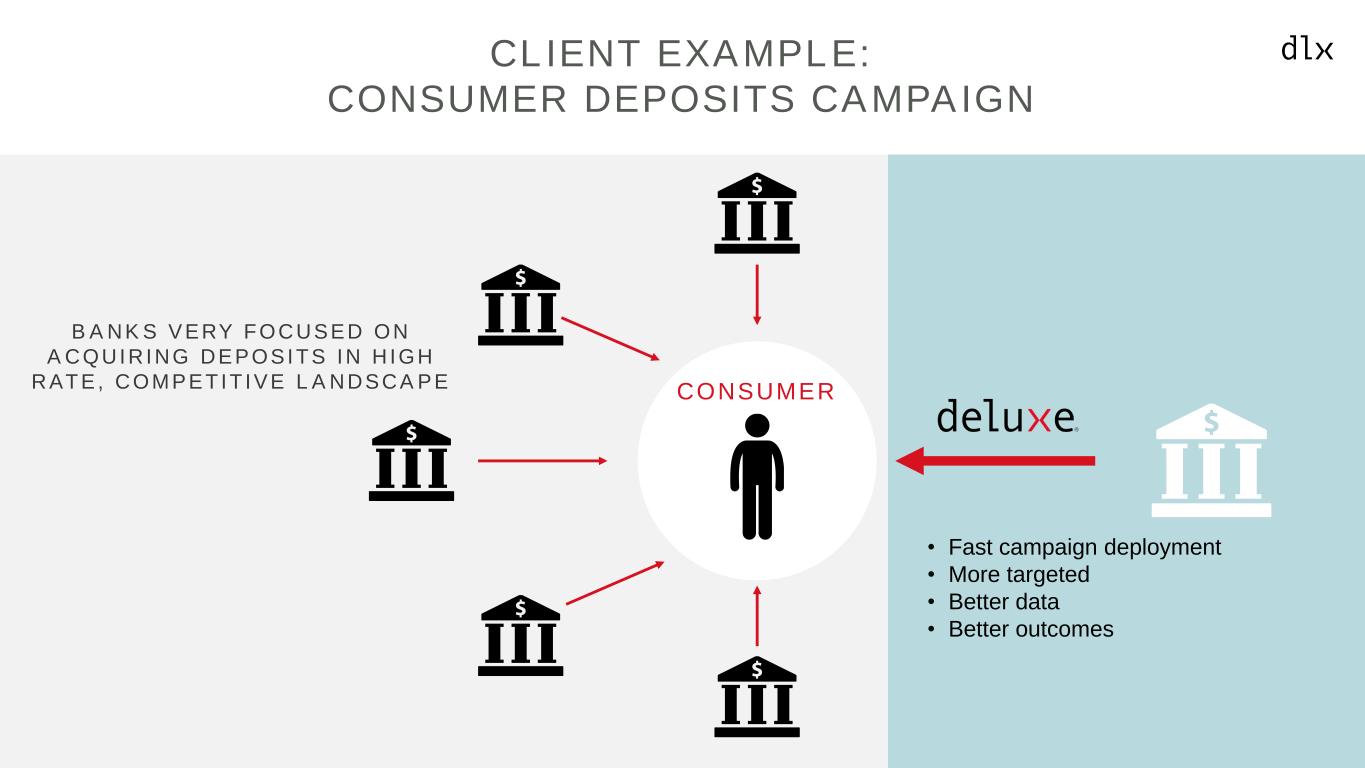
CLIENT EXAMPLE: CONSUMER DEPOSITS CAMPAIGN CONSUMER BANKS VERY FOCUSED ON ACQUIR ING DEPOSITS IN H IGH RATE, COMPETIT IVE LANDSCAPE • Fast campaign deployment • More targeted • Better data • Better outcomes
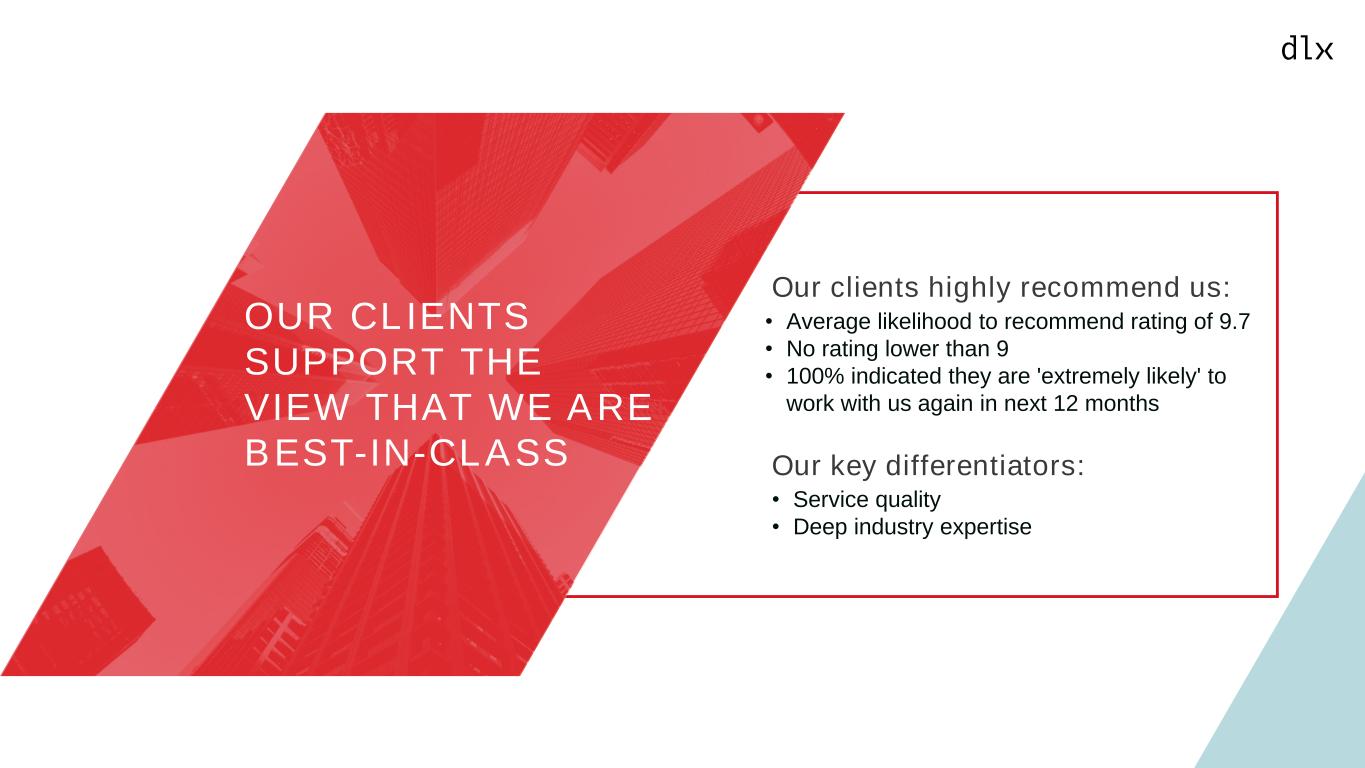
OUR CLIENTS SUPPORT THE VIEW THAT WE ARE BEST-IN-CLASS • Average likelihood to recommend rating of 9.7 • No rating lower than 9 • 100% indicated they are 'extremely likely' to work with us again in next 12 months • Service quality • Deep industry expertise Our clients highly recommend us: Our key differentiators:

“ ” Everything about your approach has benefited our business. Your data analytics is second to none. Your quality of service and attention to detail is unbelievable. The best strategic partner I have worked with in 20 years The Deluxe program outperforms pretty much every other customer acquisition program that we run. True partners who always go the extra mile: only partnership in 30 years where the agency works hand in hand with us and never makes us feel like it's about the money. There is no other partner I would rather have… collaborative, insightful, and responsive… I turn to them first!I have worked with in 20 years
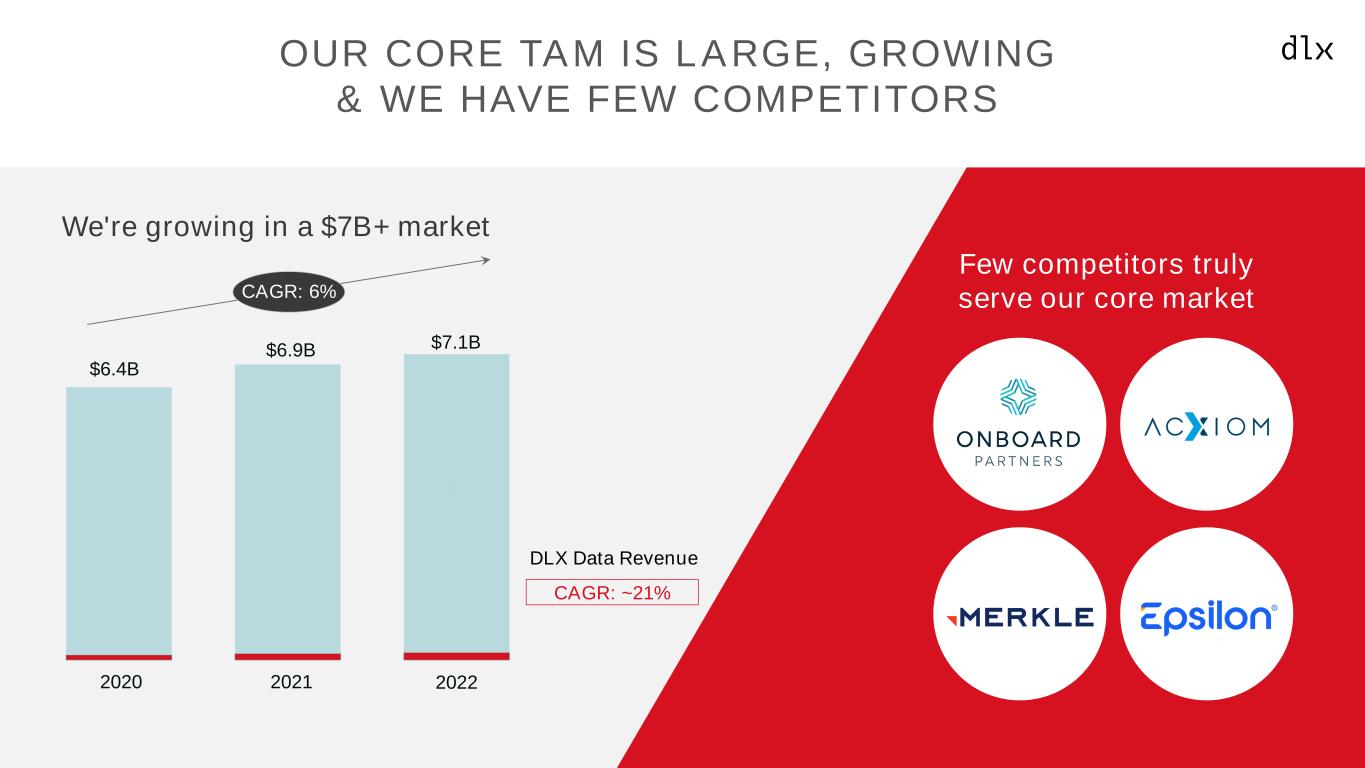
Few competitors truly serve our core market 2020 2021 2022 DLX Data Revenue $6.4B $6.9B $7.1B CAGR: 6% CAGR: ~21% We're growing in a $7B+ market OUR CORE TAM IS LARGE, GROWING & WE HAVE FEW COMPETITORS
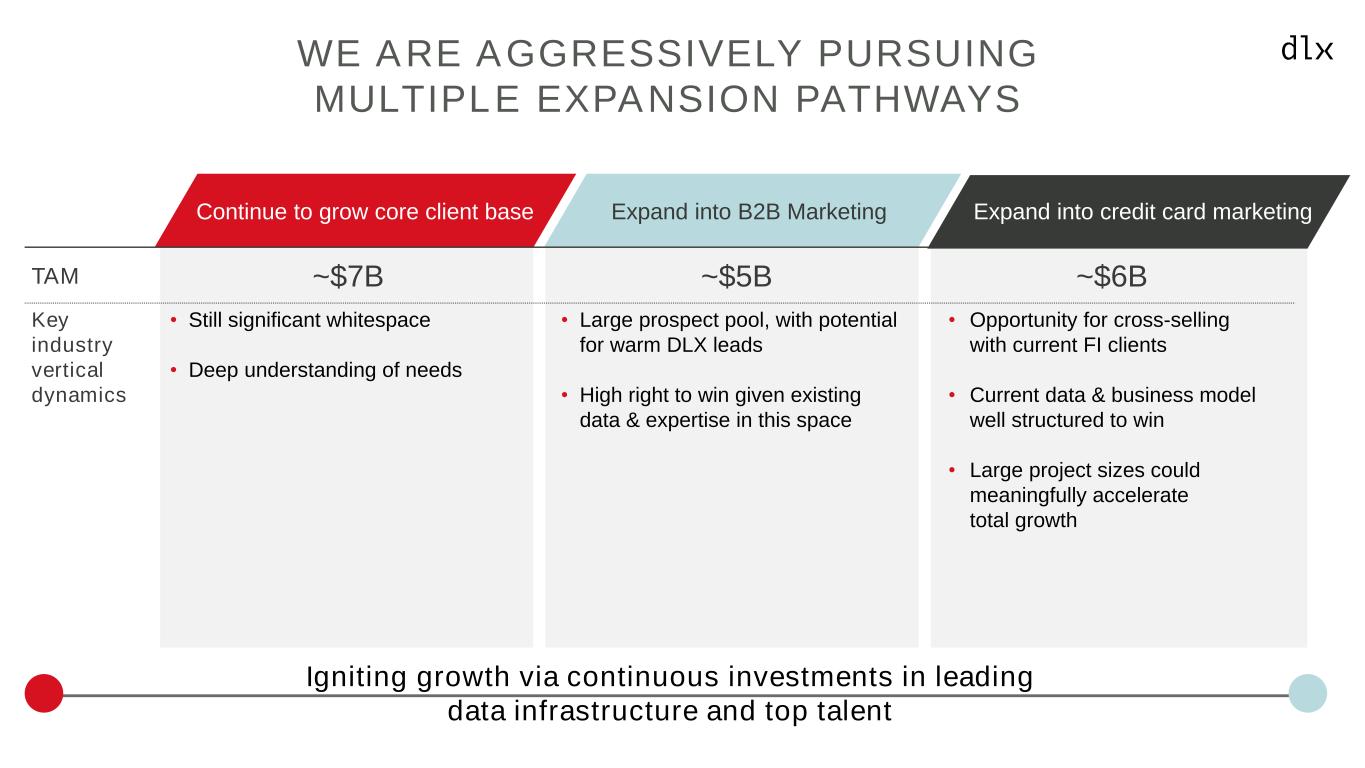
Expand into credit card marketing TAM ~$7B ~$5B ~$6B Key industry vertical dynamics • Still significant whitespace • Deep understanding of needs • Large prospect pool, with potential for warm DLX leads • High right to win given existing data & expertise in this space • Opportunity for cross-selling with current FI clients • Current data & business model well structured to win • Large project sizes could meaningfully accelerate total growth Igniting growth via continuous investments in leading data infrastructure and top talent WE ARE AGGRESSIVELY PURSUING MULTIPLE EXPANSION PATHWAYS Expand into B2B MarketingContinue to grow core client base
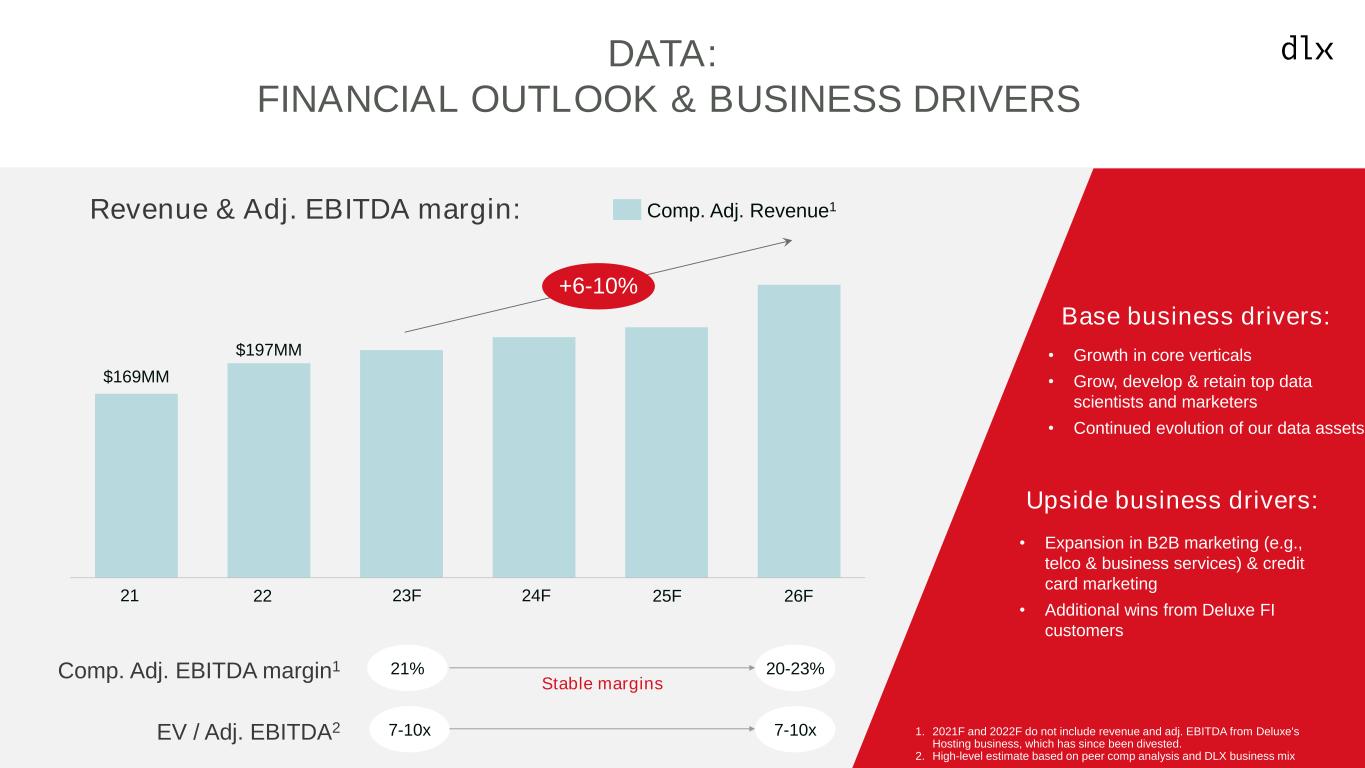
DATA: FINANCIAL OUTLOOK & BUSINESS DRIVERS Base business drivers: • Growth in core verticals • Grow, develop & retain top data scientists and marketers • Continued evolution of our data assets Upside business drivers: • Expansion in B2B marketing (e.g., telco & business services) & credit card marketing • Additional wins from Deluxe FI customers 1. 2021F and 2022F do not include revenue and adj. EBITDA from Deluxe's Hosting business, which has since been divested. 2. High-level estimate based on peer comp analysis and DLX business mix Revenue & Adj. EBITDA margin: Comp. Adj. EBITDA margin1 21% 20-23% Comp. Adj. Revenue1 EV / Adj. EBITDA2 7-10x 7-10x Stable margins $169MM $197MM 21 22 23F 24F 25F 26F +6-10%

PRINT: CHECKS & PROMO
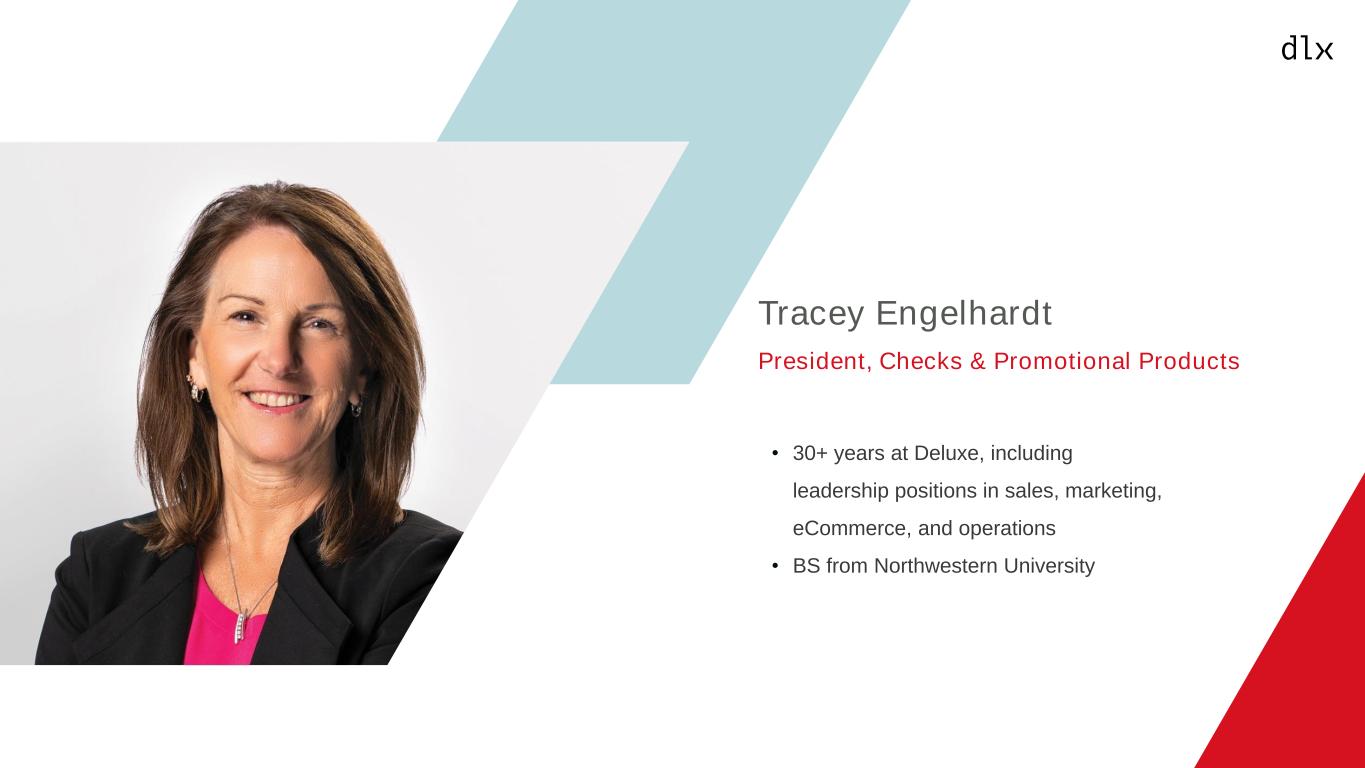
• 30+ years at Deluxe, including leadership positions in sales, marketing, eCommerce, and operations • BS from Northwestern University President, Checks & Promotional Products Tracey Engelhardt
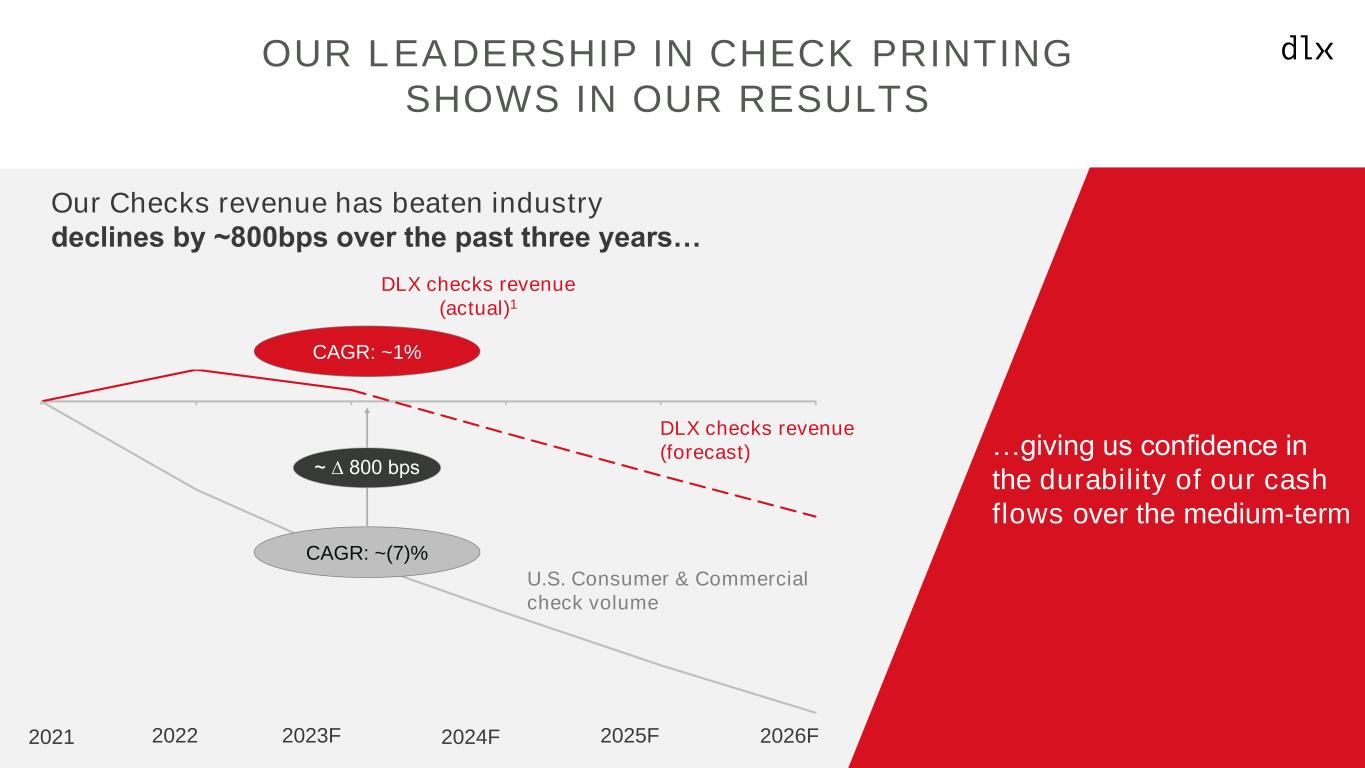
…giving us confidence in the durability of our cash flows over the medium-term OUR LEADERSHIP IN CHECK PRINTING SHOWS IN OUR RESULTS Our Checks revenue has beaten industry declines by ~800bps over the past three years… 2021 2022 2023F 2024F 2025F 2026F CAGR: ~(7)% CAGR: ~1% DLX checks revenue (actual)1 DLX checks revenue (forecast) U.S. Consumer & Commercial check volume ~ ∆ 800 bps
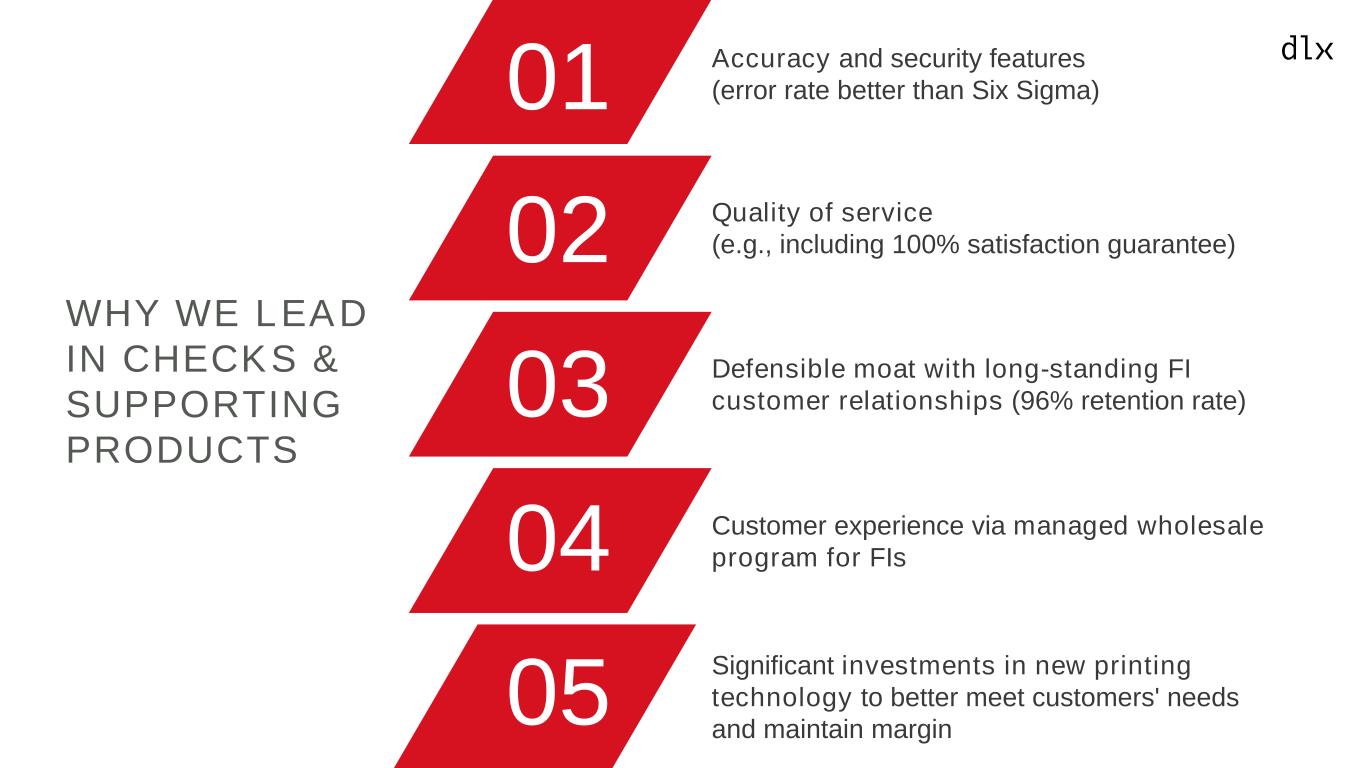
WHY WE LEAD IN CHECKS & SUPPORTING PRODUCTS 01 02 03 04 05 Accuracy and security features (error rate better than Six Sigma) Quality of service (e.g., including 100% satisfaction guarantee) Customer experience via managed wholesale program for FIs Defensible moat with long-standing FI customer relationships (96% retention rate) Significant investments in new printing technology to better meet customers' needs and maintain margin
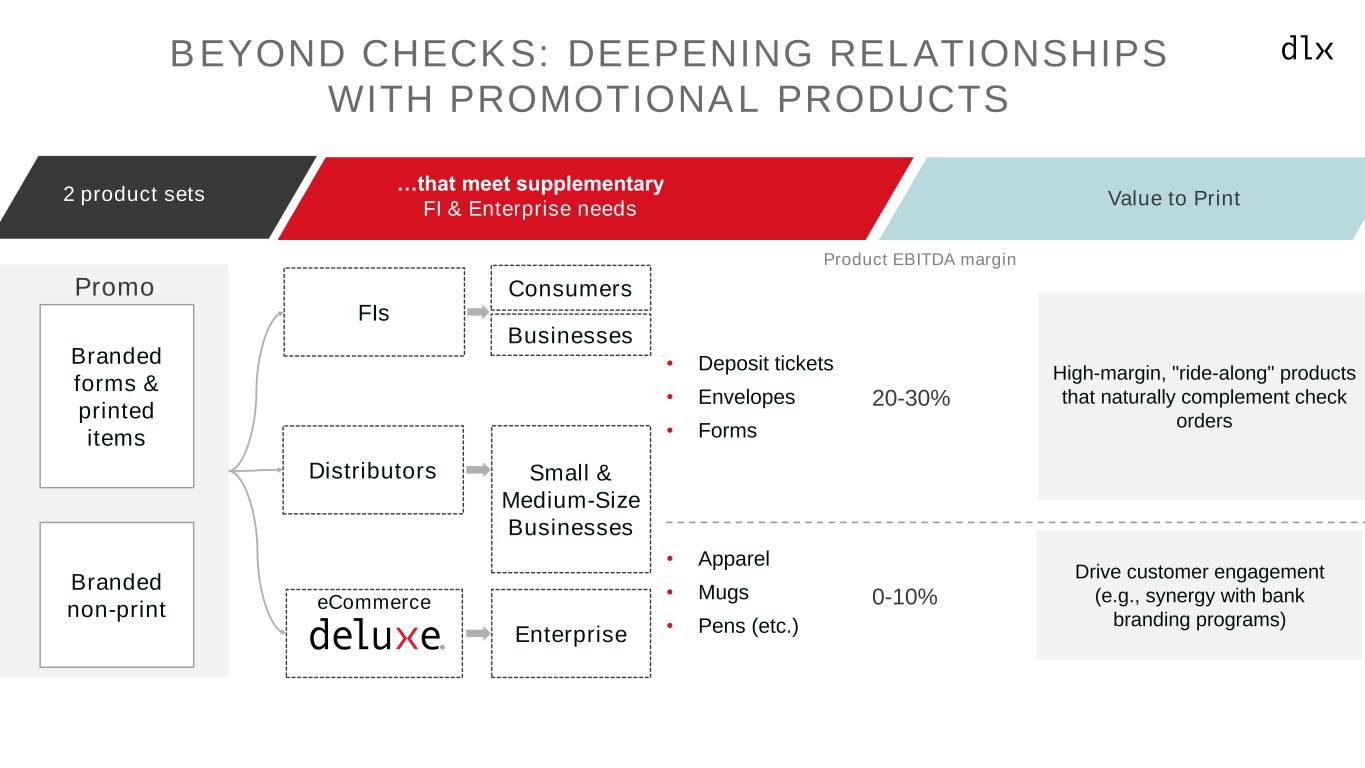
BEYOND CHECKS: DEEPENING RELATIONSHIPS WITH PROMOTIONAL PRODUCTS …that meet supplementary FI & Enterprise needs 2 product sets Value to Print Drive customer engagement (e.g., synergy with bank branding programs) High-margin, "ride-along" products that naturally complement check orders Branded forms & printed items Branded non-print Promo eCommerce Small & Medium-Size Businesses Enterprise Distributors FIs Consumers Businesses • Deposit tickets • Envelopes • Forms • Apparel • Mugs • Pens (etc.) Product EBITDA margin 20-30% 0-10%
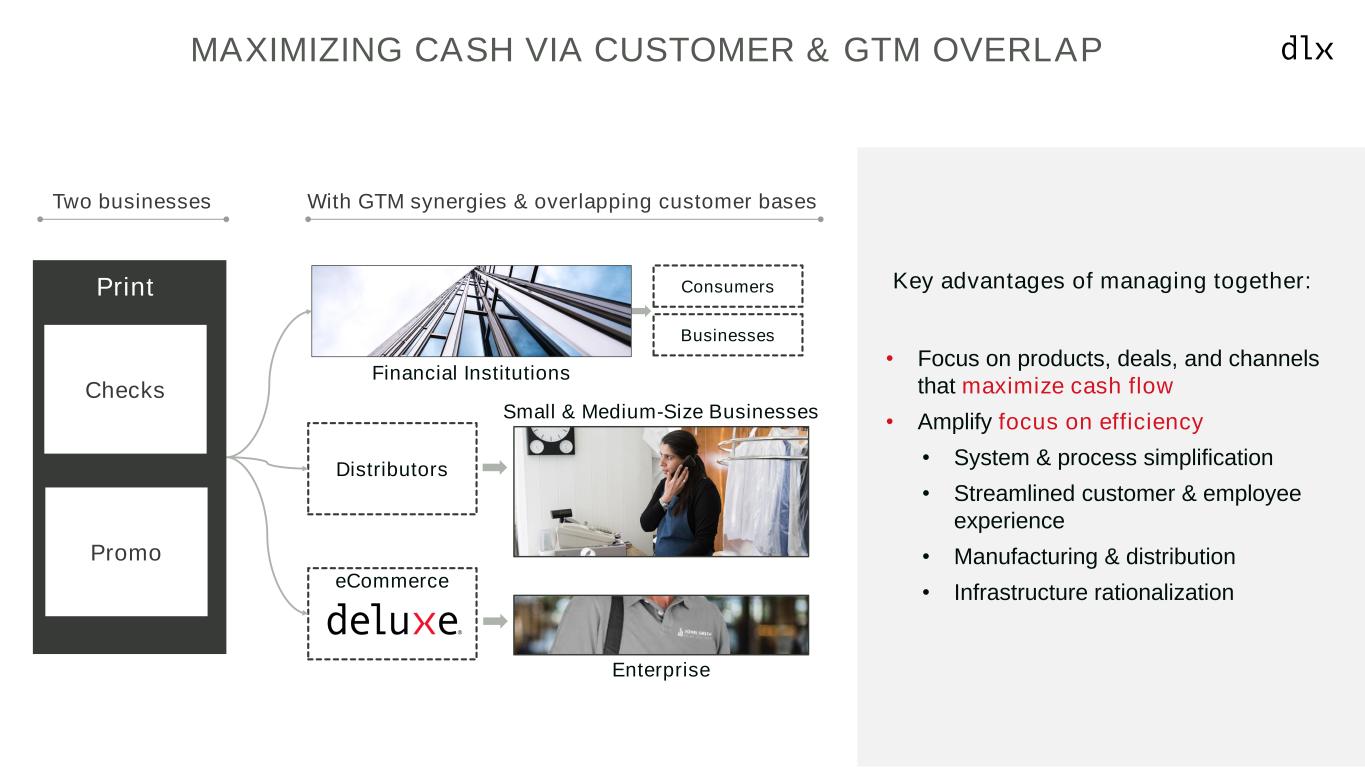
MAXIMIZING CASH VIA CUSTOMER & GTM OVERLAP • Focus on products, deals, and channels that maximize cash flow • Amplify focus on efficiency • System & process simplification • Streamlined customer & employee experience • Manufacturing & distribution • Infrastructure rationalization Key advantages of managing together: With GTM synergies & overlapping customer bases Distributors eCommerce Consumers Businesses Enterprise Small & Medium-Size Businesses Financial Institutions Checks Promo Print Two businesses
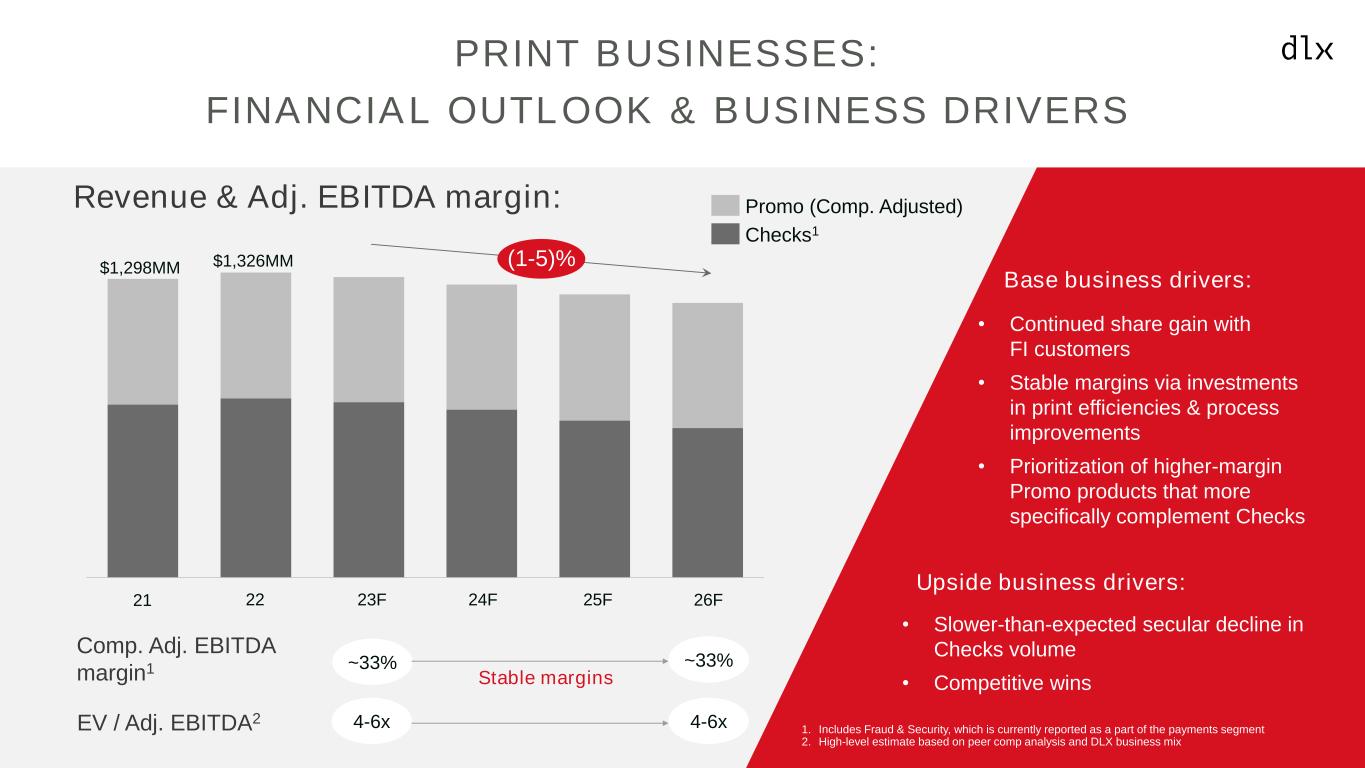
Base business drivers: • Continued share gain with FI customers • Stable margins via investments in print efficiencies & process improvements • Prioritization of higher-margin Promo products that more specifically complement Checks Upside business drivers: • Slower-than-expected secular decline in Checks volume • Competitive wins PRINT BUSINESSES: FINANCIAL OUTLOOK & BUSINESS DRIVERS Revenue & Adj. EBITDA margin: Comp. Adj. EBITDA margin1 ~33% ~33% Promo (Comp. Adjusted) Checks1 EV / Adj. EBITDA2 4-6x 4-6x Stable margins 1. Includes Fraud & Security, which is currently reported as a part of the payments segment 2. High-level estimate based on peer comp analysis and DLX business mix 21 22 23F 24F 25F 26F $1,298MM $1,326MM (1-5)%

FINANCIAL PROJECTIONS
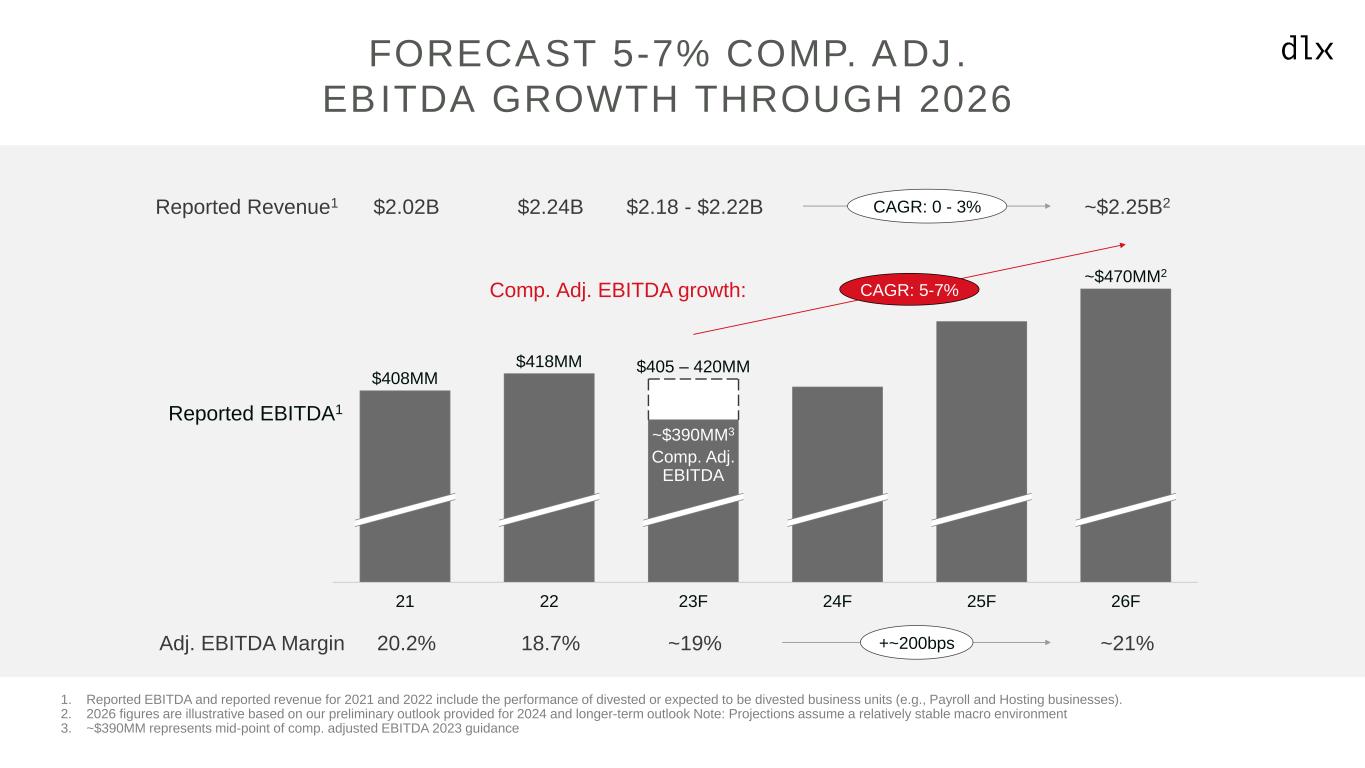
FORECAST 5-7% COMP. ADJ. EBITDA GROWTH THROUGH 2026 1. Reported EBITDA and reported revenue for 2021 and 2022 include the performance of divested or expected to be divested business units (e.g., Payroll and Hosting businesses). 2. 2026 figures are illustrative based on our preliminary outlook provided for 2024 and longer-term outlook Note: Projections assume a relatively stable macro environment 3. ~$390MM represents mid-point of comp. adjusted EBITDA 2023 guidance 21 22 23F 24F 25F Comp. Adj. EBITDA Reported EBITDA1 $418MM $405 – 420MM ~$470MM2 26F $408MM CAGR: 5-7% Adj. EBITDA Margin 18.7%20.2% ~19% ~21% Reported Revenue1 $2.18 - $2.22B ~$2.25B2$2.02B $2.24B CAGR: 0 - 3% +~200bps ~$390MM3 Comp. Adj. EBITDA growth:
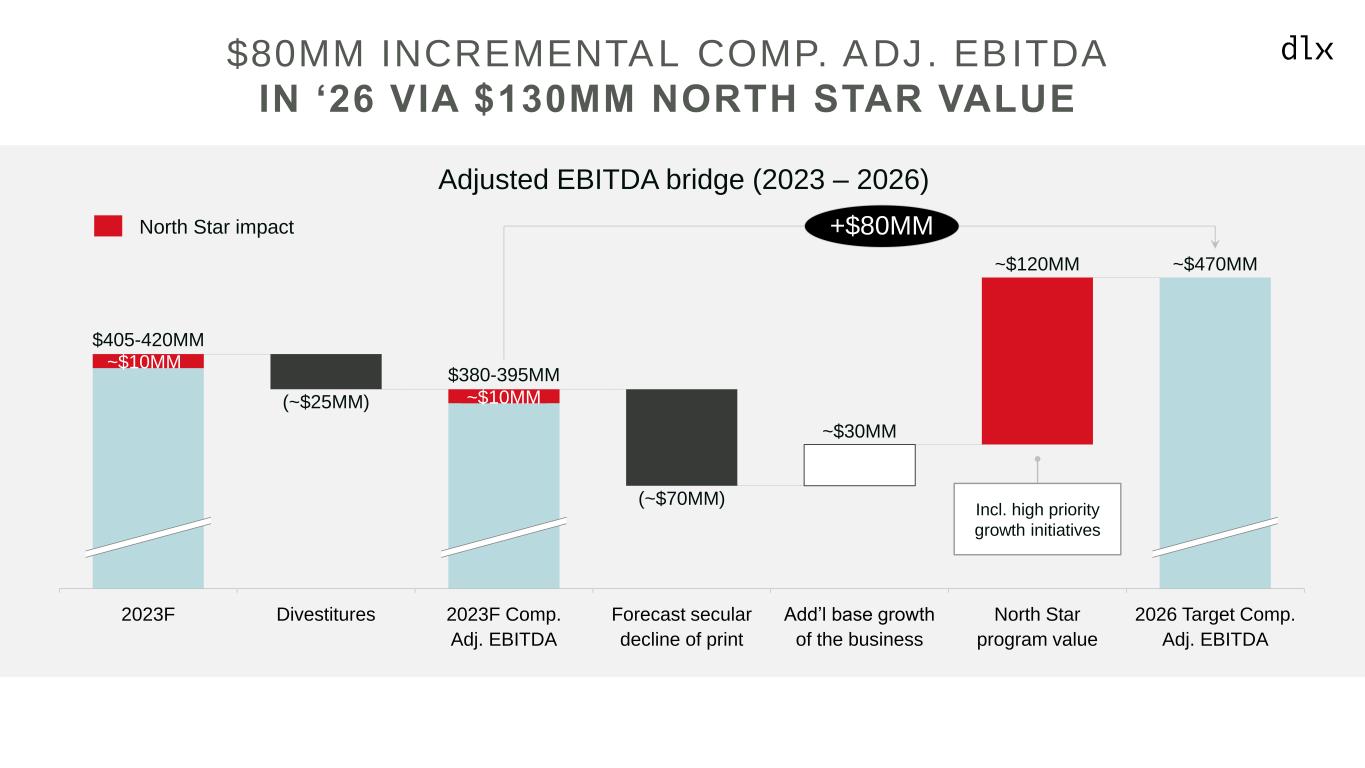
$80MM INCREMENTAL COMP. ADJ. EBITDA IN ‘26 VIA $130MM NORTH STAR VALUE (~$70MM) ~$30MM ~$120MM ~$470MM 2023F Divestitures ~$10MM 2023F Comp. Adj. EBITDA Forecast secular decline of print Add’l base growth of the business North Star program value 2026 Target Comp. Adj. EBITDA (~$25MM) $380-395MM $405-420MM +$80MMNorth Star impact Incl. high priority growth initiatives Adjusted EBITDA bridge (2023 – 2026) ~$10MM
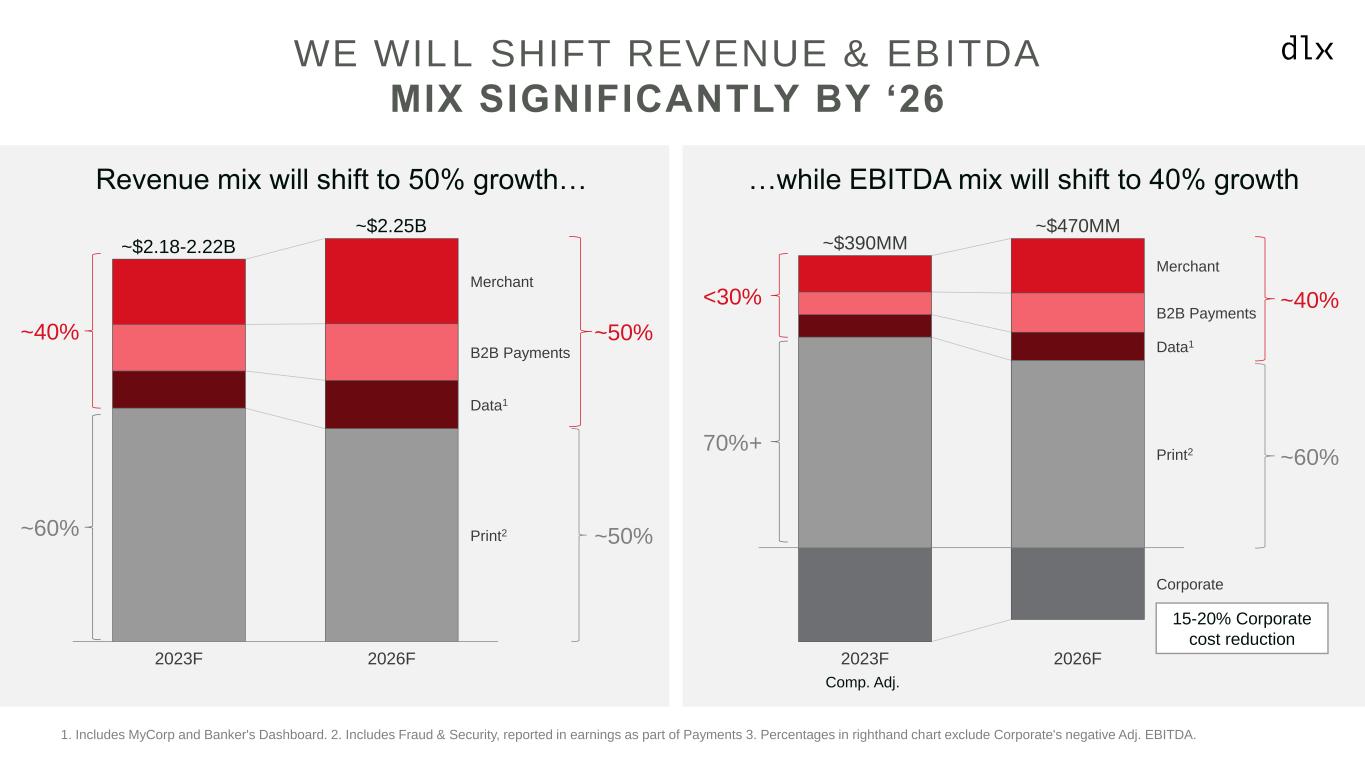
…while EBITDA mix will shift to 40% growth WE WILL SHIFT REVENUE & EBITDA MIX SIGNIFICANTLY BY ‘26 1. Includes MyCorp and Banker's Dashboard. 2. Includes Fraud & Security, reported in earnings as part of Payments 3. Percentages in righthand chart exclude Corporate's negative Adj. EBITDA. Revenue mix will shift to 50% growth… 2023F 2026F Merchant B2B Payments Data1 Print2 Corporate ~$390MM ~$470MM ~40% ~60% <30% 70%+ 15-20% Corporate cost reduction Comp. Adj. 2023F 2026F Merchant B2B Payments Data1 Print2 ~$2.18-2.22B ~$2.25B ~50% ~50% ~40% ~60%
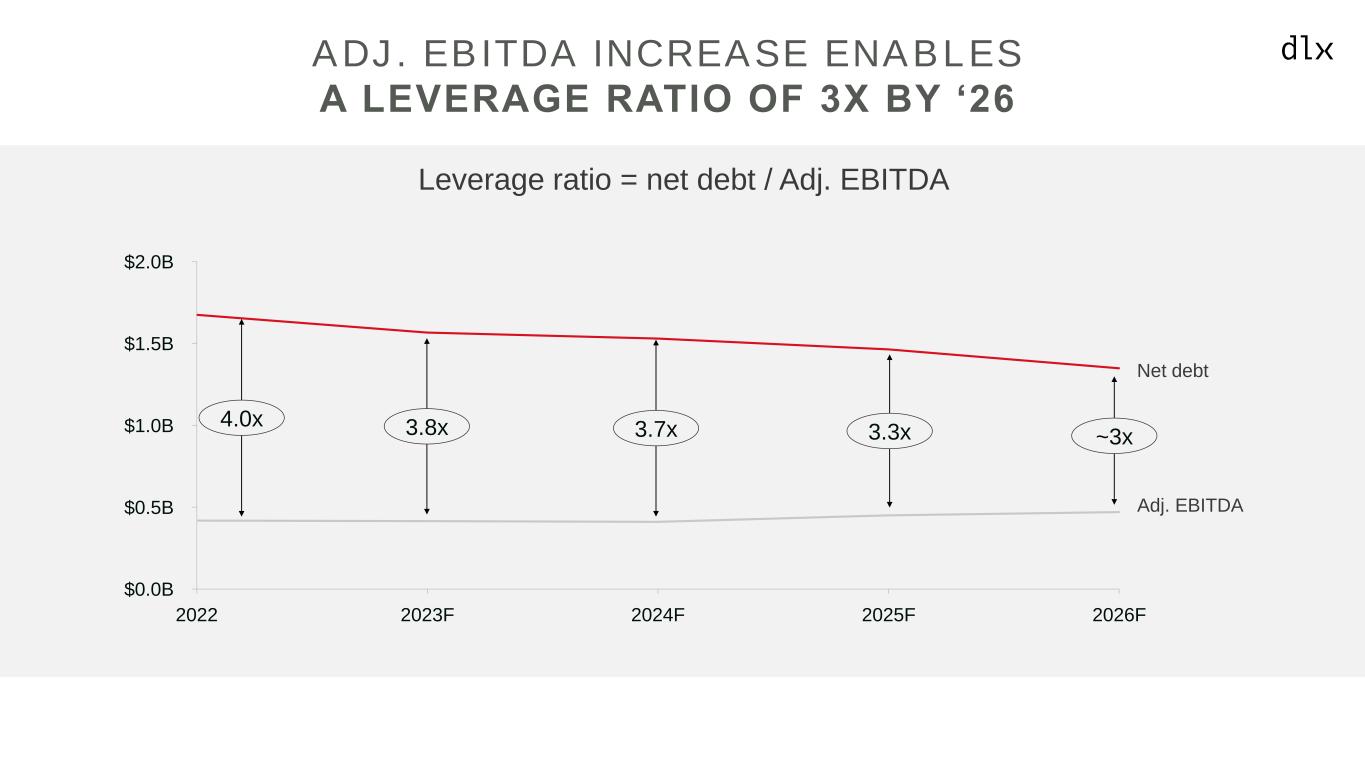
ADJ. EBITDA INCREASE ENABLES A LEVERAGE RATIO OF 3X BY ‘26 Leverage ratio = net debt / Adj. EBITDA 2022 2023F 2024F 2025F 2026F $0.0B $0.5B $1.0B $1.5B $2.0B 4.0x 3.8x 3.7x ~3x3.3x Net debt Adj. EBITDA
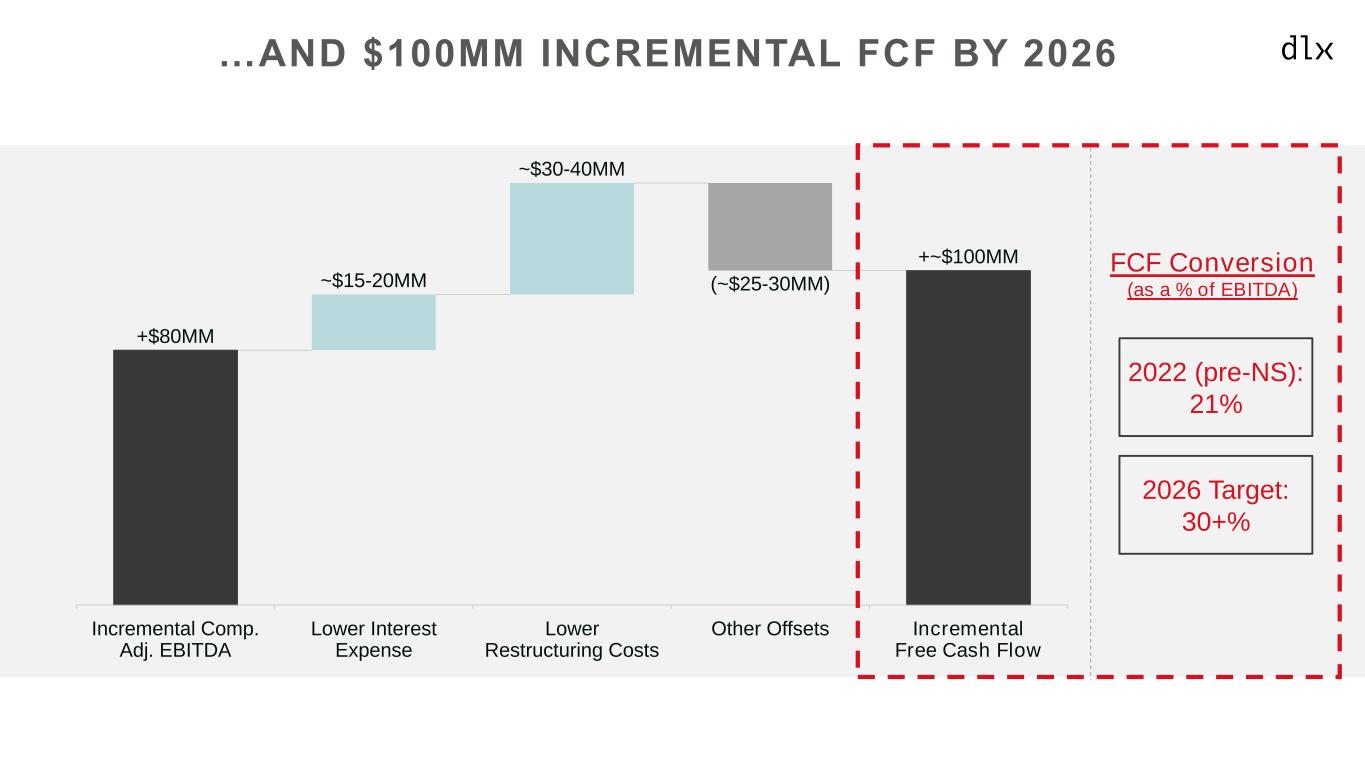
…AND $100MM INCREMENTAL FCF BY 2026 Incremental Comp. Adj. EBITDA Lower Interest Expense Lower Restructuring Costs Other Offsets Incremental Free Cash Flow +$80MM ~$15-20MM ~$30-40MM (~$25-30MM) +~$100MM 2026 Target: 30+% 2022 (pre-NS): 21% FCF Conversion (as a % of EBITDA)
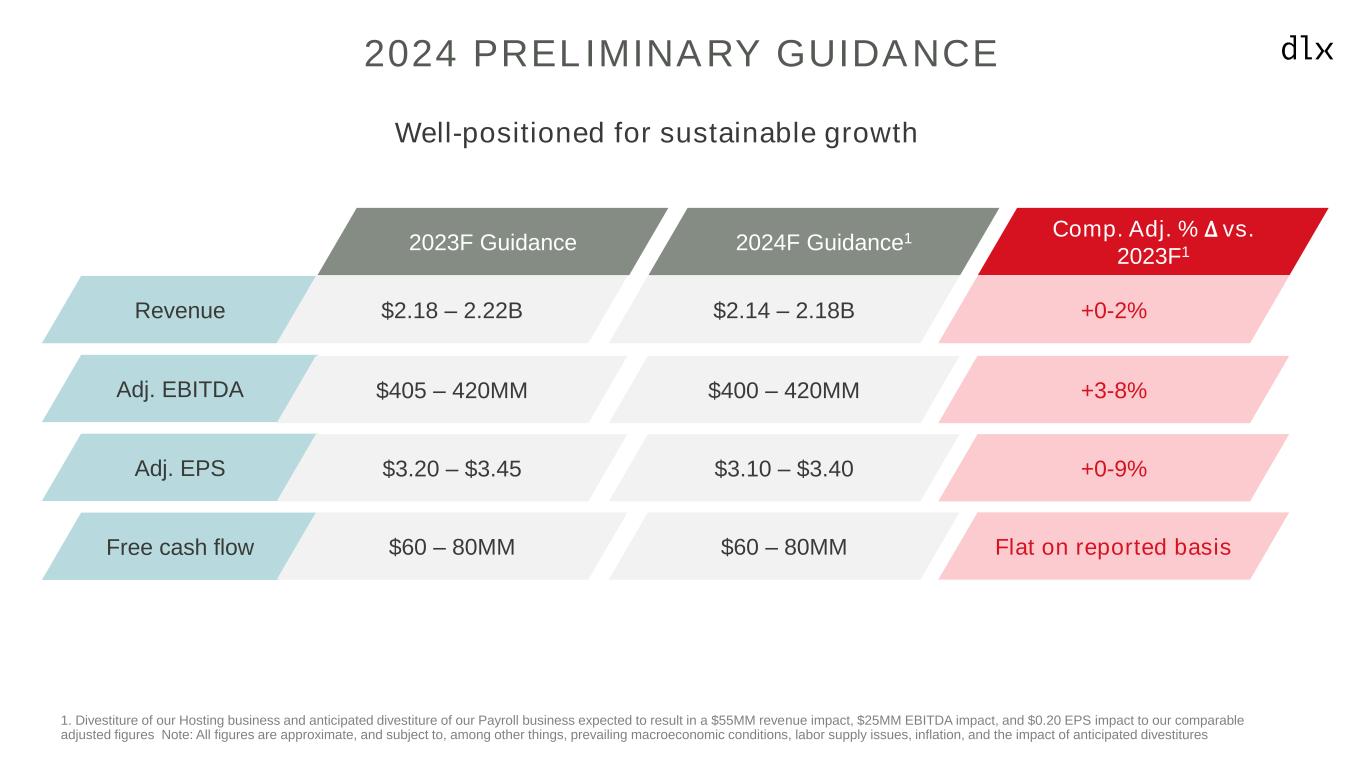
2024 PRELIMINARY GUIDANCE 1. Divestiture of our Hosting business and anticipated divestiture of our Payroll business expected to result in a $55MM revenue impact, $25MM EBITDA impact, and $0.20 EPS impact to our comparable adjusted figures Note: All figures are approximate, and subject to, among other things, prevailing macroeconomic conditions, labor supply issues, inflation, and the impact of anticipated divestitures Well-positioned for sustainable growth 2023F Guidance 2024F Guidance1 Comp. Adj. % ∆ vs. 2023F1 Revenue Adj. EBITDA Adj. EPS Free cash flow $2.18 – 2.22B $2.14 – 2.18B +0-2% $405 – 420MM $400 – 420MM +3-8% $3.20 – $3.45 $3.10 – $3.40 +0-9% $60 – 80MM $60 – 80MM Flat on reported basis
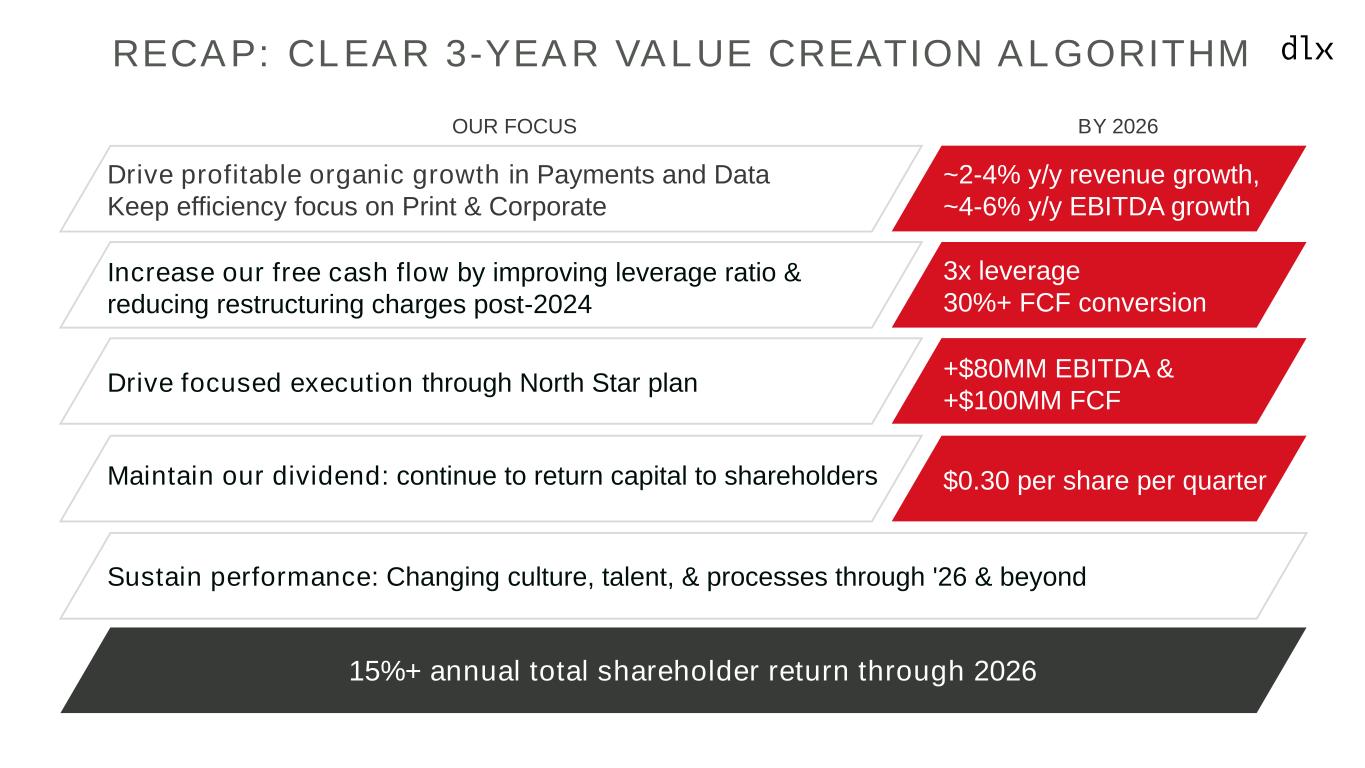
Drive profitable organic growth in Payments and Data Keep efficiency focus on Print & Corporate Increase our free cash flow by improving leverage ratio & reducing restructuring charges post-2024 Drive focused execution through North Star plan Maintain our dividend: continue to return capital to shareholders Sustain performance: Changing culture, talent, & processes through '26 & beyond OUR FOCUS BY 2026 ~2-4% y/y revenue growth, ~4-6% y/y EBITDA growth 3x leverage 30%+ FCF conversion +$80MM EBITDA & +$100MM FCF $0.30 per share per quarter 15%+ annual total shareholder return through 2026 RECAP: CLEAR 3-YEAR VALUE CREATION ALGORITHM

OUR EXECUTION ROADMAP IS CLEAR Our Strategy: 15%+ annual TSR through ‘26 Revitalized company & built the foundation • Rationalized the portfolio • Strong competitive position • Natural synergies • Modernized our infrastructure • Primed for growth: acquired First American Enabled by: 1. One Deluxe go-to-market model 2. Operational execution via North Star 3. Capital allocation discipline Profitably grow Payments & Data by leveraging the cash flow, brand, & relationships from Print & transfer value from debt to equity holders
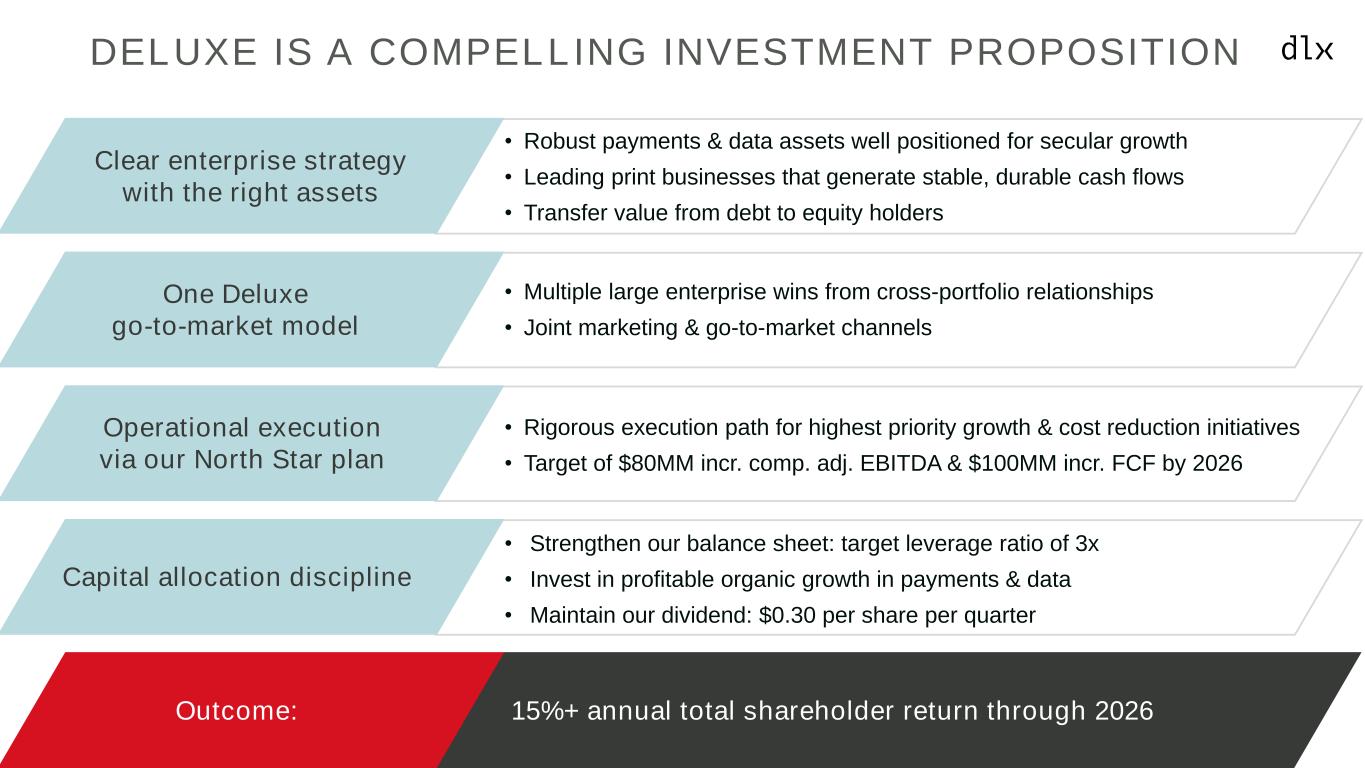
• Robust payments & data assets well positioned for secular growth • Leading print businesses that generate stable, durable cash flows • Transfer value from debt to equity holders DELUXE IS A COMPELLING INVESTMENT PROPOSITION • Multiple large enterprise wins from cross-portfolio relationships • Joint marketing & go-to-market channels • Rigorous execution path for highest priority growth & cost reduction initiatives • Target of $80MM incr. comp. adj. EBITDA & $100MM incr. FCF by 2026 • Strengthen our balance sheet: target leverage ratio of 3x • Invest in profitable organic growth in payments & data • Maintain our dividend: $0.30 per share per quarter Capital allocation discipline Operational execution via our North Star plan One Deluxe go-to-market model Clear enterprise strategy with the right assets Outcome: 15%+ annual total shareholder return through 2026

THANK YOU TO EVERY DELUXER FOR YOUR HARD WORK AND FANTASTIC CONTRIBUTIONS
Q&A
APPENDIX
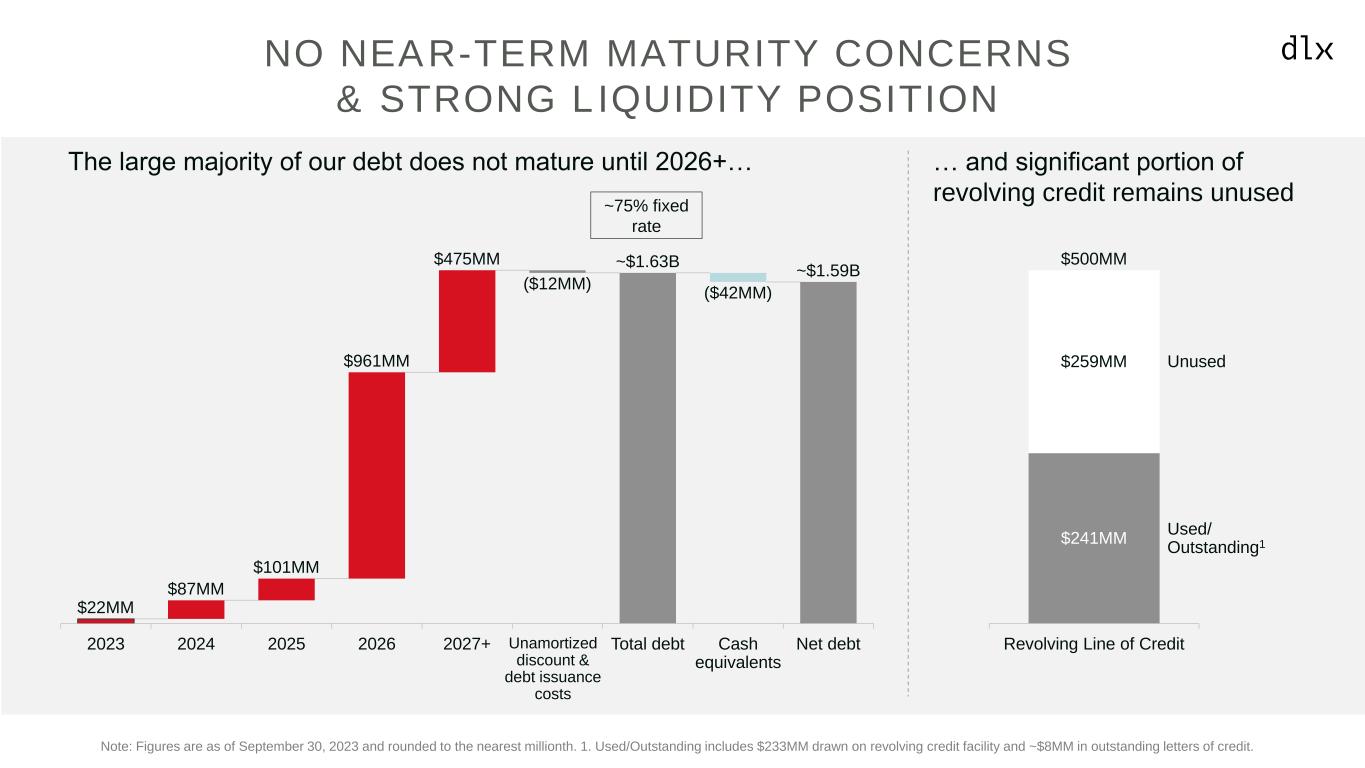
NO NEAR-TERM MATURITY CONCERNS & STRONG LIQUIDITY POSITION 2023 2024 2025 2026 2027+ Unamortized discount & debt issuance costs Total debt Cash equivalents Net debt $22MM $87MM $101MM $961MM $475MM ($12MM) ~$1.63B ($42MM) ~$1.59B The large majority of our debt does not mature until 2026+… Note: Figures are as of September 30, 2023 and rounded to the nearest millionth. 1. Used/Outstanding includes $233MM drawn on revolving credit facility and ~$8MM in outstanding letters of credit. $241MM $259MM Revolving Line of Credit Used/ Outstanding1 Unused $500MM … and significant portion of revolving credit remains unused ~75% fixed rate
The company has not reconciled adjusted EBITDA, comparable adjusted EBITDA, adjusted EPS, free cash flow or net leverage outlook guidance for 2023 through 2026 to the directly comparable GAAP financial measures because the company does not provide outlook guidance for the reconciling items between net income, adjusted net income or adjusted EBITDA, and certain of these reconciling items impact cash flows from operating activities. Because of the substantial uncertainty and variability surrounding certain of the forward-looking reconciling items, including asset impairment charges, restructuring and integration costs, gains and losses on sales of businesses and long-lived assets, and certain legal-related expenses, a reconciliation of the non-GAAP financial measure outlook guidance to the corresponding GAAP measures is not available without unreasonable effort. The probable significance of certain of these reconciling items is high and, based on historical experience, could be material. RECONCILIATION OF GAAP TO NON-GAAP MEASURES
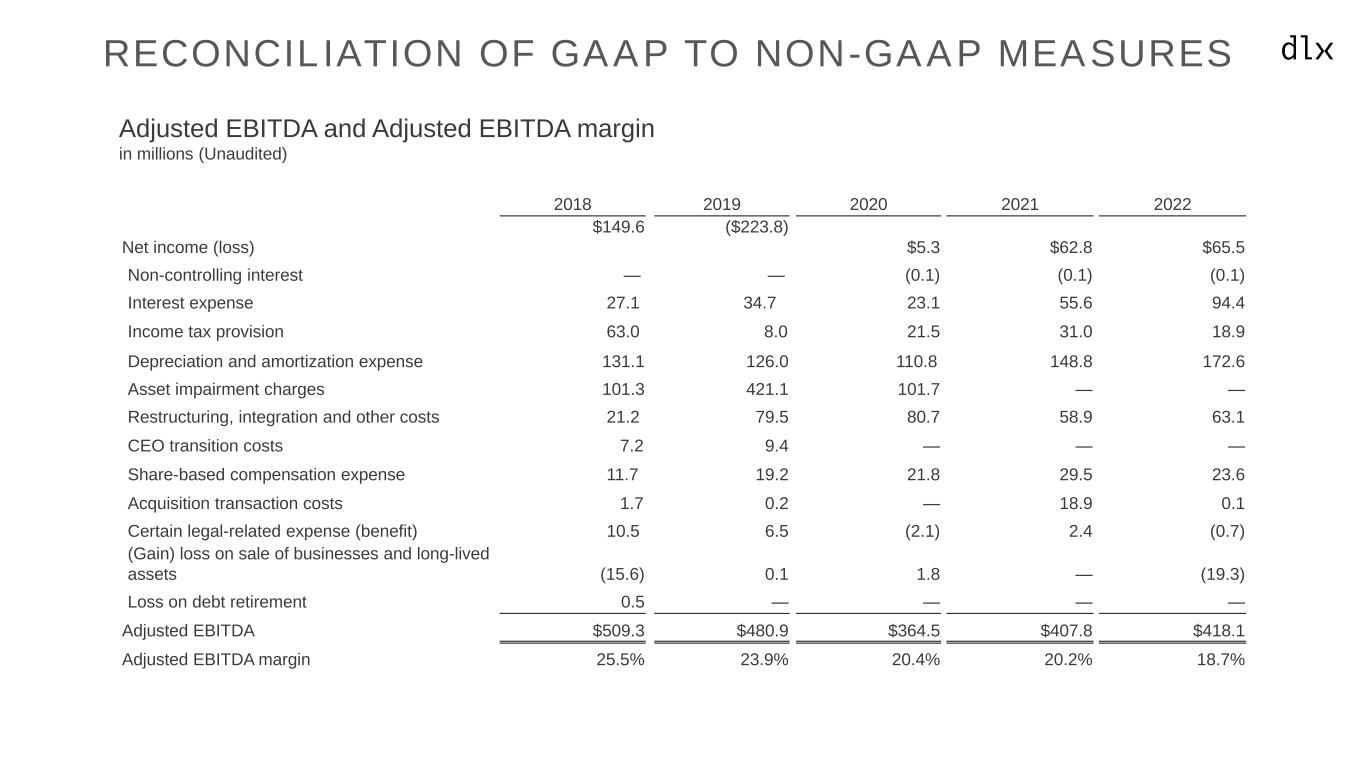
Adjusted EBITDA and Adjusted EBITDA margin in millions (Unaudited) 2018 2019 2020 2021 2022 Net income (loss) $149.6 ($223.8) $5.3 $62.8 $65.5 Non-controlling interest — — (0.1) (0.1) (0.1) Interest expense 27.1 34.7 23.1 55.6 94.4 Income tax provision 63.0 8.0 21.5 31.0 18.9 Depreciation and amortization expense 131.1 126.0 110.8 148.8 172.6 Asset impairment charges 101.3 421.1 101.7 — — Restructuring, integration and other costs 21.2 79.5 80.7 58.9 63.1 CEO transition costs 7.2 9.4 — — — Share-based compensation expense 11.7 19.2 21.8 29.5 23.6 Acquisition transaction costs 1.7 0.2 — 18.9 0.1 Certain legal-related expense (benefit) 10.5 6.5 (2.1) 2.4 (0.7) (Gain) loss on sale of businesses and long-lived assets (15.6) 0.1 1.8 — (19.3) Loss on debt retirement 0.5 — — — — Adjusted EBITDA $509.3 $480.9 $364.5 $407.8 $418.1 Adjusted EBITDA margin 25.5% 23.9% 20.4% 20.2% 18.7% RECONCILIATION OF GAAP TO NON-GAAP MEASURES
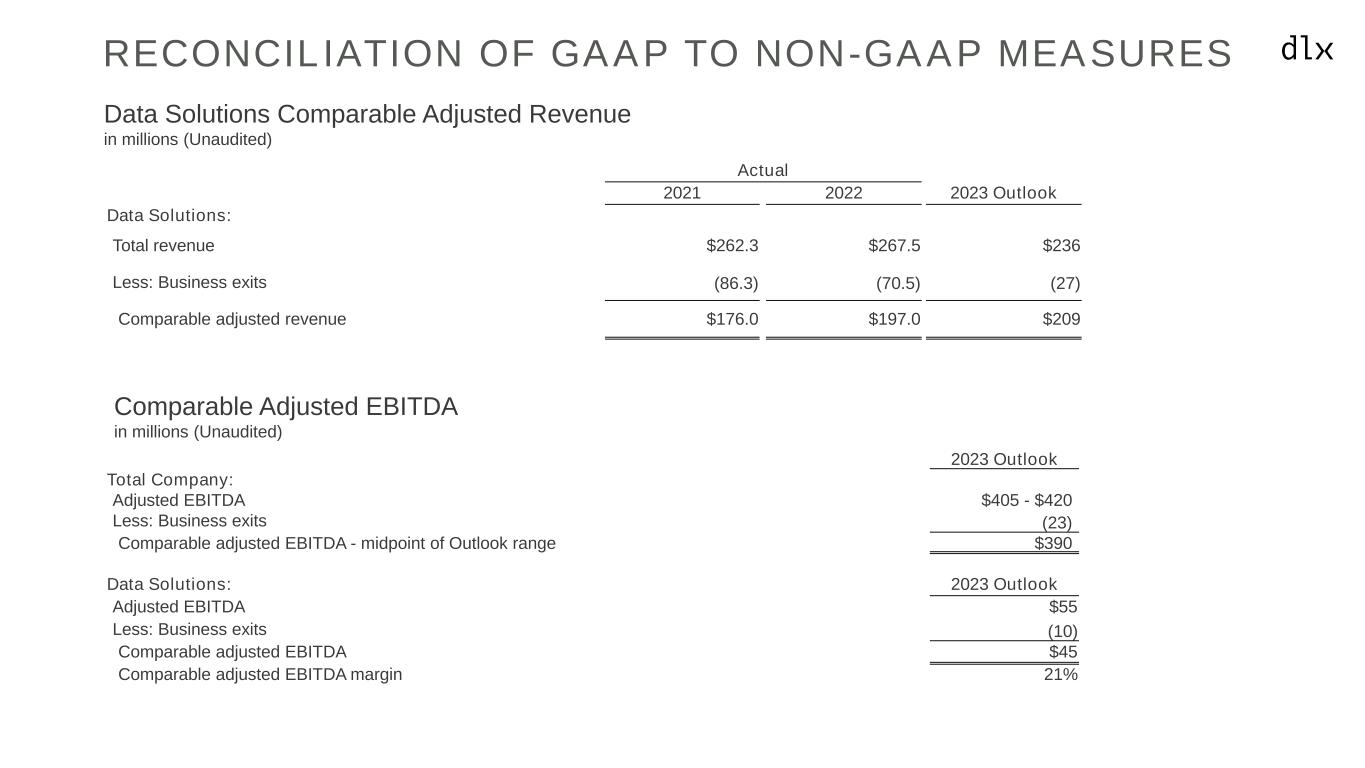
Data Solutions Comparable Adjusted Revenue in millions (Unaudited) Actual 2021 2022 2023 Outlook Data Solutions: Total revenue $262.3 $267.5 $236 Less: Business exits (86.3) (70.5) (27) Comparable adjusted revenue $176.0 $197.0 $209 Comparable Adjusted EBITDA in millions (Unaudited) 2023 Outlook Total Company: Adjusted EBITDA $405 - $420 Less: Business exits (23) Comparable adjusted EBITDA - midpoint of Outlook range $390 Data Solutions: 2023 Outlook Adjusted EBITDA $55 Less: Business exits (10) Comparable adjusted EBITDA $45 Comparable adjusted EBITDA margin 21% RECONCILIATION OF GAAP TO NON-GAAP MEASURES
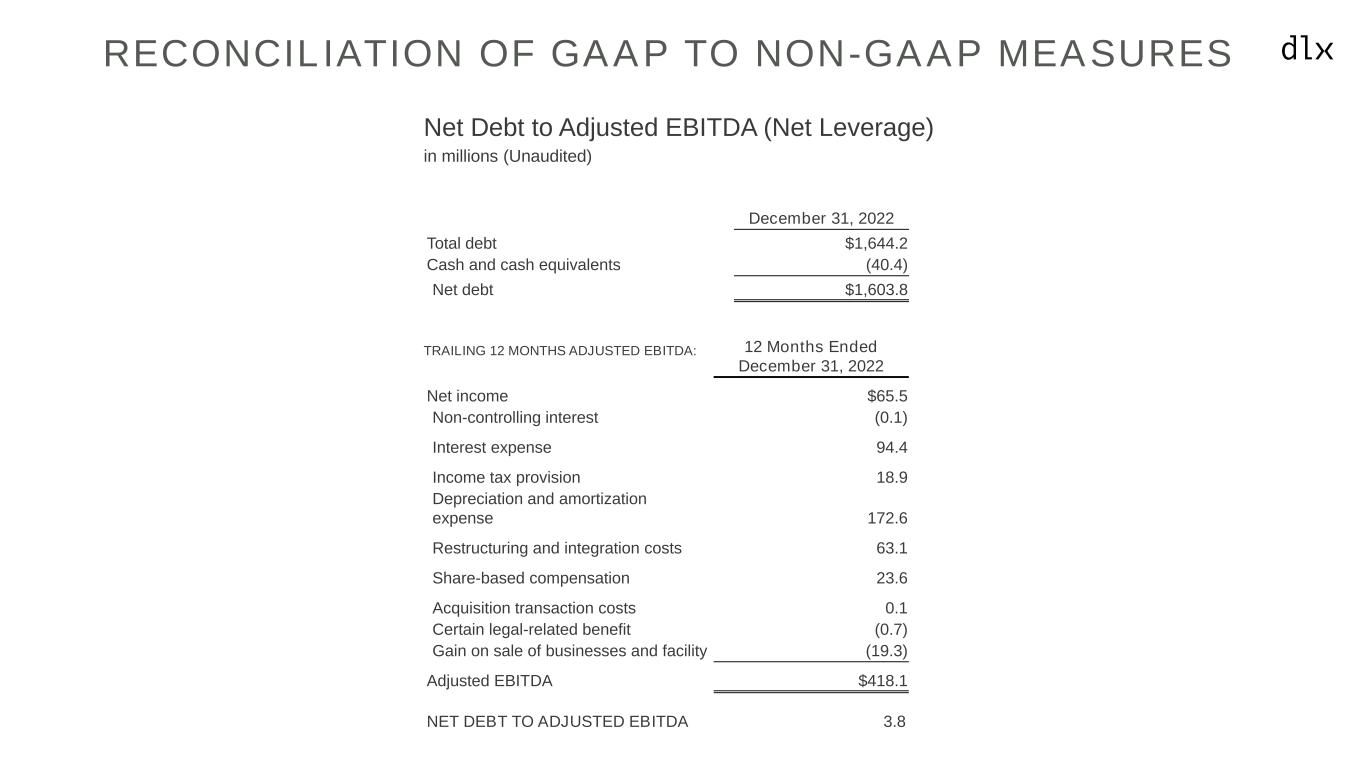
Net Debt to Adjusted EBITDA (Net Leverage) in millions (Unaudited) December 31, 2022 Total debt $1,644.2 Cash and cash equivalents (40.4) Net debt $1,603.8 12 Months Ended December 31, 2022 Net income $65.5 Non-controlling interest (0.1) Interest expense 94.4 Income tax provision 18.9 Depreciation and amortization expense 172.6 Restructuring and integration costs 63.1 Share-based compensation 23.6 Acquisition transaction costs 0.1 Certain legal-related benefit (0.7) Gain on sale of businesses and facility (19.3) Adjusted EBITDA $418.1 NET DEBT TO ADJUSTED EBITDA 3.8 TRAILING 12 MONTHS ADJUSTED EBITDA: RECONCILIATION OF GAAP TO NON-GAAP MEASURES
