EXHIBIT 99.2
Published on June 18, 2026
Exhibit 99.2
| 214 17 32 55 58 54 184 218 222 191 191 191 107 107 107 © 2026 Deluxe Corporation. Proprietary and Confidential. Deluxe Corporation Acquisition of Celero Commerce June 18, 2026 |
| 214 17 32 55 58 54 184 218 222 191 191 191 107 107 107 Statements made in this presentation concerning Deluxe, the company’s or management’s intentions, expectations, outlook or predictions about future results or events are “forward-looking statements” within the meaning of the Private Securities Litigation Reform Act of 1995. Such statements reflect management’s current intentions or beliefs and are subject to risks and uncertainties that could cause actual results or events to vary from stated expectations, which variations could be material and adverse. Factors that could produce such a variation include, but are not limited to, the following: the risk that the proposed Celero transaction may not be completed in a timely manner or at all; the inability to integrate and/or realize the benefits of the Celero transaction, including expected synergies; the occurrence of any fact, event, change, development or circumstance that could give rise to the termination of the Celero acquisition agreement; the failure to satisfy any of the conditions to the consummation of the Celero acquisition, including the receipt of certain regulatory approvals; the risk that the financing necessary to consummate the Celero acquisition may not be obtained, may be delayed, or may be available only on less favorable terms than anticipated; that the announcement of the Celero acquisition could disrupt the company’s or Celero’s relationships with customers, employees or other business partners; changes in local, regional, national and international economic or political conditions, including those resulting from heightened inflation, rising interest rates, a recession, or intensified international hostilities, and the impact they may have on the company, its data, customers or demand for the company’s products and services; the effect of proposed and enacted legislative and regulatory actions affecting the company or the financial services industry as a whole; continuing cost increases and/or declines in the availability of data, materials and other services; the company’s ability to execute its strategy and to realize the intended benefits; the inherent unreliability of earnings, revenue and cash flow predictions due to numerous factors, many of which are beyond the company’s control; declining demand for the company’s checks, check-related products and services and business forms; risks that the company’s strategies intended to drive sustained revenue and earnings growth, despite the continuing decline in checks and forms, are delayed or unsuccessful; intense competition; continued consolidation of financial institutions and/or bank failures, thereby reducing the number of potential customers and referral sources and increasing downward pressure on the company’s revenue and gross profit; risks related to other acquisitions, including integration-related risks and risks that future acquisitions will not be consummated; risks that any such acquisitions do not produce the anticipated results or synergies; risks that the company’s cost reduction initiatives will be delayed or unsuccessful; risks related to any divestitures contemplated or undertaken by the company; performance shortfalls by one or more of the company’s major suppliers, licensors, data or service providers; continuing supply chain and labor supply issues; unanticipated delays, costs and expenses in the development and marketing of products and services, including financial technology and treasury management solutions; the failure of such products and services to deliver the expected revenues and other financial targets; risks related to security breaches, computer malware or other cyber-attacks; risks of interruptions to the company’s website operations or information technology systems; and risks of unfavorable outcomes and the costs to defend litigation and other disputes. The company’s forward-looking statements speak only as of the time made, and management assumes no obligation to publicly update any such statements. Additional information concerning these and other factors that could cause actual results and events to differ materially from the company’s current expectations are contained in the company’s Form 10-K for the year ended December 31, 2025, and other filings made with the SEC. The company undertakes no obligation to update or revise any forward-looking statements to reflect subsequent events, new information or future circumstances. CAUTIONARY STATEMENT Non-GAAP Financial Measures This presentation includes certain non-GAAP financial measures that management uses to evaluate the Company’s operating business, measure performance, and make strategic decisions, including Adjusted EBITDA, Adjusted EBITDA Margin, free cash flow, unlevered free cash flow and net leverage. Adjusted EBITDA and Adjusted EBITDA Margin exclude the impact of interest expense, income taxes, depreciation and amortization, and certain other items that may vary for reasons unrelated to current period operating performance. Adjusted EBITDA excludes the results of the Safeguard small business distributor channel in the Print segment, which was sold in March 2026, and reflects post-transaction terms with the buyer. Free cash flow is defined as net cash provided by operating activities less purchases of capital assets and capitalized software costs. Unlevered Free Cash Flow is defined as tax-effected EBIT, adding back Depreciation & Amortization, and subtracting both the Change in Net Working Capital and Capital Expenditures. Net leverage is calculated as total debt (less cash and cash equivalents) divided by Adjusted EBITDA. Management uses these measures to evaluate operating results, facilitate period-to-period and peer comparisons, and inform strategic decision-making aimed at enhancing performance. These non-GAAP financial measures are not financial measures calculated in accordance with GAAP and should not be considered as a substitute for net income, operating profit, or any other operating performance measure calculated in accordance with GAAP. In addition, although other companies in Deluxe's industry may report measures titled with the same or similar descriptions, such non-GAAP financial measures may be calculated differently from how Deluxe calculates its non-GAAP financial measures, which reduces their overall usefulness as comparative measures. Because of these limitations, you should consider each of the non-GAAP financial measures referenced in this paragraph alongside other financial performance measures, including net income, net cash provided by operating activities and Deluxe's other financial results presented in accordance with GAAP. Deluxe does not provide quantitative reconciliation of forward-looking, non-GAAP financial measures, such as Adjusted EBITDA, Adjusted EBITDA margin, free cash flow and net leverage, to the most directly comparable GAAP financial measures because the Company does not provide outlook guidance on the reconciling items between the non-GAAP and GAAP measures. Due to the significant uncertainty and variability associated with certain forward-looking reconciling items such as restructuring and integration expense, gains and losses on sales of businesses and long-lived assets, and certain legal and environmental expenses, a reconciliation of forward-looking, non-GAAP financial measures to the corresponding GAAP measures cannot be provided without unreasonable effort. The potential impact of such reconciling items is substantial and, based on historical experience, could be material. 1 |
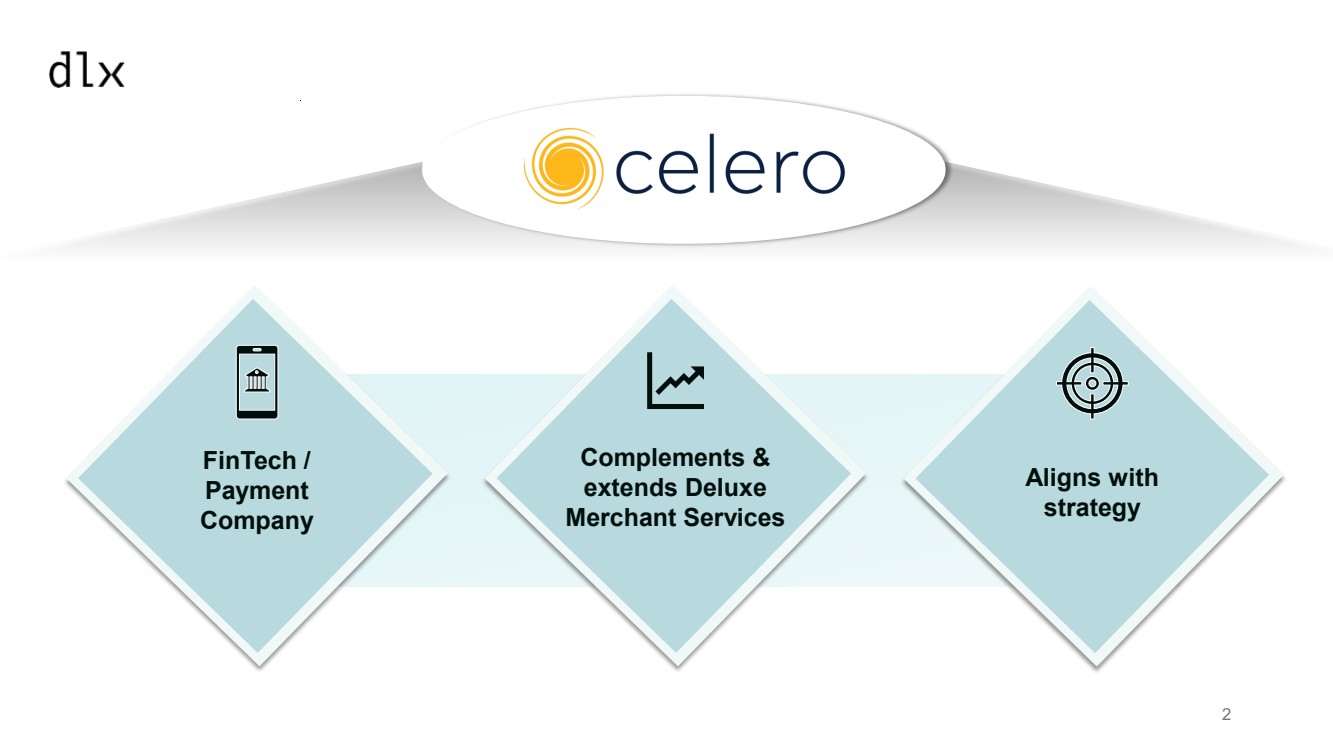
| 214 17 32 55 58 54 184 218 222 191 191 191 107 107 107 2c FinTech / Payment Company Complements & extends Deluxe Merchant Services Aligns with strategy 2 |
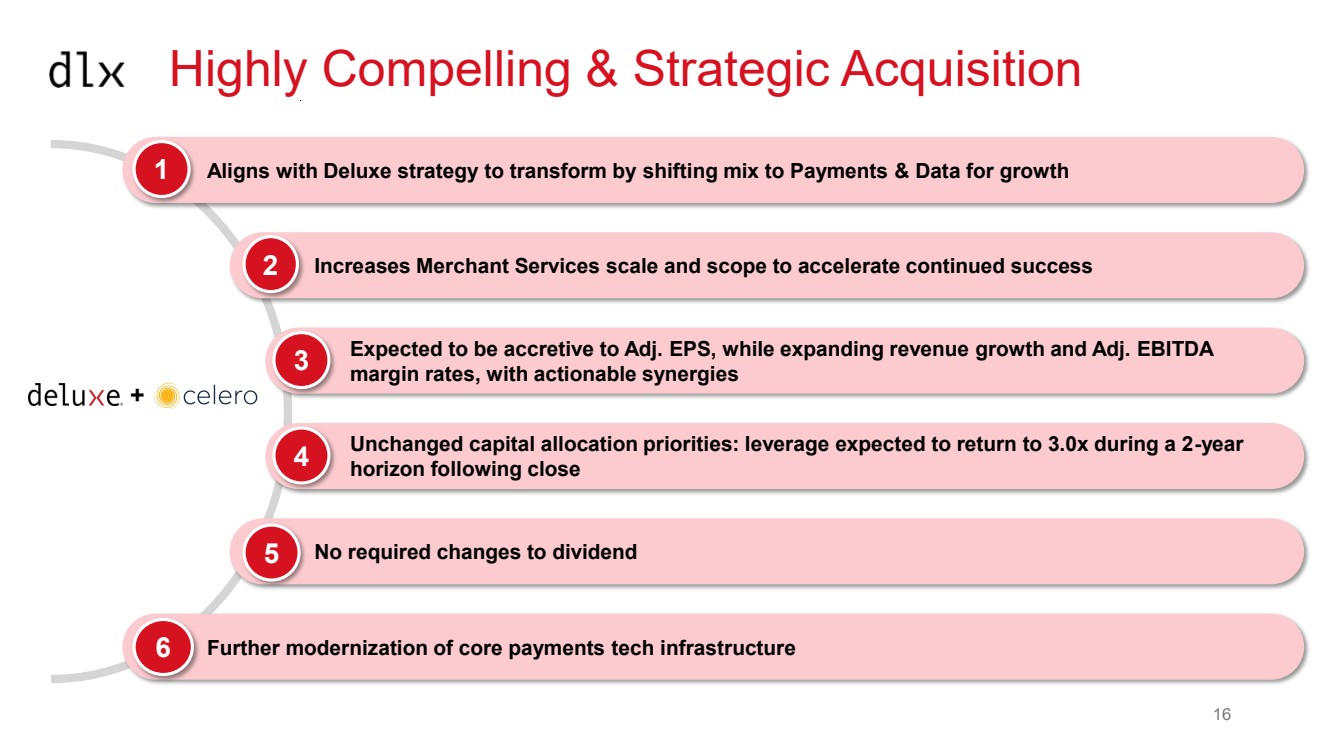
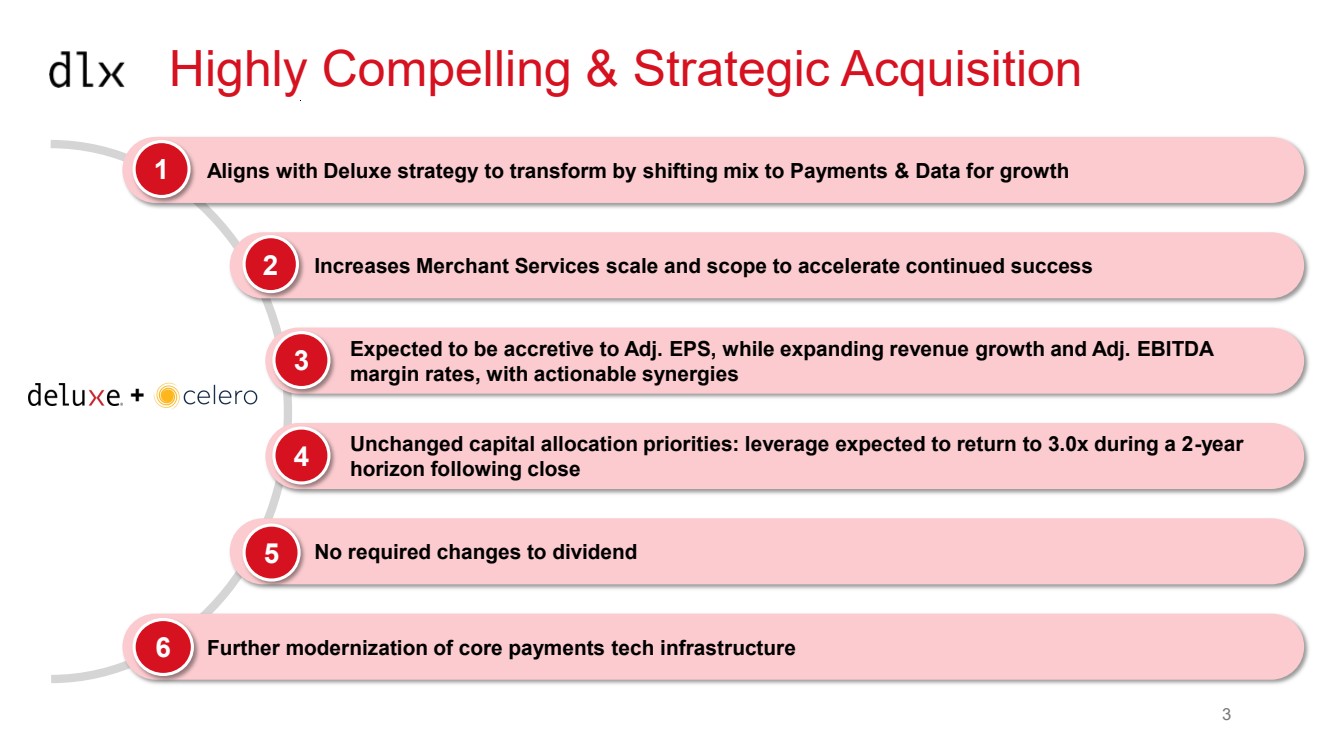
| 214 17 32 55 58 54 184 218 222 191 191 191 107 107 107 Highly Compelling & Strategic Acquisition 1 Aligns with Deluxe strategy to transform by shifting mix to Payments & Data for growth Expected to be accretive to Adj. EPS, while expanding revenue growth and Adj. EBITDA margin rates, with actionable synergies Unchanged capital allocation priorities: leverage expected to return to 3.0x during a 2-year horizon following close 3 6 Further modernization of core payments tech infrastructure + Increases Merchant Services scale and scope to accelerate continued success No required changes to dividend 2 4 5 3 |
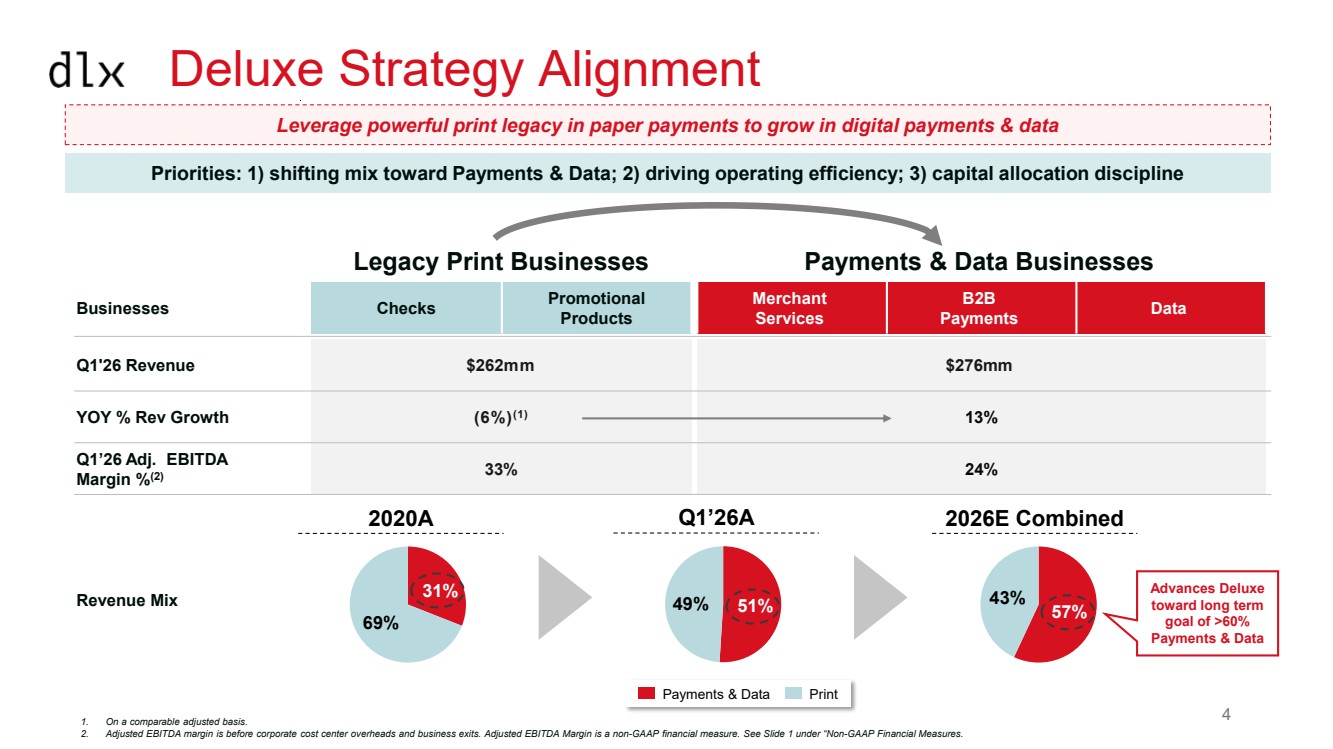
| 214 17 32 55 58 54 184 218 222 191 191 191 107 107 107 Deluxe Strategy Alignment Legacy Print Businesses Payments & Data Businesses Businesses Checks Promotional Products Merchant Services B2B Payments Data Q1'26 Revenue $262mm $276mm YOY % Rev Growth (6%)(1) 13% Q1’26 Adj. EBITDA Margin %(2) 33% 24% Revenue Mix 1. On a comparable adjusted basis. 2. Adjusted EBITDA margin is before corporate cost center overheads and business exits. Adjusted EBITDA Margin is a non-GAAP financial measure. See Slide 1 under “Non-GAAP Financial Measures. Payments & Data Print 31% 69% 2020A 57% 43% 2026E Combined Leverage powerful print legacy in paper payments to grow in digital payments & data 49% 51% Q1’26A Advances Deluxe toward long term goal of >60% Payments & Data Priorities: 1) shifting mix toward Payments & Data; 2) driving operating efficiency; 3) capital allocation discipline 4 |
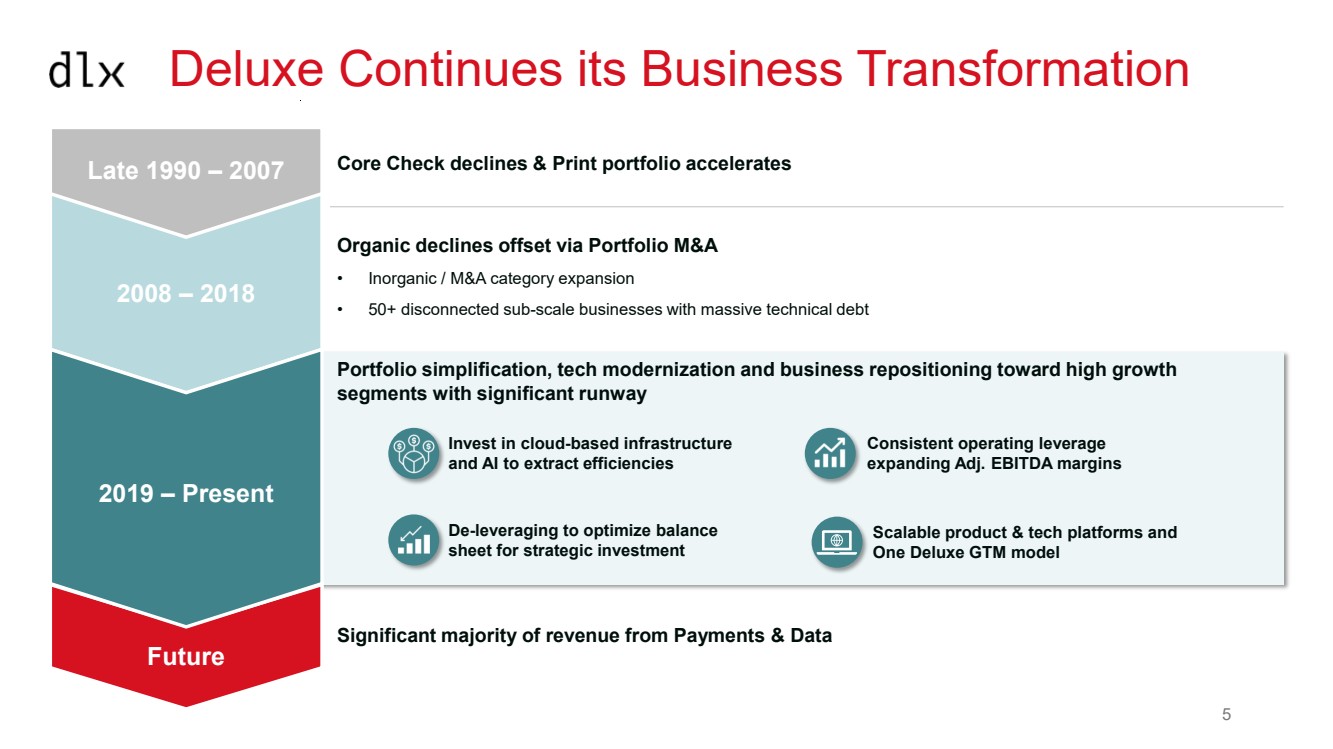
| 214 17 32 55 58 54 184 218 222 191 191 191 107 107 107 Deluxe Continues its Business Transformation Core Check declines & Print portfolio accelerates Organic declines offset via Portfolio M&A • Inorganic / M&A category expansion • 50+ disconnected sub-scale businesses with massive technical debt Portfolio simplification, tech modernization and business repositioning toward high growth segments with significant runway • Invest in cloud-based infrastructure and AI to extract efficiencies • Consistent operating leverage expanding Adj. EBITDA margins • De-leveraging to optimize balance sheet for strategic investment • Scalable product & tech platforms and One Deluxe GTM model 2008 – 2018 2019 – Present Significant majority of revenue from Payments & Data Future Late 1990 – 2007 5 |
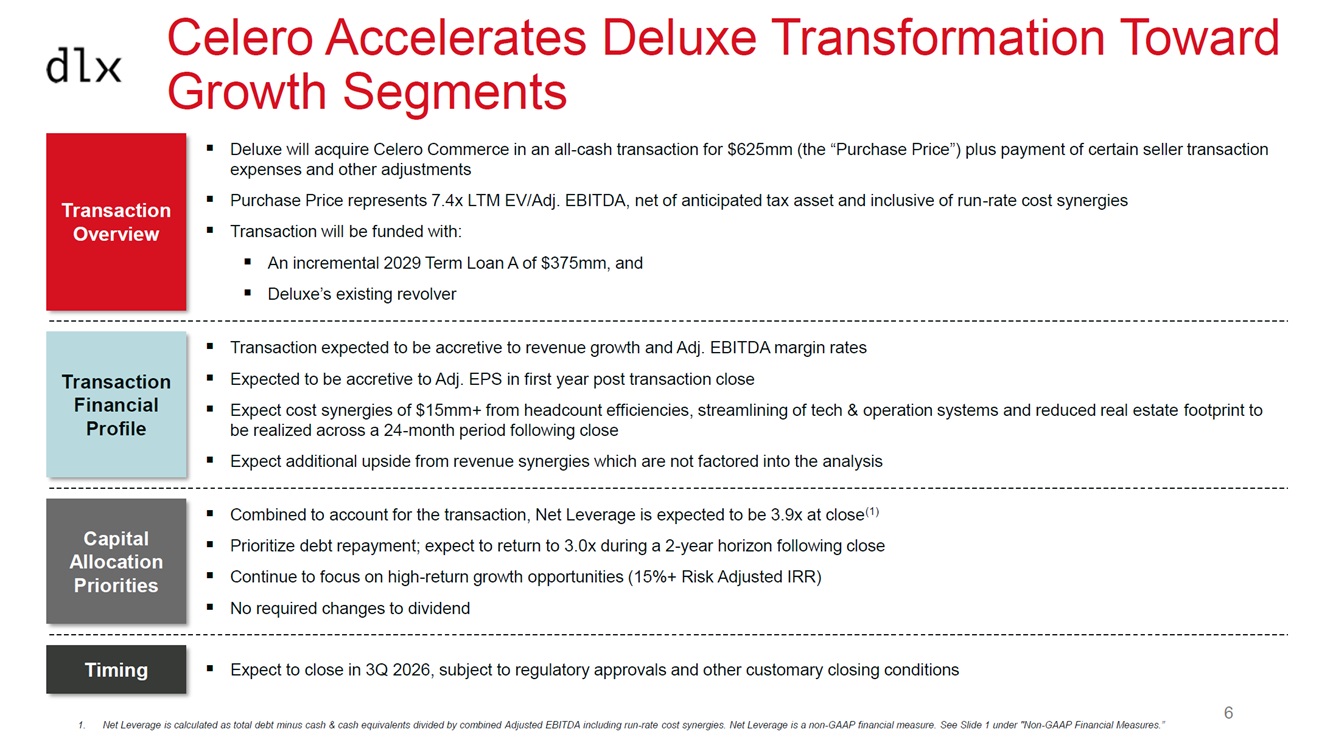
| 214 17 32 55 58 54 184 218 222 191 191 191 107 107 107 Celero Accelerates Deluxe Transformation Toward Growth Segments ▪ Transaction expected to be accretive to revenue growth and Adj. EBITDA margin rates ▪ Expected to be accretive to Adj. EPS in first year post transaction close ▪ Expect cost synergies of $15mm+ from headcount efficiencies, streamlining of tech & operation systems and reduced real estate footprint to be realized across a 24-month period following close ▪ Expect additional upside from revenue synergies which are not factored into the analysis ▪ Expect to close in 3Q 2026, subject to regulatory approvals and other customary closing conditions Transaction Overview Timing Transaction Financial Profile ▪ Deluxe will acquire Celero Commerce in an all-cash transaction for $625mm (the “Purchase Price”) plus payment of certain seller transaction expenses and other adjustments ▪ Purchase Price represents 7.4x LTM EV/Adj. EBITDA, net of anticipated tax asset and inclusive of run-rate cost synergies ▪ Transaction will be funded with: ▪ An incremental 2029 Term Loan A of $375mm, and ▪ Deluxe’s existing revolver Capital Allocation Priorities ▪ Combined to account for the transaction, Net Leverage is expected to be 3.9x at close(1) ▪ Prioritize debt repayment; expect to return to 3.0x during a 2-year horizon following close ▪ Continue to focus on high-return growth opportunities (15%+ Risk Adjusted IRR) ▪ No required changes to dividend 1. Net Leverage is calculated as total debt minus cash & cash equivalents divided by combined Adjusted EBITDA including run-rate cost synergies. Net Leverage is a non-GAAP financial measure. See Slide 1 under "Non-GAAP Financial Measures.” 6 |
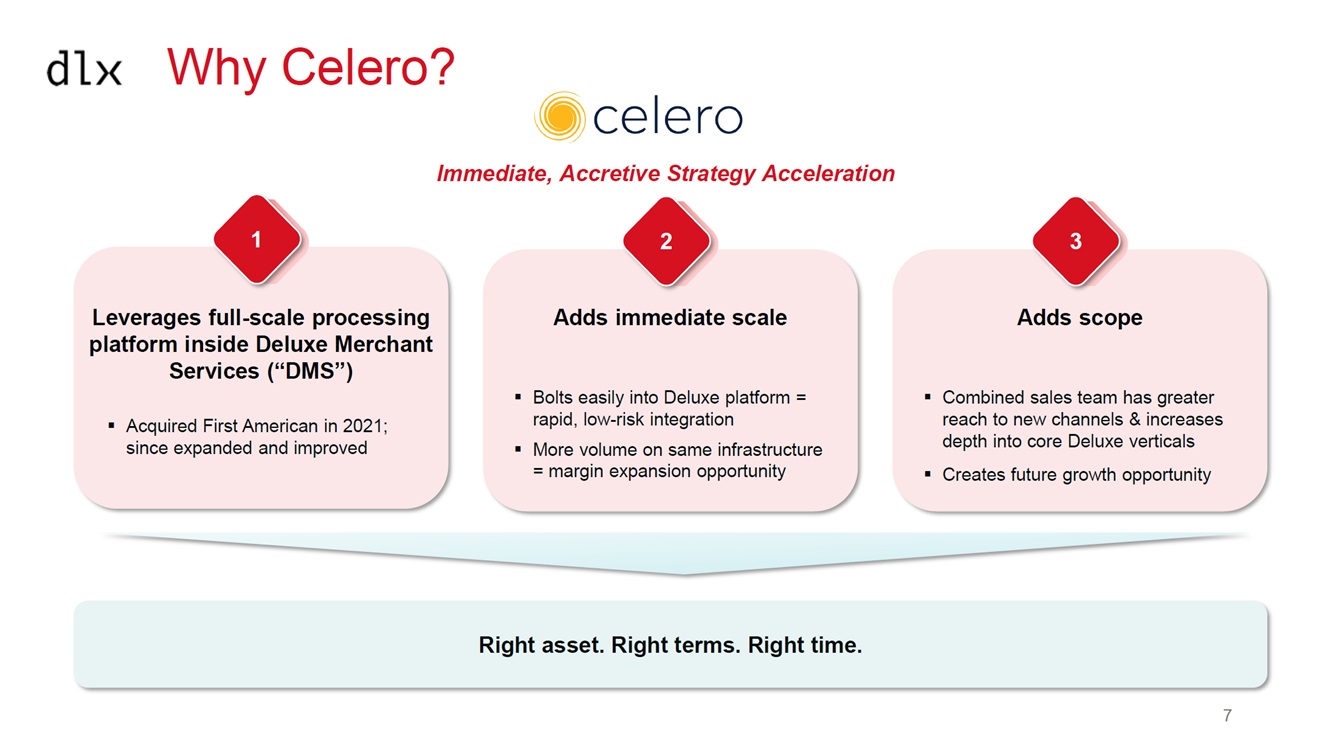
| 214 17 32 55 58 54 184 218 222 191 191 191 107 107 107 Why Celero? Immediate, Accretive Strategy Acceleration 1 2 3 Leverages full-scale processing platform inside Deluxe Merchant Services (“DMS”) ▪ Acquired First American in 2021; since expanded and improved Adds immediate scale ▪ Bolts easily into Deluxe platform = rapid, low-risk integration ▪ More volume on same infrastructure = margin expansion opportunity Adds scope ▪ Combined sales team has greater reach to new channels & increases depth into core Deluxe verticals ▪ Creates future growth opportunity Right asset. Right terms. Right time. 7 |
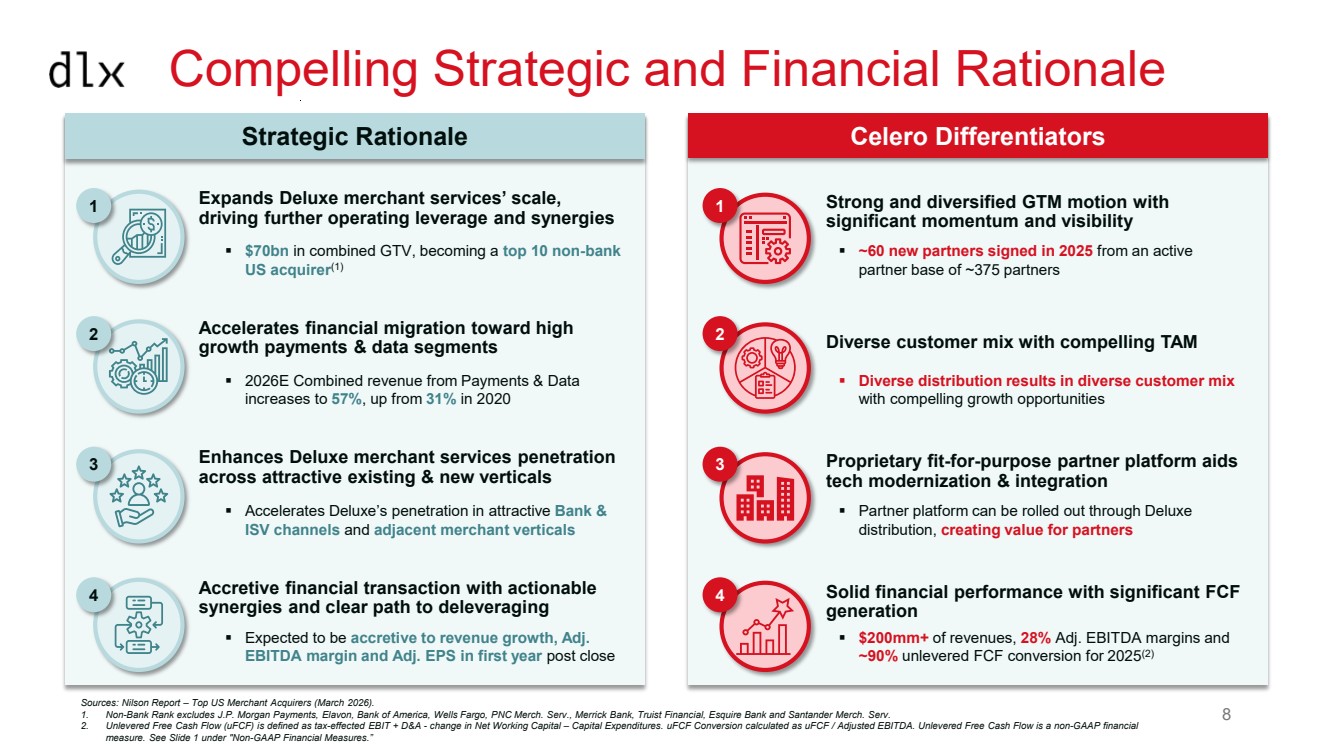
| 214 17 32 55 58 54 184 218 222 191 191 191 107 107 107 Compelling Strategic and Financial Rationale Celero Differentiators 1 2 3 4 Strong and diversified GTM motion with significant momentum and visibility Diverse customer mix with compelling TAM Proprietary fit-for-purpose partner platform aids tech modernization & integration Solid financial performance with significant FCF generation Strategic Rationale 1 2 3 4 Expands Deluxe merchant services’ scale, driving further operating leverage and synergies ▪ $70bn in combined GTV, becoming a top 10 non-bank US acquirer(1) Accelerates financial migration toward high growth payments & data segments ▪ 2026E Combined revenue from Payments & Data increases to 57%, up from 31% in 2020 Enhances Deluxe merchant services penetration across attractive existing & new verticals ▪ Accelerates Deluxe’s penetration in attractive Bank & ISV channels and adjacent merchant verticals Accretive financial transaction with actionable synergies and clear path to deleveraging ▪ Expected to be accretive to revenue growth, Adj. EBITDA margin and Adj. EPS in first year post close Sources: Nilson Report – Top US Merchant Acquirers (March 2026). 1. Non-Bank Rank excludes J.P. Morgan Payments, Elavon, Bank of America, Wells Fargo, PNC Merch. Serv., Merrick Bank, Truist Financial, Esquire Bank and Santander Merch. Serv. 2. Unlevered Free Cash Flow (uFCF) is defined as tax-effected EBIT + D&A - change in Net Working Capital – Capital Expenditures. uFCF Conversion calculated as uFCF / Adjusted EBITDA. Unlevered Free Cash Flow is a non-GAAP financial measure. See Slide 1 under "Non-GAAP Financial Measures.” ▪ Diverse distribution results in diverse customer mix with compelling growth opportunities ▪ Partner platform can be rolled out through Deluxe distribution, creating value for partners ▪ $200mm+ of revenues, 28% Adj. EBITDA margins and ~90% unlevered FCF conversion for 2025(2) ▪ ~60 new partners signed in 2025 from an active partner base of ~375 partners 8 |
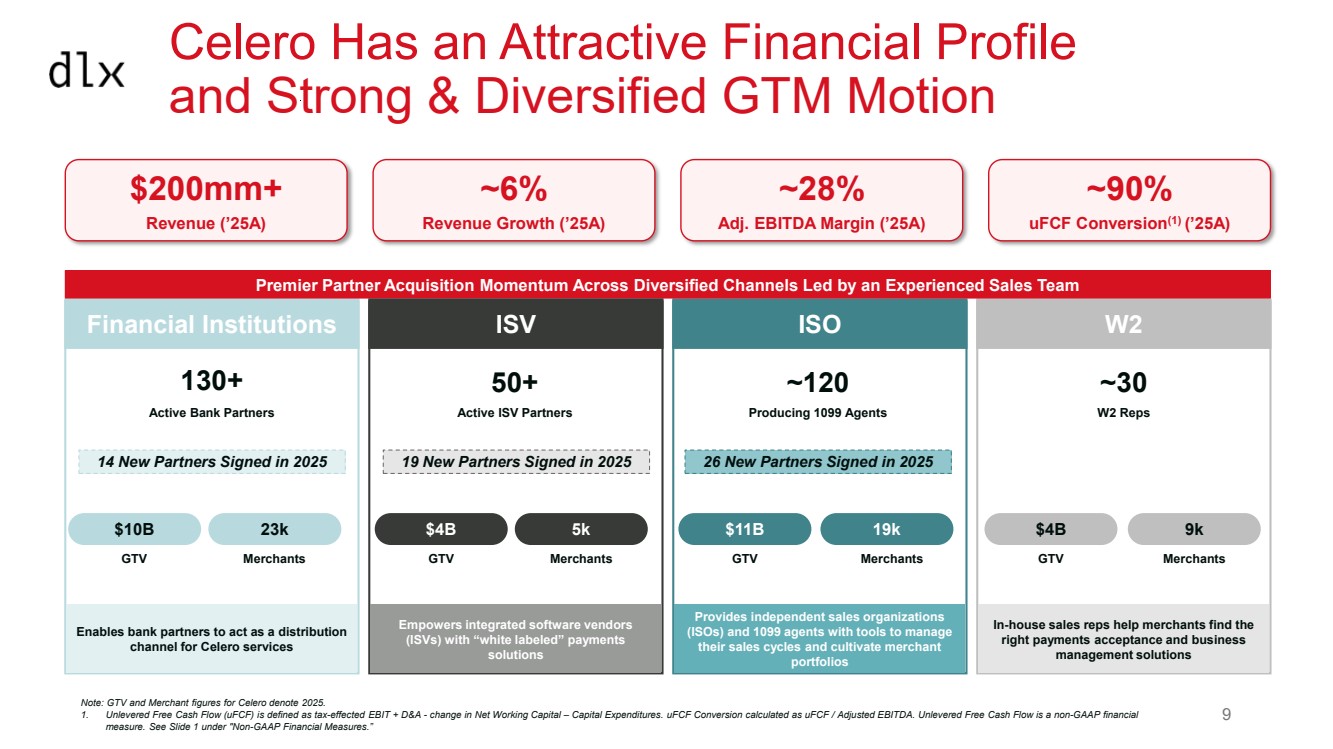
| 214 17 32 55 58 54 184 218 222 191 191 191 107 107 107 Celero Has an Attractive Financial Profile and Strong & Diversified GTM Motion Financial Institutions ISO W2 130+ Active Bank Partners 50+ Active ISV Partners ~120 Producing 1099 Agents ~30 W2 Reps $10B GTV Merchants $4B GTV 5k Merchants $11B GTV 19k Merchants $4B GTV 9k Merchants 23k Premier Partner Acquisition Momentum Across Diversified Channels Led by an Experienced Sales Team 14 New Partners Signed in 2025 19 New Partners Signed in 2025 26 New Partners Signed in 2025 ISV $200mm+ Revenue (’25A) ~6% Revenue Growth (’25A) ~28% Adj. EBITDA Margin (’25A) ~90% uFCF Conversion(1) (’25A) Note: GTV and Merchant figures for Celero denote 2025. 1. Unlevered Free Cash Flow (uFCF) is defined as tax-effected EBIT + D&A - change in Net Working Capital – Capital Expenditures. uFCF Conversion calculated as uFCF / Adjusted EBITDA. Unlevered Free Cash Flow is a non-GAAP financial measure. See Slide 1 under "Non-GAAP Financial Measures.” Enables bank partners to act as a distribution channel for Celero services Empowers integrated software vendors (ISVs) with “white labeled” payments solutions Provides independent sales organizations (ISOs) and 1099 agents with tools to manage their sales cycles and cultivate merchant portfolios In-house sales reps help merchants find the right payments acceptance and business management solutions 9 |
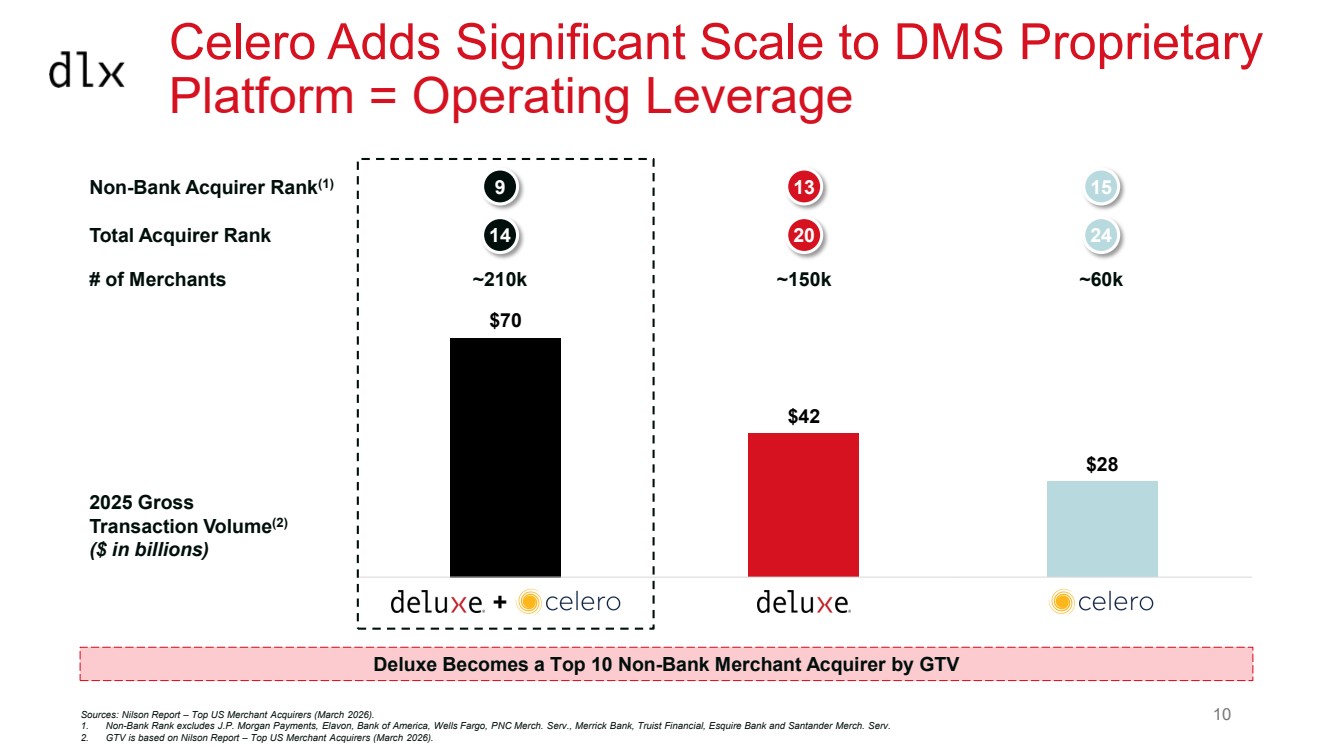
| 214 17 32 55 58 54 184 218 222 191 191 191 107 107 107 $28 $42 $70 DLX + Ce le ro Deluxe Me rch. Serv. Ce lero Commerce Celero Adds Significant Scale to DMS Proprietary Platform = Operating Leverage Sources: Nilson Report – Top US Merchant Acquirers (March 2026). 1. Non-Bank Rank excludes J.P. Morgan Payments, Elavon, Bank of America, Wells Fargo, PNC Merch. Serv., Merrick Bank, Truist Financial, Esquire Bank and Santander Merch. Serv. 2. GTV is based on Nilson Report – Top US Merchant Acquirers (March 2026). Deluxe Becomes a Top 10 Non-Bank Merchant Acquirer by GTV + Total Acquirer Rank 14 20 24 Non-Bank Acquirer Rank 9 13 15 (1) 2025 Gross Transaction Volume(2) ($ in billions) # of Merchants ~210k ~150k ~60k 10 |
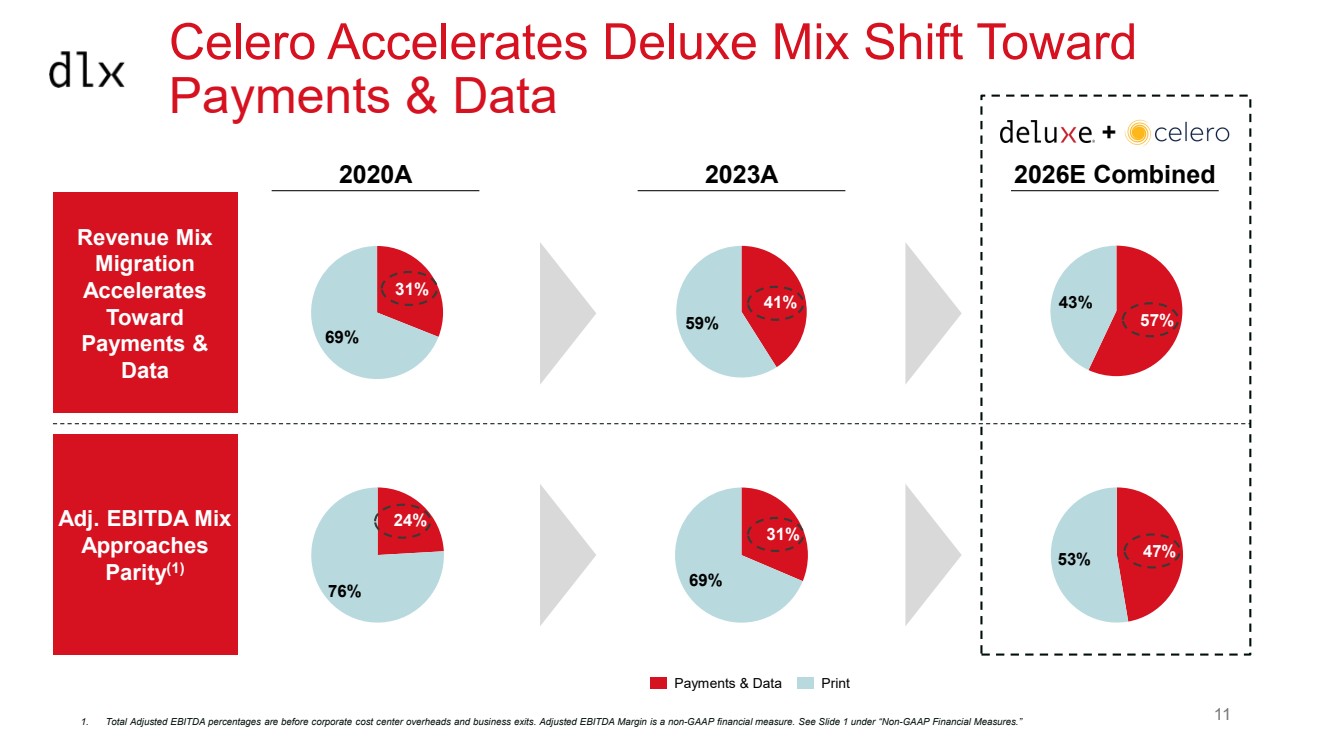
| 214 17 32 55 58 54 184 218 222 191 191 191 107 107 107 31% 69% 57% 43% Payments & Data Print 41% 59% 2020A 2023A 2026E Combined 47% 53% Revenue Mix Migration Accelerates Toward Payments & Data 24% 76% Adj. EBITDA Mix Approaches Parity(1) 31% 69% Celero Accelerates Deluxe Mix Shift Toward Payments & Data 1. Total Adjusted EBITDA percentages are before corporate cost center overheads and business exits. Adjusted EBITDA Margin is a non-GAAP financial measure. See Slide 1 under “Non-GAAP Financial Measures.” + 11 |
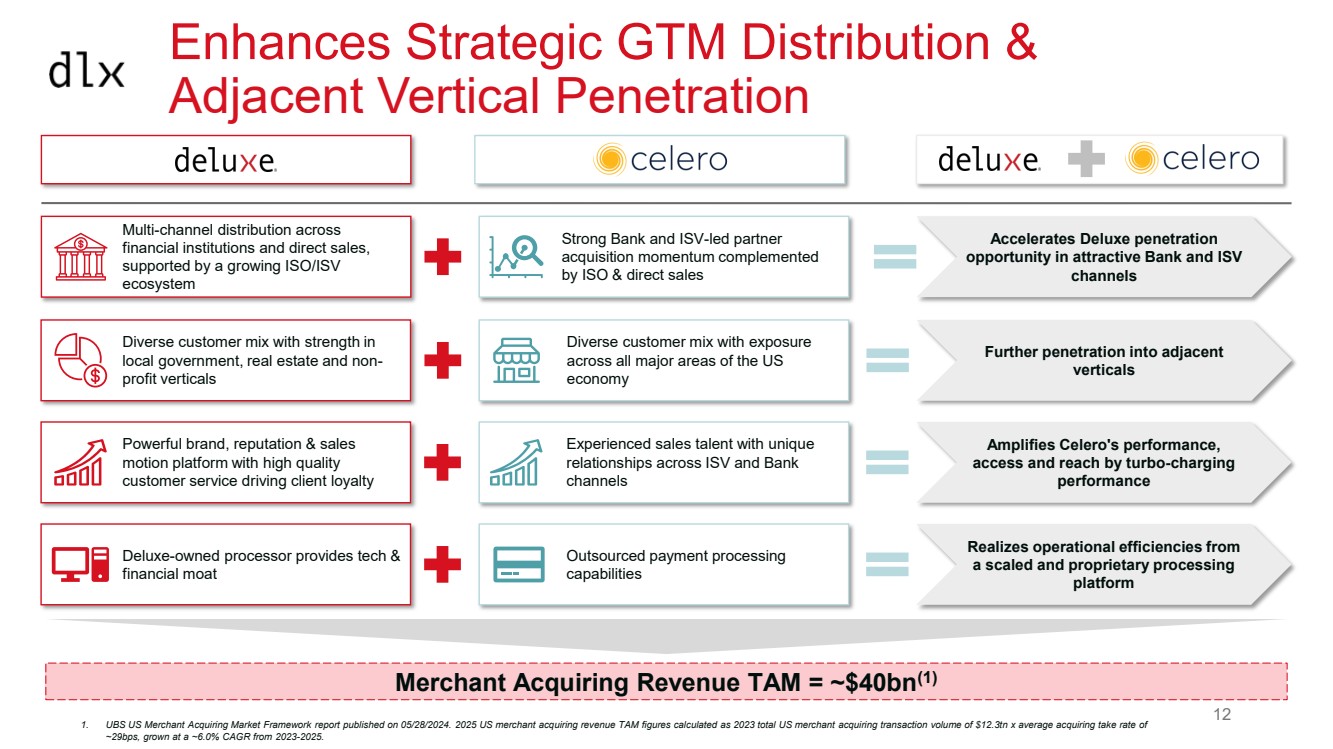
| 214 17 32 55 58 54 184 218 222 191 191 191 107 107 107 Enhances Strategic GTM Distribution & Adjacent Vertical Penetration Merchant Acquiring Revenue TAM = ~$40bn(1) Further penetration into adjacent verticals Diverse customer mix with exposure across all major areas of the US economy Diverse customer mix with strength in local government, real estate and non-profit verticals Accelerates Deluxe penetration opportunity in attractive Bank and ISV channels Strong Bank and ISV-led partner acquisition momentum complemented by ISO & direct sales Multi-channel distribution across financial institutions and direct sales, supported by a growing ISO/ISV ecosystem Amplifies Celero's performance, access and reach by turbo-charging performance Powerful brand, reputation & sales motion platform with high quality customer service driving client loyalty Experienced sales talent with unique relationships across ISV and Bank channels Realizes operational efficiencies from a scaled and proprietary processing platform Deluxe-owned processor provides tech & financial moat Outsourced payment processing capabilities 1. UBS US Merchant Acquiring Market Framework report published on 05/28/2024. 2025 US merchant acquiring revenue TAM figures calculated as 2023 total US merchant acquiring transaction volume of $12.3tn x average acquiring take rate of ~29bps, grown at a ~6.0% CAGR from 2023-2025. 12 |
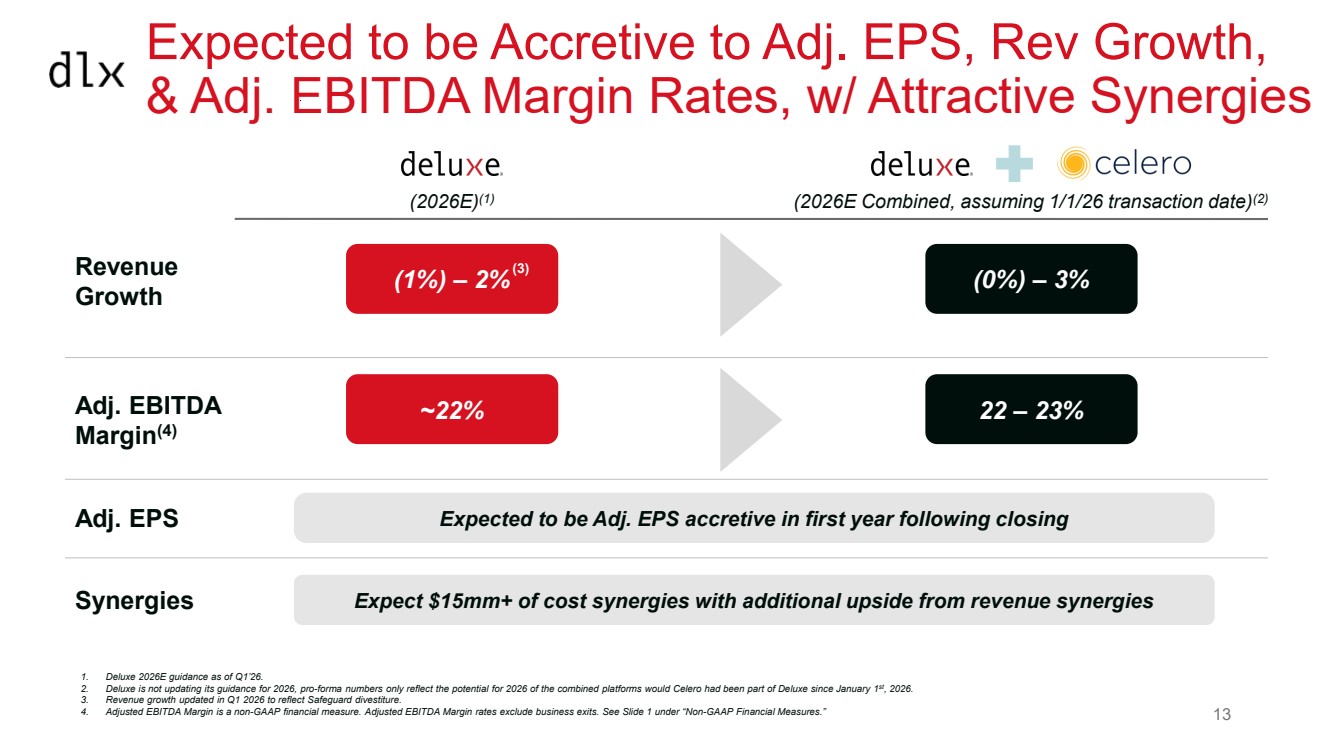
| 214 17 32 55 58 54 184 218 222 191 191 191 107 107 107 Expected to be Accretive to Adj. EPS, Rev Growth, & Adj. EBITDA Margin Rates, w/ Attractive Synergies Expect $15mm+ of cost synergies with additional upside from revenue synergies Revenue Growth Adj. EBITDA Margin(4) Adj. EPS Expected to be Adj. EPS accretive in first year following closing (0%) – 3% 22 – 23% (1%) – 2% ~22% 1. Deluxe 2026E guidance as of Q1’26. 2. Deluxe is not updating its guidance for 2026, pro-forma numbers only reflect the potential for 2026 of the combined platforms would Celero had been part of Deluxe since January 1st, 2026. 3. Revenue growth updated in Q1 2026 to reflect Safeguard divestiture. 4. Adjusted EBITDA Margin is a non-GAAP financial measure. Adjusted EBITDA Margin rates exclude business exits. See Slide 1 under “Non-GAAP Financial Measures.” (2026E)(1) (2026E Combined, assuming 1/1/26 transaction date)(2) Synergies (3) 13 |
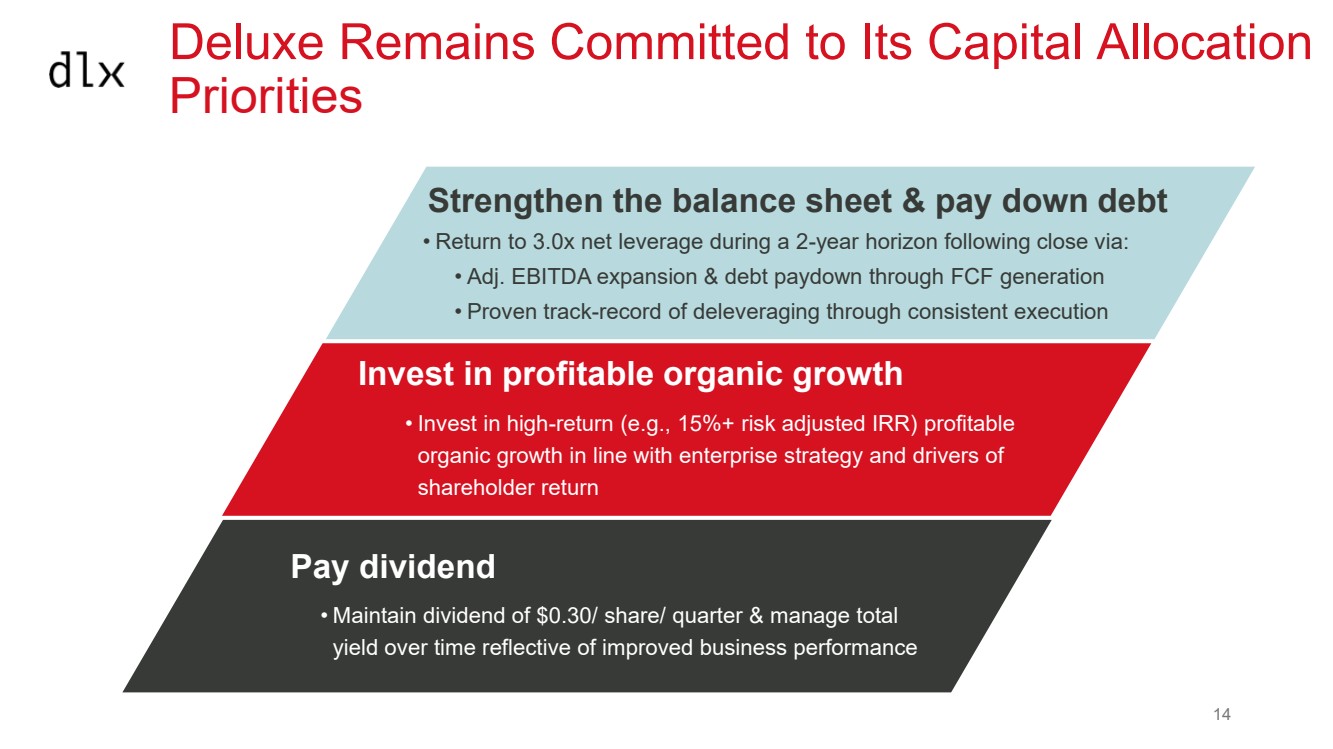
| 214 17 32 55 58 54 184 218 222 191 191 191 107 107 107 Strengthen the balance sheet & pay down debt • Return to 3.0x net leverage during a 2-year horizon following close via: • Adj. EBITDA expansion & debt paydown through FCF generation • Proven track-record of deleveraging through consistent execution Invest in profitable organic growth • Invest in high-return (e.g., 15%+ risk adjusted IRR) profitable organic growth in line with enterprise strategy and drivers of shareholder return Pay dividend • Maintain dividend of $0.30/ share/ quarter & manage total yield over time reflective of improved business performance Deluxe Remains Committed to Its Capital Allocation Priorities 14 |
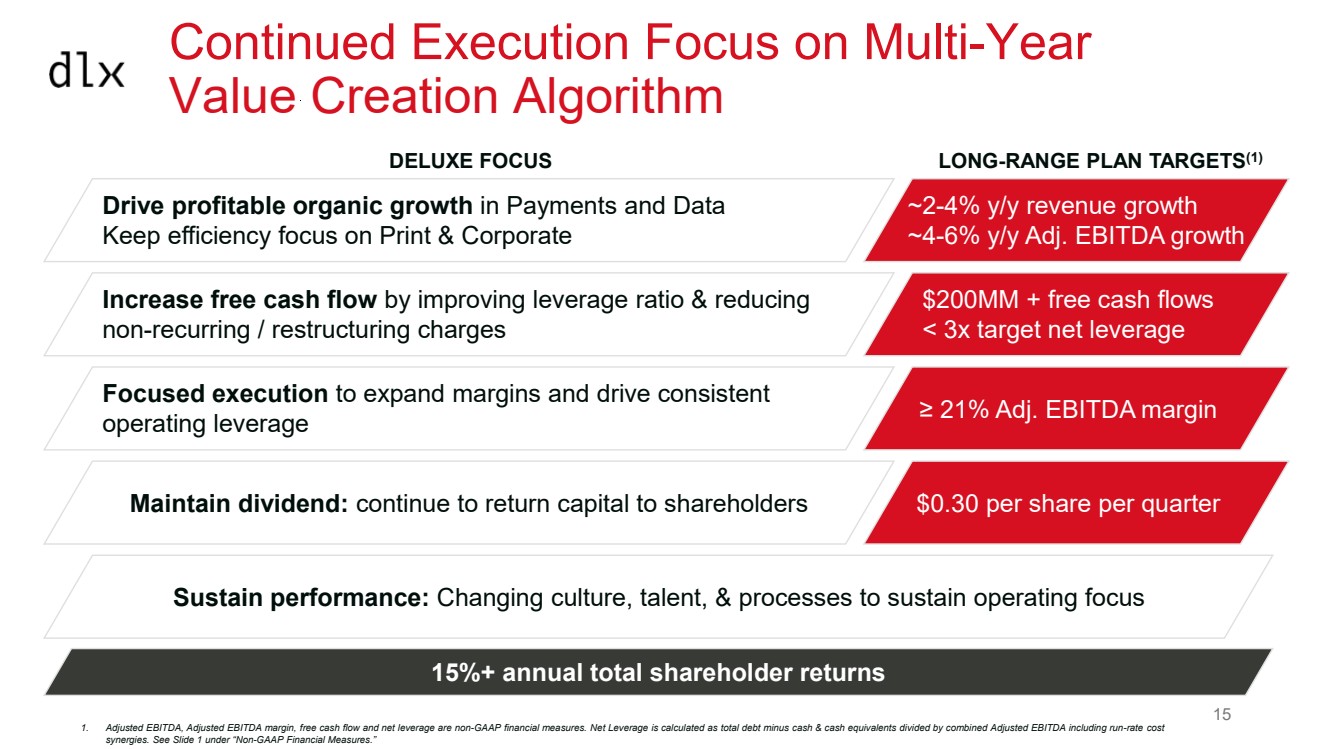
| 214 17 32 55 58 54 184 218 222 191 191 191 107 107 107 Continued Execution Focus on Multi-Year Value Creation Algorithm Sustain performance: Changing culture, talent, & processes to sustain operating focus 15%+ annual total shareholder returns Drive profitable organic growth in Payments and Data Keep efficiency focus on Print & Corporate ~2-4% y/y revenue growth ~4-6% y/y Adj. EBITDA growth Increase free cash flow by improving leverage ratio & reducing non-recurring / restructuring charges $200MM + free cash flows < 3x target net leverage Focused execution to expand margins and drive consistent operating leverage ≥ 21% Adj. EBITDA margin Maintain dividend: continue to return capital to shareholders $0.30 per share per quarter DELUXE FOCUS LONG-RANGE PLAN TARGETS(1) 1. Adjusted EBITDA, Adjusted EBITDA margin, free cash flow and net leverage are non-GAAP financial measures. Net Leverage is calculated as total debt minus cash & cash equivalents divided by combined Adjusted EBITDA including run-rate cost synergies. See Slide 1 under “Non-GAAP Financial Measures.” 15 |
| 214 17 32 55 58 54 184 218 222 191 191 191 107 107 107 Highly Compelling & Strategic Acquisition 1 Aligns with Deluxe strategy to transform by shifting mix to Payments & Data for growth Expected to be accretive to Adj. EPS, while expanding revenue growth and Adj. EBITDA margin rates, with actionable synergies Unchanged capital allocation priorities: leverage expected to return to 3.0x during a 2-year horizon following close 3 6 Further modernization of core payments tech infrastructure + Increases Merchant Services scale and scope to accelerate continued success No required changes to dividend 2 4 5 16 |